

Markets are facing slight bear activity as seen from the global market cap’s drop as majority of tokens correct from yesterday’s pump. The total cap stood at $1.97T as of press time representing a 0.09% drop in the last 24 hours.
トークンの大部分が昨日のポンプから修正されたため、世界的な時価総額の下落から分かるように、市場は若干の弱気相場に直面している。記事執筆時点での総額上限は 1.97 兆ドルで、過去 24 時間で 0.09% 下落しました。
Bitcoin Price Review
Analysing Bitcoin charts, we see the price is currently above the SuperTrend line, indicating a bullish trend. The Relative Strength Index (RSI) is around 54, which is neutral. This means that the market is not showing signs of being overbought or oversold.
ビットコイン価格のレビュービットコインのチャートを分析すると、価格が現在スーパートレンドラインを上回っており、強気傾向を示していることがわかります。相対強度指数 (RSI) は約 54 で、中立です。これは、市場が買われすぎまたは売られすぎの兆候を示していないことを意味します。
The Bitcoin price has been in an uptrend, as evidenced by the higher lows and higher highs. The trend might continue, but one should watch for any potential reversal patterns as the RSI moves closer to overbought or oversold levels. The Bitcoin price stood at $51.8K representing a 1% drop in the last 24 hours as of press time.
ビットコイン価格は、安値の上昇と高値の上昇によって証明されるように、上昇傾向にあります。この傾向は続く可能性がありますが、RSI が買われすぎまたは売られすぎのレベルに近づくにつれて、潜在的な反転パターンに注意する必要があります。本稿執筆時点でビットコイン価格は51.8万ドルで、過去24時間で1%下落した。
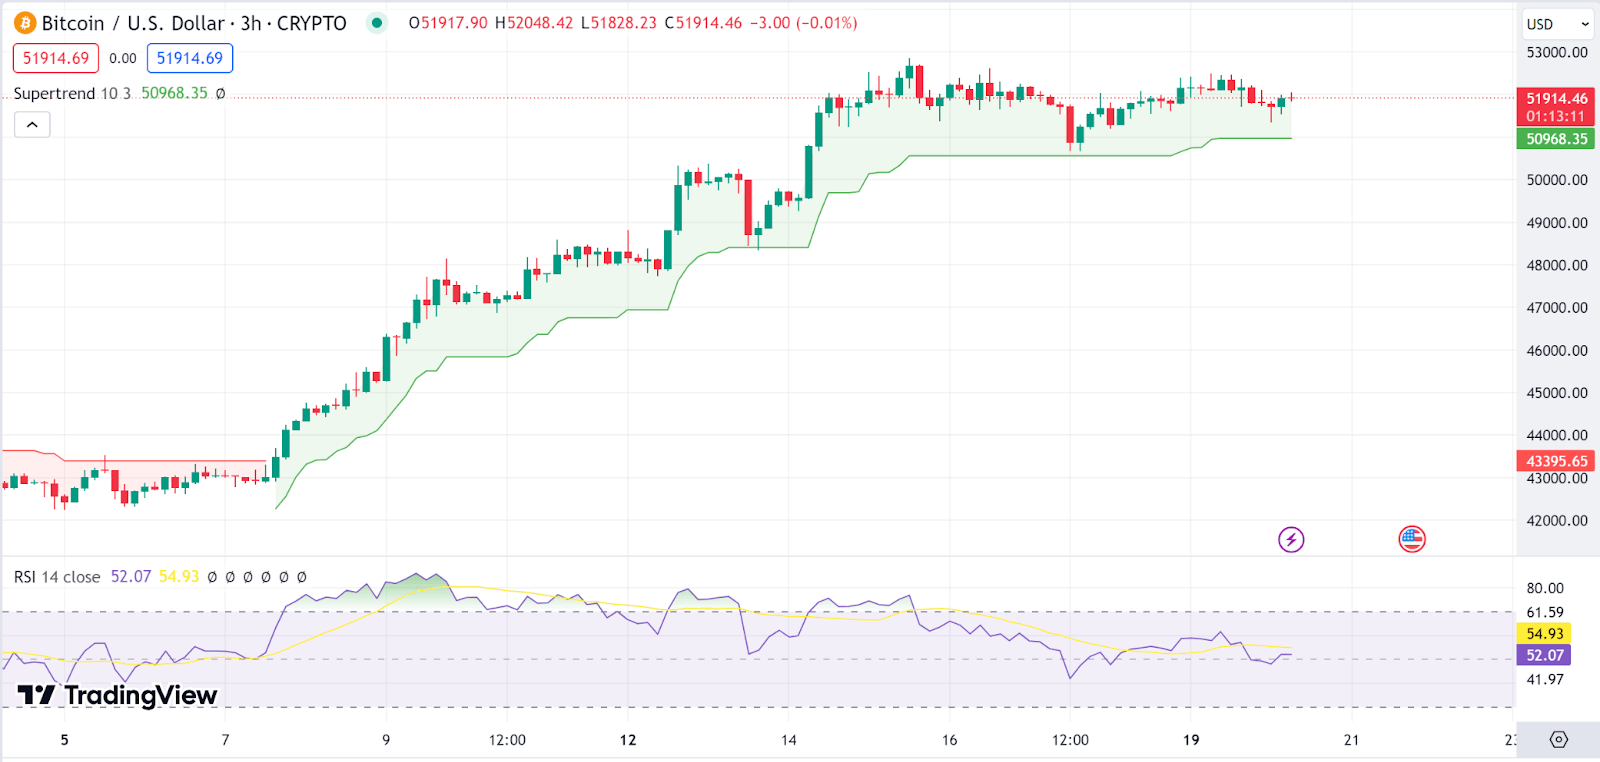 BTC 3-hour chart | Source: TradingView
BTC 3時間足チャート |出典: TradingView
Ethereum Price Review
Ethereum price has also fallen pray to today’s downtrend as the Money Flow Index (MFI( is high at 73, suggesting that the market could be approaching overbought conditions. On the other hand, the Moving Average Convergence Divergence (MACD) line is above the signal line, indicating bullish momentum on the Ethereum price. However, the histogram shows a decrease in momentum as the bars are getting smaller.
イーサリアム価格レビューマネーフローインデックス(MFI()が73と高く、市場が買われ過ぎの状態に近づいている可能性があることを示唆しているため、今日の下降傾向を反映してイーサリアム価格も下落しました。一方、移動平均収束ダイバージェンス(MACD)ラインは上にありますシグナルラインはイーサリアム価格の強気の勢いを示していますが、ヒストグラムはバーが小さくなるにつれて勢いが低下していることを示しています。
Looking at price movement, we see the Ethereum price is also in an uptrend, with a recent pullback. The Ethereum price stood at $2,919 representing a 0.1% drop in the last 24 hours as of press time.
価格の動きを見ると、イーサリアム価格も上昇傾向にあり、最近は反落しています。本稿執筆時点でイーサリアムの価格は2,919ドルで、過去24時間で0.1%下落した。
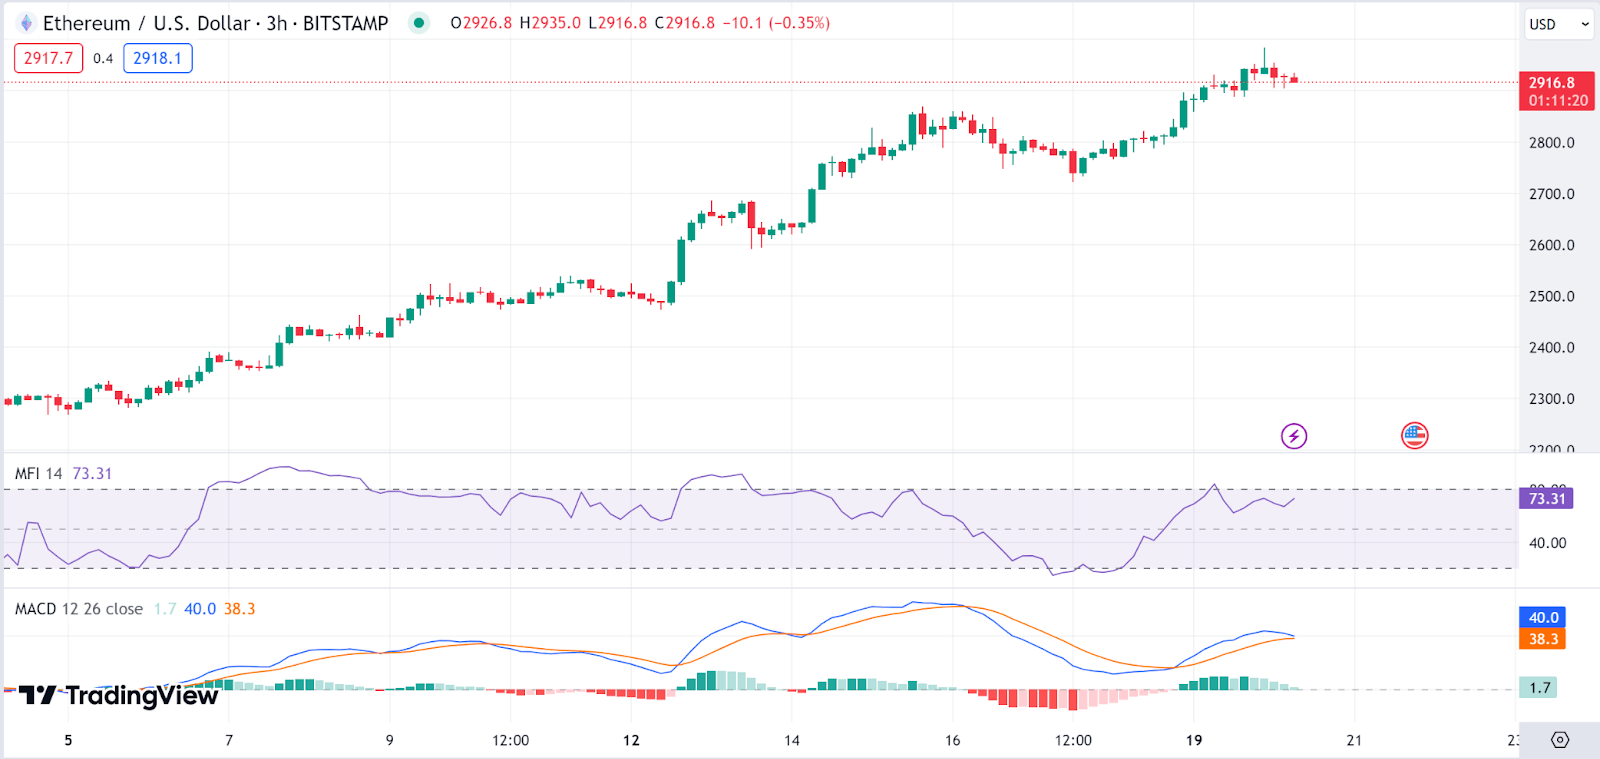 ETH 3-hour chart | Source: TradingView
ETH 3時間足チャート |出典: TradingView
BNB Price Review
Despite the general downturn, BNB price has defied the odds to become one of the top gainers. The BNB price is trading near the upper band, indicating a strong upward momentum, but also a potential for a pullback if the price is considered overextended.
BNB 価格のレビュー全体的な下落にもかかわらず、BNB 価格は予想を無視してトップの値上がり者の一つとなりました。 BNB価格はアッパーバンド付近で取引されており、強い上昇の勢いを示しているが、価格が行き過ぎとみなされる場合には反落の可能性もある。
On the flip side, the Average Directional Index (ADX) value is 21.71, which suggests a moderate trend strength. It’s not particularly strong, but there is a definite trend. Despite the ADX indicating a moderate trend, suggesting that while there is momentum, it might not be excessively strong. The BNB price stood at $357.7 representing a 1% jump in the last 24 hours as of press time.
一方、平均方向性指数 (ADX) の値は 21.71 であり、トレンドが中程度に強いことを示しています。特別強いわけではありませんが、明確な傾向があります。 ADX は緩やかな傾向を示しているにもかかわらず、勢いはあるものの過度に強いわけではない可能性があることを示唆しています。この記事の執筆時点で、BNB価格は357.7ドルで、過去24時間で1%の上昇を示しています。
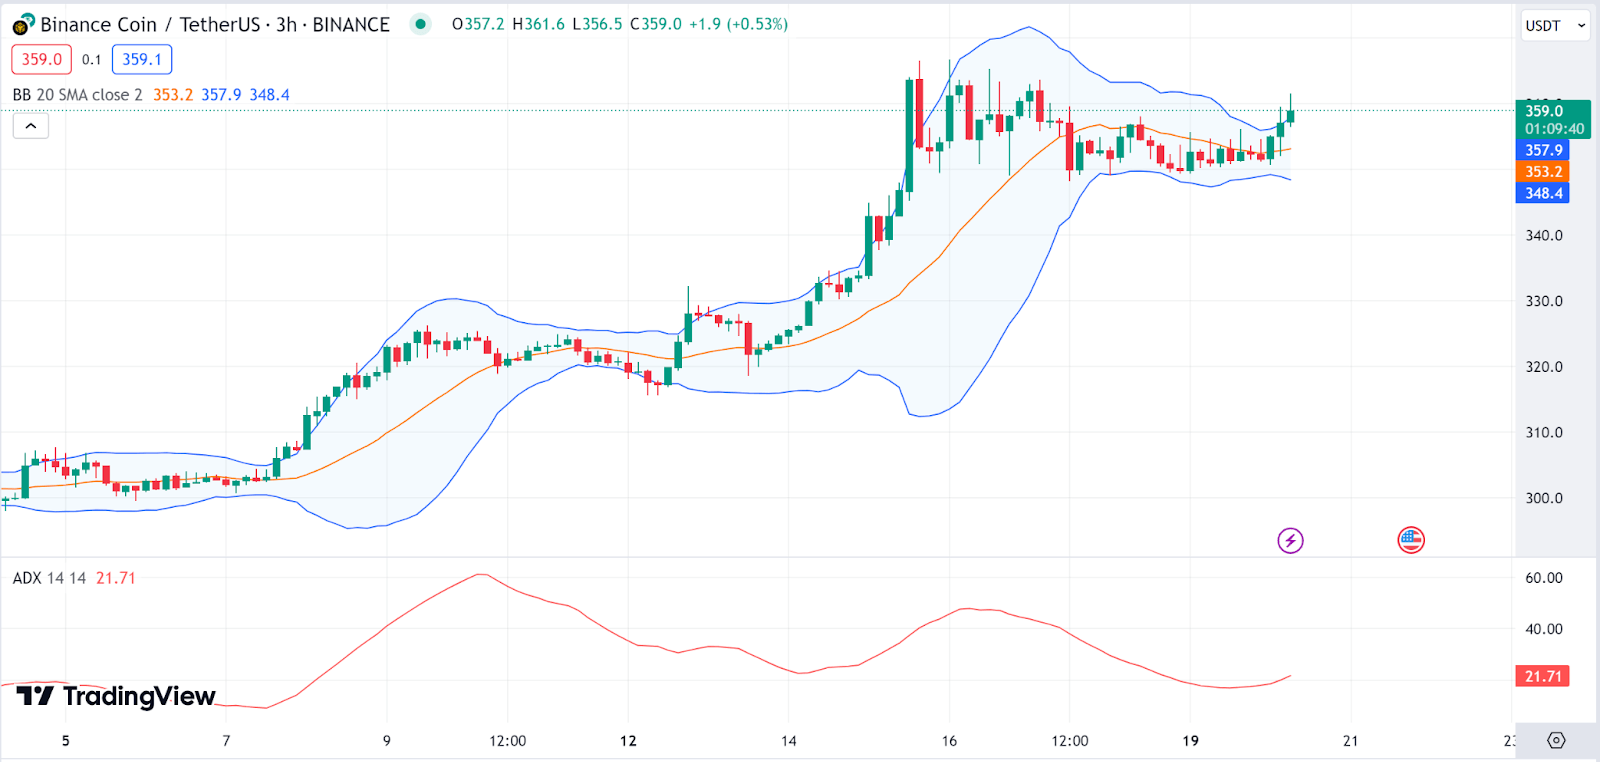 BNB 3-hour chart | Source: TradingView
BNB3時間足チャート |出典: TradingView
Ripple Price Review
Ripple (XRP) has also appeared aiming the few gainers today. The ripple price is trading within the upper half of the pitchfork, which indicates a bullish trend. Additionally, the ADX value is low at 15.10, suggesting the trend is weak.
リップル価格レビューリップル(XRP)も今日、少数の値上がり者を狙って登場しました。リップル価格はピッチフォークの上半分内で取引されており、強気傾向を示しています。さらに、ADX 値は 15.10 と低く、トレンドが弱いことを示唆しています。
XRP’s current price action is moderately bullish within the context of the pitchfork, but the low ADX value indicates the trend isn’t very strong. This could imply that XRP may enter a consolidation phase or that the trend could easily reverse. The Ripple price stood at $0.566 representing a 0.6% jump in the last 24 hours as of press time.
XRPの現在の価格動向は、ピッチフォークの文脈ではやや強気ですが、ADX値が低いことは、トレンドがそれほど強くないことを示しています。これは、XRPが統合段階に入る可能性があること、またはトレンドが簡単に逆転する可能性があることを示唆している可能性があります。本稿執筆時点でリップル価格は0.566ドルで、過去24時間で0.6%の上昇を示した。
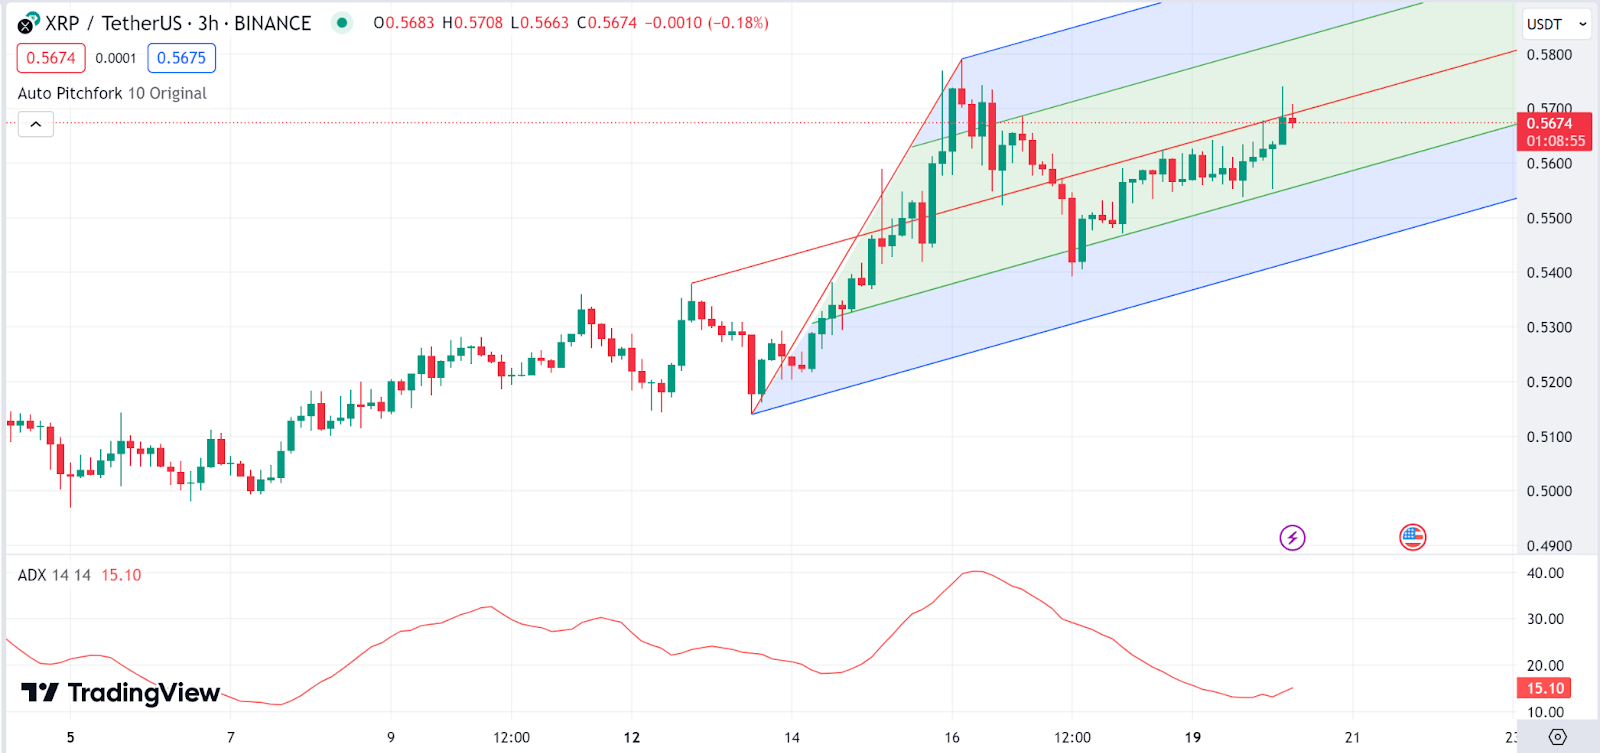 XRP 3-hour chart | Source: TradingView
XRP 3時間足チャート |出典: TradingView
Dogecoin Price Review
Dogecoin (DOGE) is our last gainer in today’s bear market. The Dogecoin price is above the Alligator’s jaw (blue line), suggesting a bullish trend. On the flip side, the MACD line is above the signal line, and the histogram shows positive momentum.
Dogecoin 価格レビューDogecoin (DOGE) は、今日の弱気市場で最後の上昇銘柄です。ドージコインの価格はワニの顎(青い線)を上回っており、強気傾向を示唆しています。反対に、MACD ラインはシグナルラインよりも上にあり、ヒストグラムはプラスの勢いを示しています。
The positive histogram on the MACD suggests growing momentum. The Dogecoin price stood at $0.08708 representing a 0.39% jump in the last 24 hours as of press time.
MACD のプラスのヒストグラムは、勢いが増していることを示しています。記事執筆時点で、ドージコインの価格は0.08708ドルで、過去24時間で0.39%の上昇を示しています。
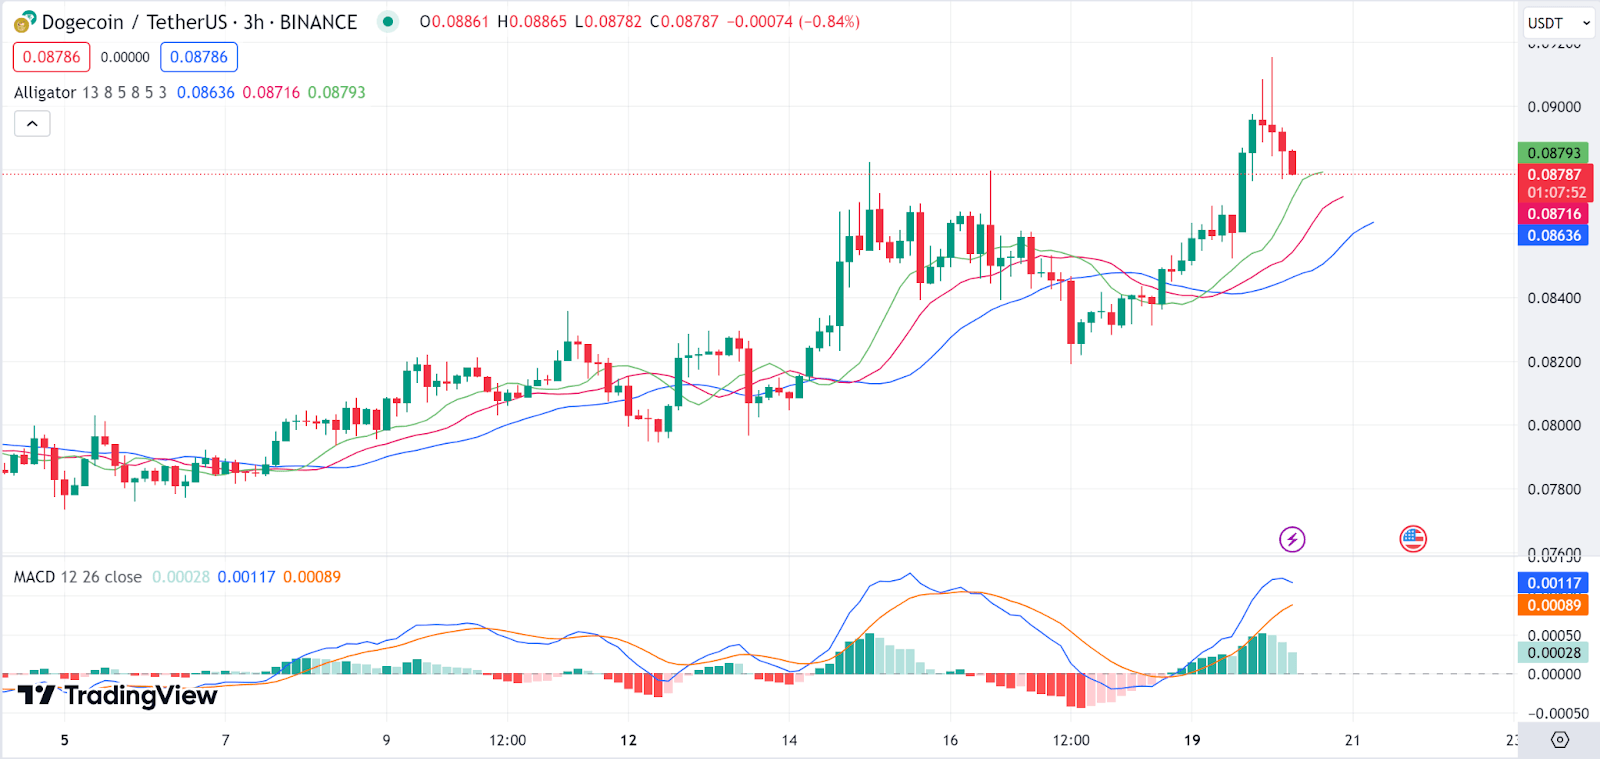 DOGE 3-hour chart | Source: TradingView
DOGE 3時間足チャート |出典: TradingView
 Coin Edition
 DogeHome
 Coin_Gabbar
 Coincu
 BlockchainReporter
 CoinPedia News
 TheNewsCrypto
 CFN
CFN


