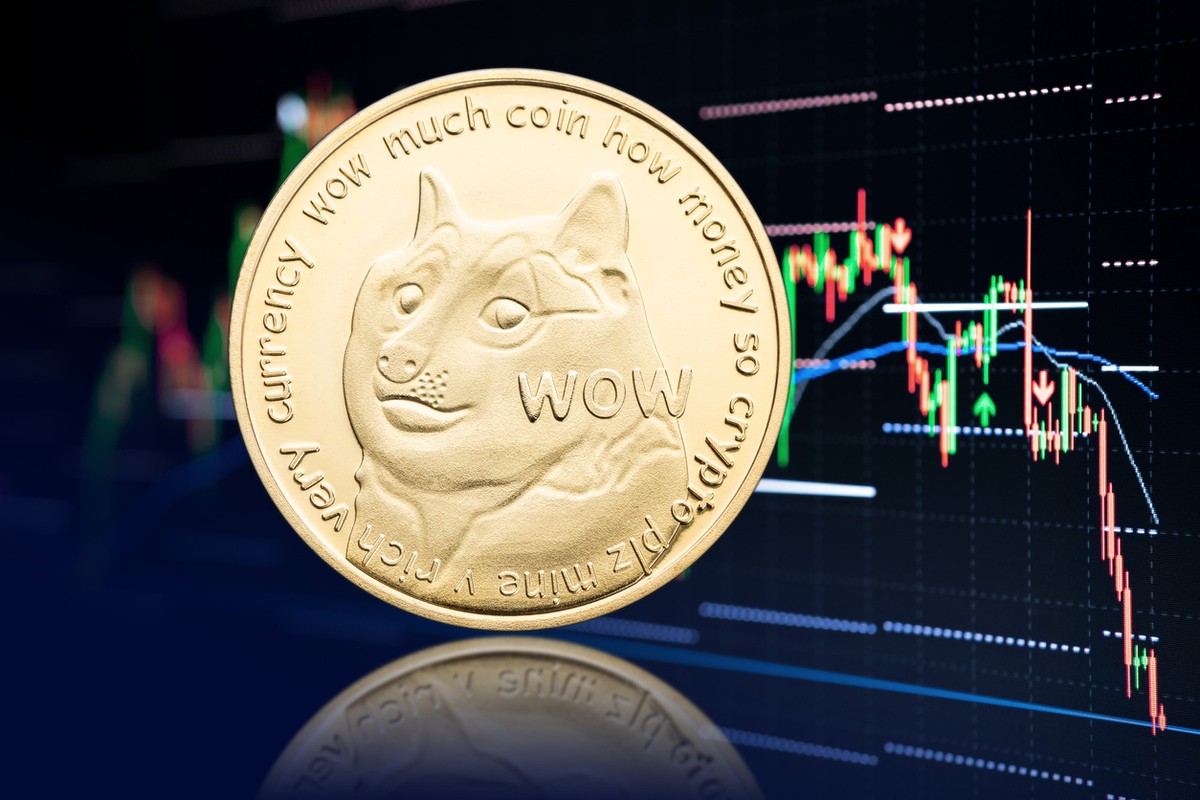
Dogecoin's Upturn Amidst Market Slump
시장 침체 속에서 도지코인의 상승세
Despite the prevailing bearish market, the popular meme-based cryptocurrency Dogecoin (DOGE) is attempting to stage a recovery. This unexpected surge comes against a backdrop of negative sentiment and broader market conditions.
지배적인 약세 시장에도 불구하고 인기 있는 밈 기반 암호화폐인 DOGE(Dogecoin)가 회복을 시도하고 있습니다. 이러한 예상치 못한 급등은 부정적인 정서와 광범위한 시장 상황을 배경으로 발생합니다.
Factors Driving Recovery
회복을 촉진하는 요인
Several factors may contribute to DOGE's recovery attempt, including positive reactions to news events, shifts in investor sentiment, and oversold conditions indicated by technical indicators. However, the question remains whether DOGE can sustain this rebound and reverse the bearish trend or if it's merely a temporary uptick.
뉴스 이벤트에 대한 긍정적인 반응, 투자 심리 변화, 기술 지표로 표시되는 과매도 상태 등 여러 요인이 DOGE의 회복 시도에 기여할 수 있습니다. 그러나 DOGE가 이러한 반등을 유지하고 약세 추세를 반전시킬 수 있는지 아니면 단지 일시적인 상승에 불과한지에 대한 의문은 남아 있습니다.
Current Market Position
현재 시장 위치
As of now, DOGE boasts a market capitalization exceeding $20 billion, a trading volume of over $715 million, and a price increase of 1.33%, currently trading at around $0.14297. However, its market capitalization and trading volume have declined by 0.73% and 43.92%, respectively.
현재 DOGE는 200억 달러가 넘는 시가총액, 7억 1,500만 달러가 넘는 거래량, 1.33%의 가격 인상을 자랑하며 현재 약 0.14297달러에 거래되고 있습니다. 하지만 시가총액과 거래량은 각각 0.73%, 43.92% 감소했다.
Technical Analysis
기술적 분석
While DOGE currently trades below its 100-day Simple Moving Average (SMA), an analysis of the 4-hour chart reveals an uptrend characterized by bullish candlesticks.
DOGE는 현재 100일 단순 이동 평균(SMA) 아래에서 거래되고 있지만, 4시간 차트 분석에 따르면 강세 캔들스틱이 특징인 상승 추세가 나타납니다.
The Composite Trend Oscillator indicator's signal line crossing above the SMA and moving towards the zero line further suggests the possibility of price growth.
Composite Trend Oscillator 지표의 신호선이 SMA를 교차하고 0선을 향해 이동하는 것은 가격 상승 가능성을 더욱 시사합니다.
However, the 1-day chart shows DOGE's price forming a bullish candlestick while trading below the 1-day SMA. This indicates potential upside followed by a eventual decline.
그러나 1일 차트는 DOGE의 가격이 1일 SMA 아래에서 거래되는 동안 강세 캔들을 형성하는 것을 보여줍니다. 이는 상승 가능성이 있다가 결국 하락할 가능성이 있음을 나타냅니다.
The Composite Trend Oscillator indicator's signal line and SMA on the 1-day chart have crossed and are attempting to move below the zero line, reinforcing the likelihood of a price drop.
Composite Trend Oscillator 지표의 신호선과 1일 차트의 SMA가 교차하여 0선 아래로 이동하려고 시도하고 있어 가격 하락 가능성이 강화되고 있습니다.
Bullish or Bearish Outlook?
낙관적 전망인가, 하락세 전망인가?
If the uptrend persists, DOGE is likely to test the resistance level of $0.14911. If it manages to break above $0.14911, it could challenge the resistance at $0.16490, potentially signaling a bullish reversal.
상승 추세가 지속되면 DOGE는 $0.14911의 저항 수준을 테스트할 가능성이 높습니다. $0.14911를 돌파할 경우 $0.16490의 저항에 도전할 수 있으며 잠재적으로 강세 반전을 신호할 수 있습니다.
Alternatively, if DOGE fails to break $0.14911, it may retreat towards the support level of $0.13580. A breach below $0.13580 could lead to further declines to $0.12014 and other lower levels.
또는 DOGE가 $0.14911을 돌파하지 못하면 $0.13580의 지원 수준으로 후퇴할 수 있습니다. $0.13580 미만의 위반은 $0.12014 및 기타 더 낮은 수준으로 추가 하락으로 이어질 수 있습니다.


 DogeHome
 TheCoinrise Media
 Thecoinrepublic.com
 TheCoinrise Media
 TheCoinrise Media
 Cryptopolitan_News
 Coin Edition
 BlockchainReporter


