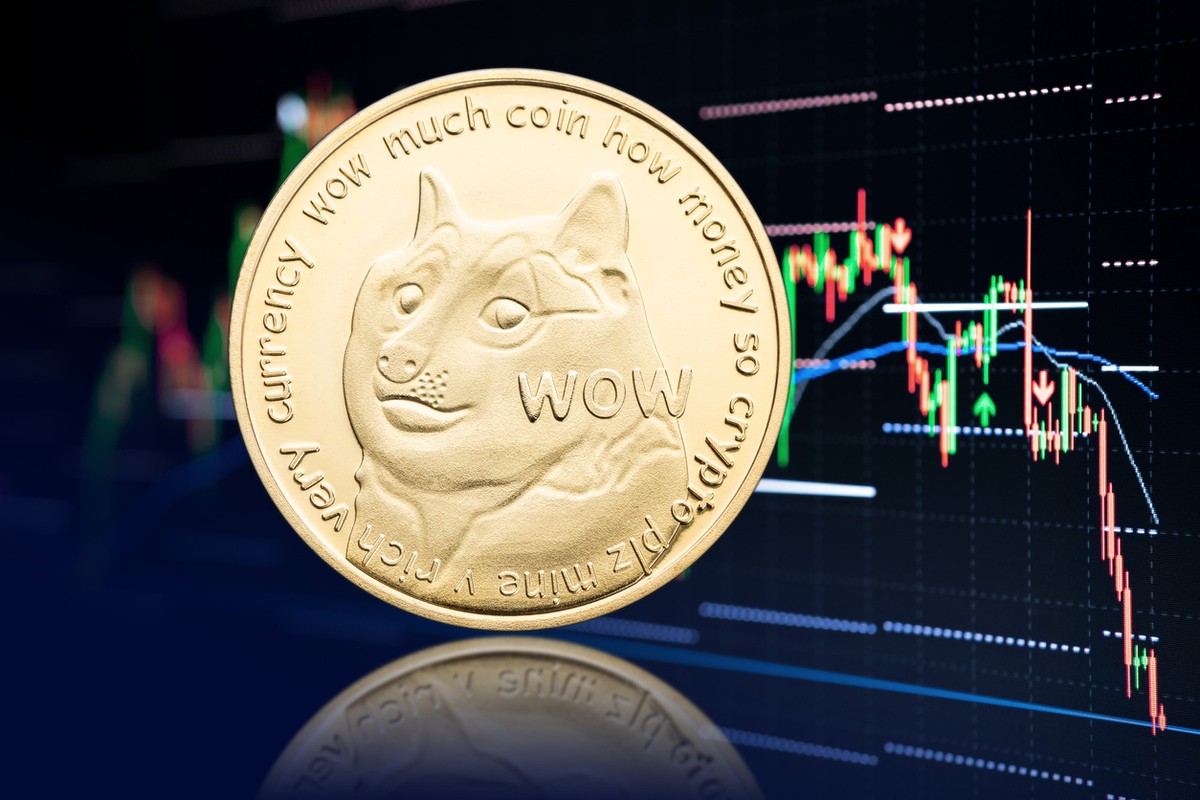
Dogecoin's Upturn Amidst Market Slump
狗狗幣在市場低迷中復甦
Despite the prevailing bearish market, the popular meme-based cryptocurrency Dogecoin (DOGE) is attempting to stage a recovery. This unexpected surge comes against a backdrop of negative sentiment and broader market conditions.
儘管市場普遍看跌,但流行的基於迷因的加密貨幣狗狗幣(DOGE)正在嘗試復甦。這種意外的飆升是在負面情緒和更廣泛的市場狀況的背景下發生的。
Factors Driving Recovery
推動復甦的因素
Several factors may contribute to DOGE's recovery attempt, including positive reactions to news events, shifts in investor sentiment, and oversold conditions indicated by technical indicators. However, the question remains whether DOGE can sustain this rebound and reverse the bearish trend or if it's merely a temporary uptick.
有幾個因素可能有助於 DOGE 的復甦嘗試,包括對新聞事件的積極反應、投資者情緒的變化以及技術指標所顯示的超賣情況。然而,問題仍然是 DOGE 能否維持這種反彈並扭轉看跌趨勢,或者這只是暫時的上漲。
Current Market Position
目前的市場地位
As of now, DOGE boasts a market capitalization exceeding $20 billion, a trading volume of over $715 million, and a price increase of 1.33%, currently trading at around $0.14297. However, its market capitalization and trading volume have declined by 0.73% and 43.92%, respectively.
截至目前,DOGE市值超過200億美元,交易量超過7.15億美元,價格漲幅為1.33%,目前交易價格約0.14297美元。但其市值和成交量分別下降了0.73%和43.92%。
Technical Analysis
技術分析
While DOGE currently trades below its 100-day Simple Moving Average (SMA), an analysis of the 4-hour chart reveals an uptrend characterized by bullish candlesticks.
雖然 DOGE 目前的交易價格低於其 100 日簡單移動平均線 (SMA),但對 4 小時圖表的分析顯示出以看漲燭台為特徵的上升趨勢。
The Composite Trend Oscillator indicator's signal line crossing above the SMA and moving towards the zero line further suggests the possibility of price growth.
綜合趨勢振盪器指標的訊號線穿越 SMA 上方並向零線移動,進一步顯示價格上漲的可能性。
However, the 1-day chart shows DOGE's price forming a bullish candlestick while trading below the 1-day SMA. This indicates potential upside followed by a eventual decline.
然而,1 日圖表顯示 DOGE 的價格形成看漲燭台,同時交投於 1 日移動平均線下方。這表明潛在的上漲之後最終會下跌。
The Composite Trend Oscillator indicator's signal line and SMA on the 1-day chart have crossed and are attempting to move below the zero line, reinforcing the likelihood of a price drop.
綜合趨勢震盪指標的訊號線和 1 日圖表上的 SMA 已經交叉,並試圖跌破零線,從而增強了價格下跌的可能性。
Bullish or Bearish Outlook?
前景看漲還是看跌?
If the uptrend persists, DOGE is likely to test the resistance level of $0.14911. If it manages to break above $0.14911, it could challenge the resistance at $0.16490, potentially signaling a bullish reversal.
如果上升趨勢持續下去,DOGE 可能會測試 0.14911 美元的阻力位。如果其成功突破 0.14911 美元,則可能挑戰 0.16490 美元的阻力位,可能預示著看漲逆轉。
Alternatively, if DOGE fails to break $0.14911, it may retreat towards the support level of $0.13580. A breach below $0.13580 could lead to further declines to $0.12014 and other lower levels.
或者,如果DOGE未能突破0.14911美元,它可能會回落至0.13580美元的支撐位。跌破 0.13580 美元可能會導致進一步跌至 0.12014 美元和其他更低水平。


 DogeHome
 TheCoinrise Media
 Thecoinrepublic.com
 TheCoinrise Media
 TheCoinrise Media
 Cryptopolitan_News
 Coin Edition
 BlockchainReporter


