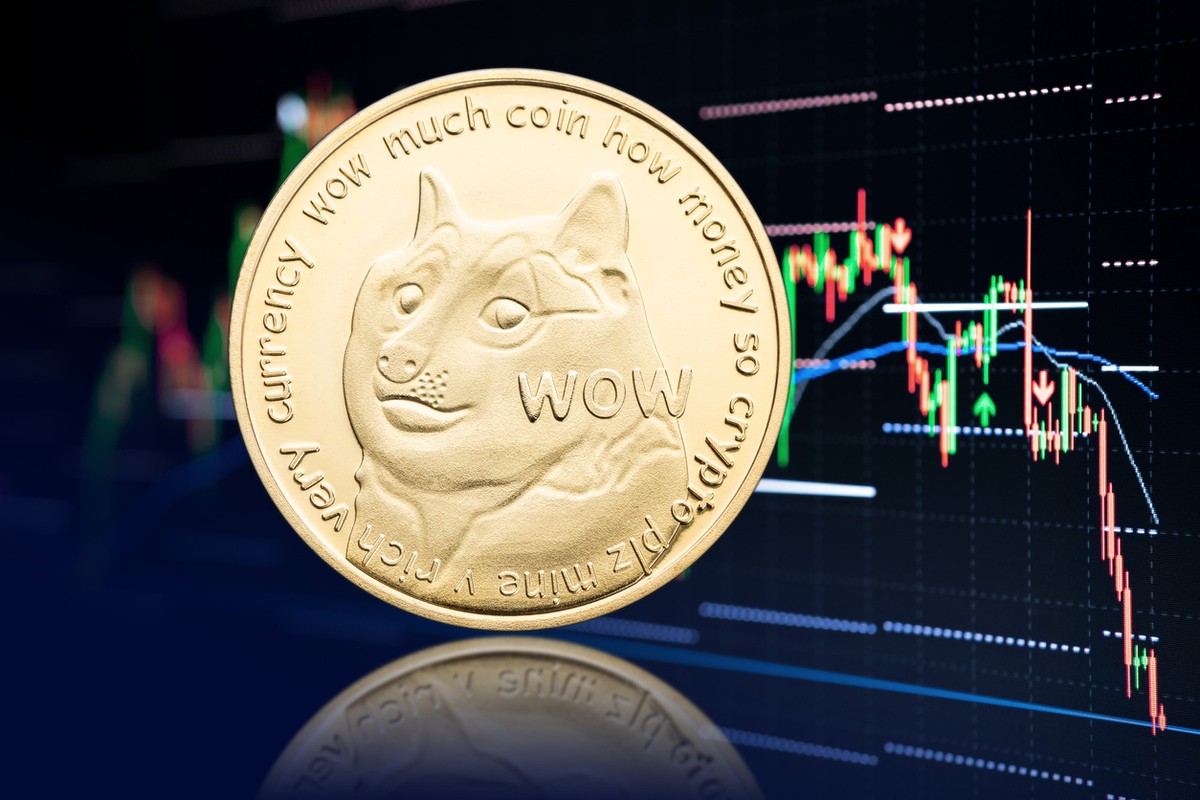
Dogecoin's Upturn Amidst Market Slump
市場低迷の中でドージコインが好転
Despite the prevailing bearish market, the popular meme-based cryptocurrency Dogecoin (DOGE) is attempting to stage a recovery. This unexpected surge comes against a backdrop of negative sentiment and broader market conditions.
弱気市場が蔓延しているにもかかわらず、人気のミームベースの暗号通貨ドージコイン(DOGE)は回復を図ろうとしている。この予想外の急騰は、ネガティブなセンチメントと広範な市場状況を背景にしている。
Factors Driving Recovery
回復を促進する要因
Several factors may contribute to DOGE's recovery attempt, including positive reactions to news events, shifts in investor sentiment, and oversold conditions indicated by technical indicators. However, the question remains whether DOGE can sustain this rebound and reverse the bearish trend or if it's merely a temporary uptick.
ニュースイベントに対する前向きな反応、投資家心理の変化、テクニカル指標が示す売られ過ぎの状況など、いくつかの要因がDOGEの回復の試みに寄与している可能性がある。しかし、DOGEがこの反発を維持して弱気傾向を反転させることができるのか、それとも一時的な上昇に過ぎないのかという疑問は残っている。
Current Market Position
現在の市場ポジション
As of now, DOGE boasts a market capitalization exceeding $20 billion, a trading volume of over $715 million, and a price increase of 1.33%, currently trading at around $0.14297. However, its market capitalization and trading volume have declined by 0.73% and 43.92%, respectively.
現在、DOGEは200億ドルを超える時価総額、7億1,500万ドルを超える取引高を誇り、価格は1.33%上昇し、現在約0.14,297ドルで取引されています。しかし、時価総額と取引高はそれぞれ0.73%、43.92%減少した。
Technical Analysis
テクニカル分析
While DOGE currently trades below its 100-day Simple Moving Average (SMA), an analysis of the 4-hour chart reveals an uptrend characterized by bullish candlesticks.
DOGEは現在、100日単純移動平均(SMA)を下回って取引されているが、4時間足チャートを分析すると、強気のローソク足を特徴とする上昇トレンドが明らかになった。
The Composite Trend Oscillator indicator's signal line crossing above the SMA and moving towards the zero line further suggests the possibility of price growth.
複合トレンドオシレーターインジケーターのシグナルラインがSMAを上回ってゼロラインに向かって移動していることは、価格上昇の可能性をさらに示唆しています。
However, the 1-day chart shows DOGE's price forming a bullish candlestick while trading below the 1-day SMA. This indicates potential upside followed by a eventual decline.
ただし、1日チャートでは、DOGEの価格が1日SMAを下回って取引されているにもかかわらず、強気のローソク足を形成していることが示されています。これは、潜在的な上昇傾向とその後の最終的な下落を示しています。
The Composite Trend Oscillator indicator's signal line and SMA on the 1-day chart have crossed and are attempting to move below the zero line, reinforcing the likelihood of a price drop.
複合トレンドオシレーターインジケーターのシグナルラインと1日チャートのSMAが交差し、ゼロラインを下回ろうとしているため、価格下落の可能性が高まっています。
Bullish or Bearish Outlook?
強気の見通しか弱気の見通しか?
If the uptrend persists, DOGE is likely to test the resistance level of $0.14911. If it manages to break above $0.14911, it could challenge the resistance at $0.16490, potentially signaling a bullish reversal.
上昇トレンドが続く場合、DOGEは0.14911ドルの抵抗レベルを試す可能性があります。なんとか0.14911ドルを突破できれば、0.16490ドルの抵抗線に挑戦し、強気反転のシグナルとなる可能性がある。
Alternatively, if DOGE fails to break $0.14911, it may retreat towards the support level of $0.13580. A breach below $0.13580 could lead to further declines to $0.12014 and other lower levels.
あるいは、DOGEが0.14911ドルを突破できなかった場合、サポートレベルの0.13580ドルに向けて後退する可能性があります。 0.13580ドルを下回ると、0.12014ドルやその他の低水準までさらに下落する可能性がある。


 DogeHome
 Cryptopolitan_News
 Coin Edition
 BlockchainReporter
 crypto.news
 Crypto Daily™
 BlockchainReporter
 Optimisus


