

Cover image via U.Today
U.today를 통해 이미지를 덮으십시오
A bearish pattern has recently appeared on the Dogecoin (DOGE) price chart against Bitcoin (BTC). A 23-day moving average has crossed below the 200-day moving average, forming a "death cross" – a bearish technical indicator.
BTC (Bitcoin)에 대한 Dogecoin (Doge) 가격 차트에는 최근에 약세 패턴이 나타났습니다. 23 일 이동 평균은 200 일 이동 평균보다 낮아서 "죽음의 십자가"인 약세 기술 지표를 형성했습니다.
It's important to note this death cross occurs on a two-day timeframe for DOGE/BTC, a less commonly used chart setting. However, with the increasing use of algorithms and AI in cryptocurrency trading, even subtle shifts in timeframe analysis can offer valuable insights. 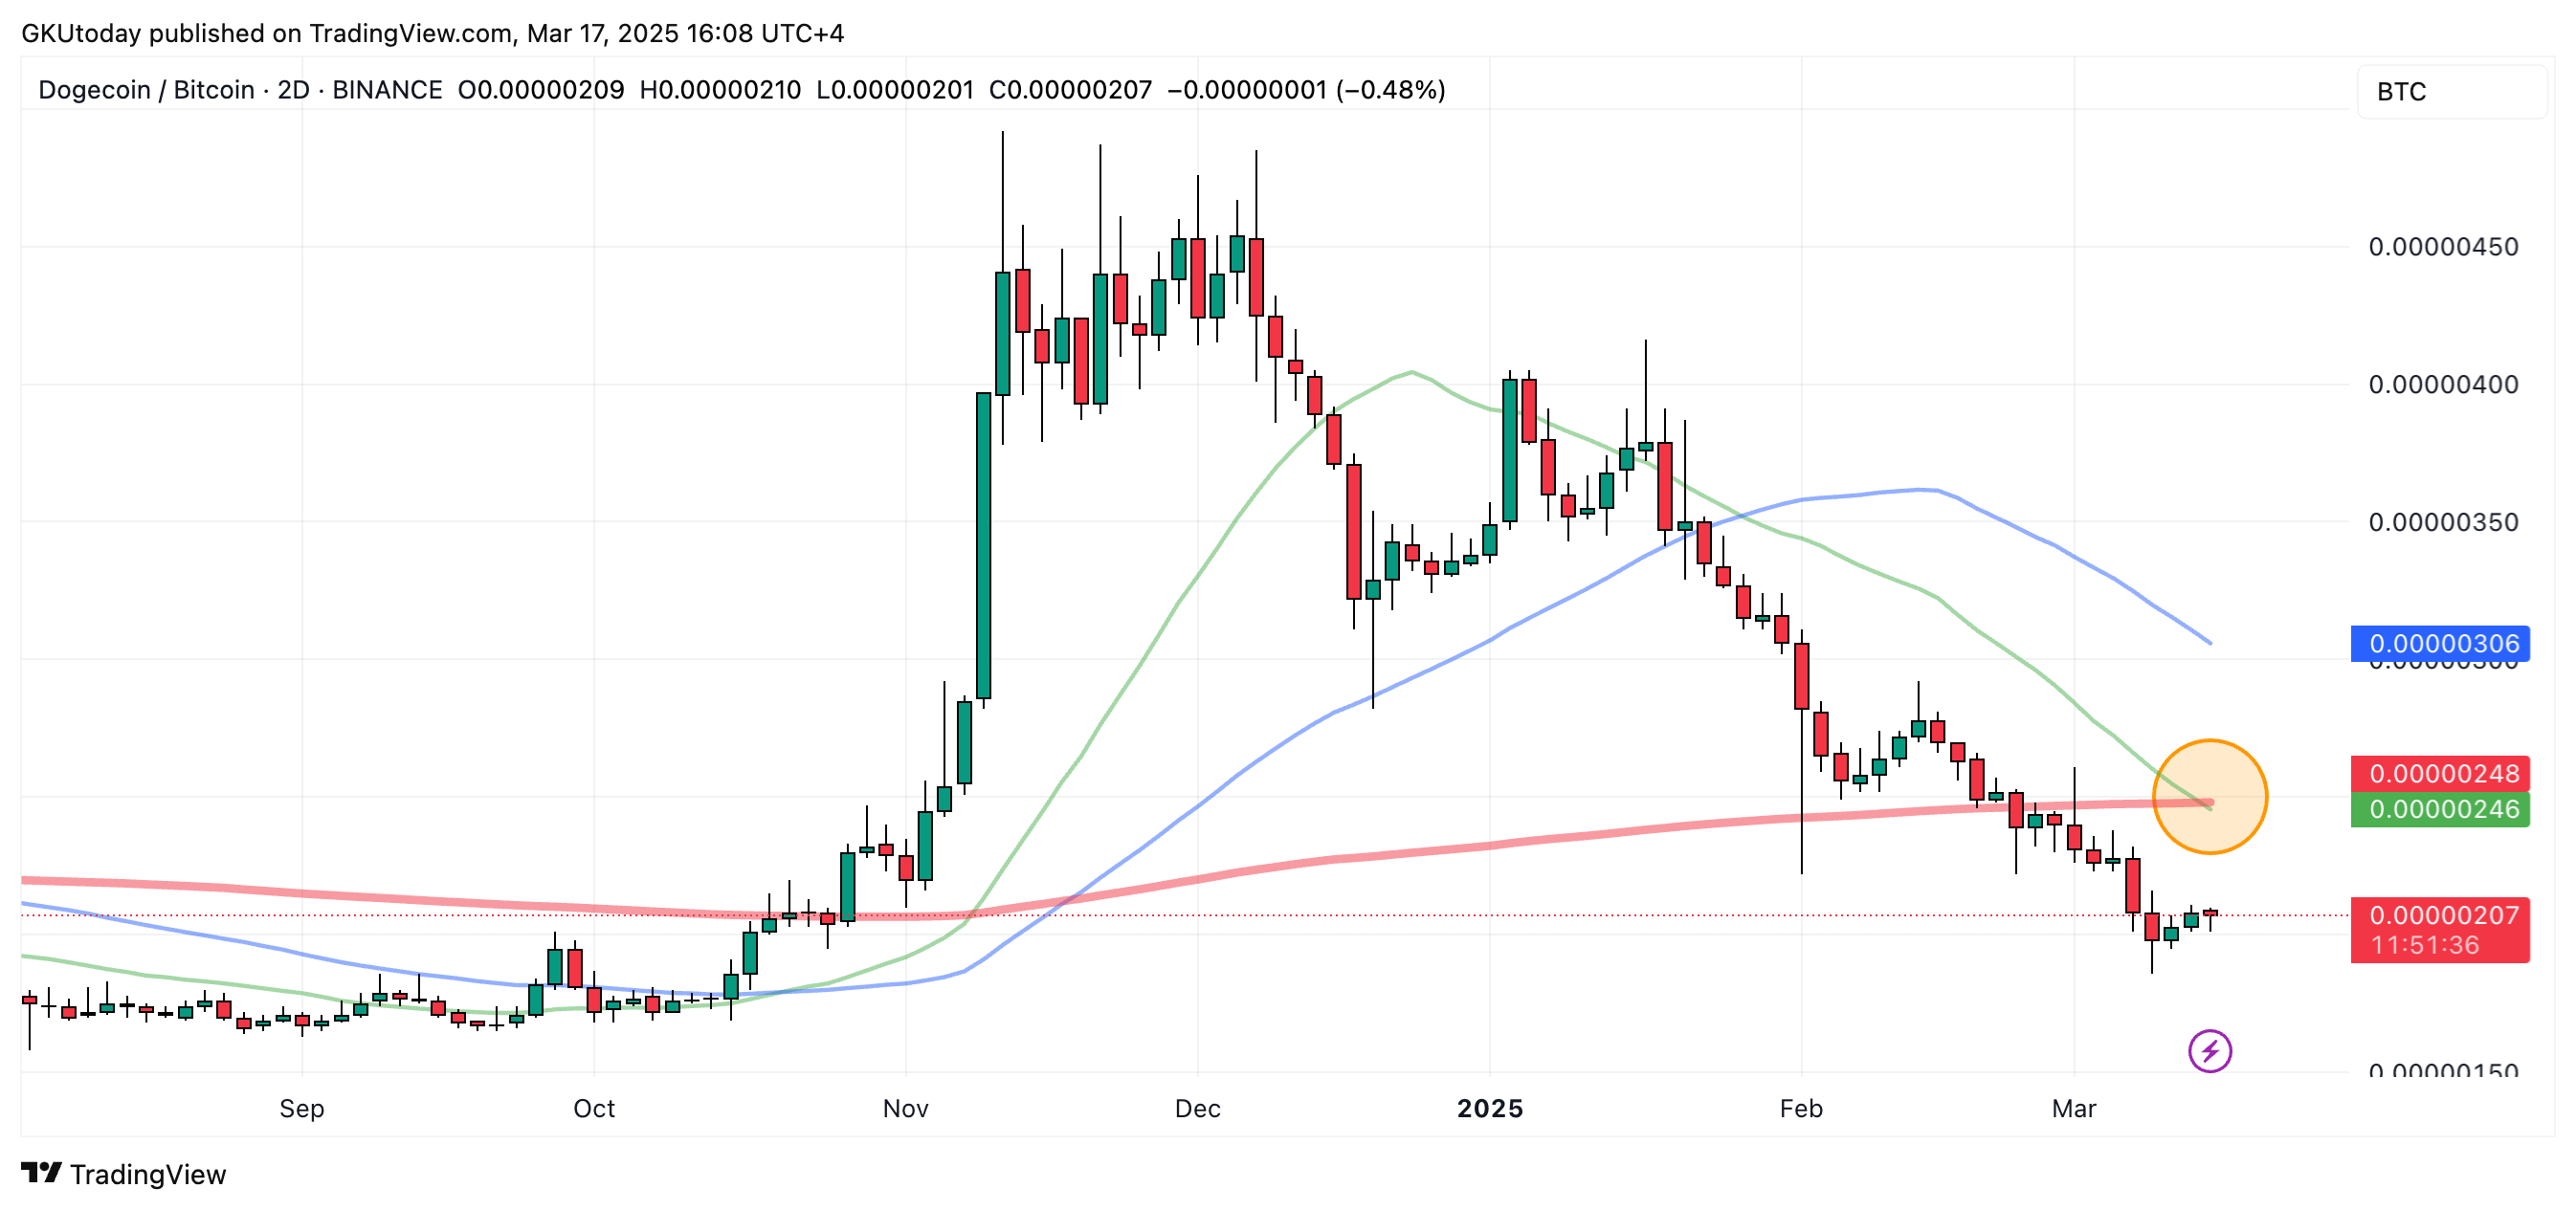 이 죽음의 십자가는 덜 일반적으로 사용되는 차트 설정 인 Doge/BTC의 2 일간의 시간에 발생한다는 점에 주목하는 것이 중요합니다. 그러나 암호 화폐 거래에서 알고리즘과 AI의 사용이 증가함에 따라 기간 분석의 미묘한 변화조차도 귀중한 통찰력을 제공 할 수 있습니다.
This death cross suggests a potential correction for DOGE relative to BTC. Dogecoin has already seen a decline following the brief price surge around the U.S. elections. This new technical development could indicate continued underperformance against Bitcoin.
이 죽음의 십자가는 BTC에 대한 DOGE에 대한 잠재적 교정을 시사한다. Dogecoin은 이미 미국 선거에 대한 짧은 가격 급등으로 인해 하락을 보았습니다. 이 새로운 기술 개발은 비트 코인에 대한 지속적인 성과를 나타낼 수 있습니다.
If the overall market trends upward, DOGE may struggle to keep pace. A downward market correction could lead to even sharper declines relative to BTC.
전체 시장 동향이 상승하면 Doge는 속도를 유지하기 위해 고군분투 할 수 있습니다. 하향 시장 교정은 BTC에 비해 더 선명한 감소를 초래할 수 있습니다.
While technical indicators like the death cross aren't always definitive, especially on less conventional timeframes, they offer a valuable perspective for traders. This warrants cautious consideration. Read original article on U.Today
Death Cross와 같은 기술 지표가 항상 덜 전통적인 기간 동안 항상 결정적인 것은 아니지만 거래자에게 귀중한 관점을 제공합니다. 이것은 신중한 고려를 보증합니다. U.Today에서 원본 기사를 읽으십시오
 Optimisus
 CFN
CFN DogeHome
 U_Today
 Cryptopolitan
 Cointelegraph
 Crypto Daily™


