

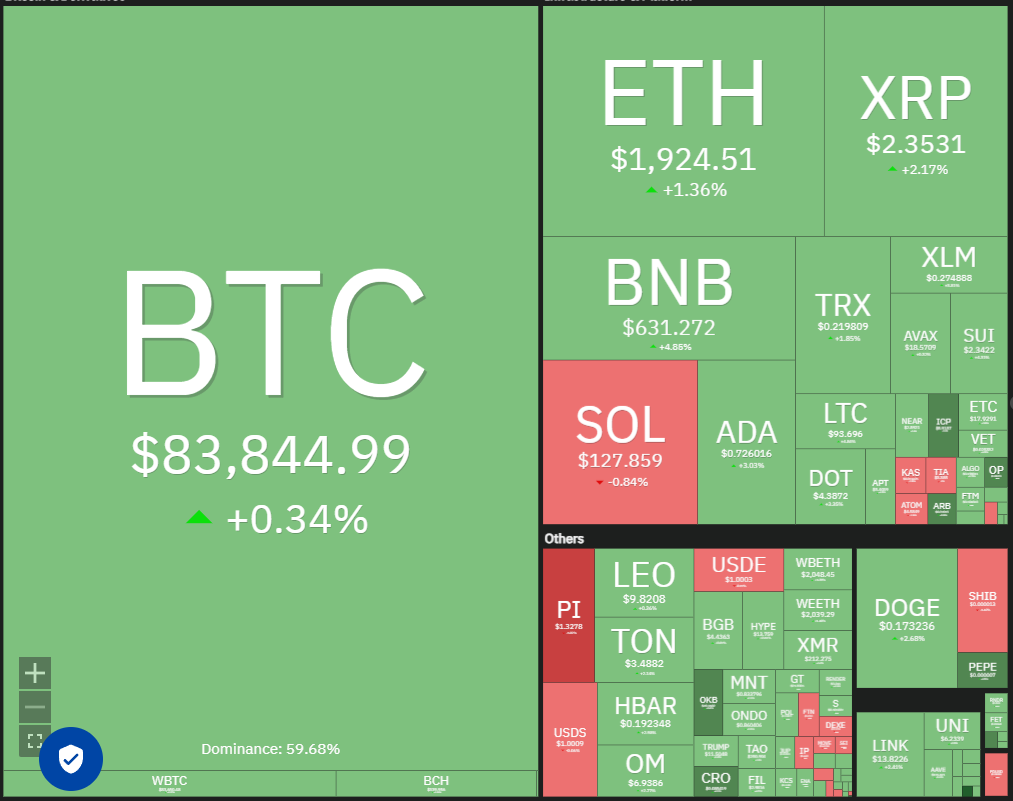
Bitcoin (BTC) has largely remained above $80,000 since March 11th, suggesting strong buyer support and a reluctance to accept deeper corrections. However, the inability to break above $86,000 indicates persistent bearish pressure and continued profit-taking on rallies.
Bitcoin (BTC)은 3 월 11 일 이후로 80,000 달러 이상을 유지했으며, 강력한 구매자 지원과 더 깊은 수정을 꺼려하는 것을 제안합니다. 그러나 86,000 달러 이상을 깰 수 없다는 것은 지속적인 약세의 압력과 집회에 대한 이익을 계속 유지한다는 것을 나타냅니다.
CoinShares' weekly report reveals significant cryptocurrency exchange-traded product (ETP) outflows totaling $1.7 billion last week. This brings the five-week outflow total to $6.4 billion, extending the negative streak to 17 days – the longest such period since CoinShares began recording data in 2015.
Coinshares의 주간 보고서에 따르면 지난 주 총 17 억 달러의 상당한 cryptocurrency exchange-traded product (ETP) 유출이 밝혀졌습니다. 이로 인해 5 주간의 유출은 총 64 억 달러로 17 일로 마이너스 스트라이크를 17 일로 연장했습니다. Coinshares가 2015 년에 데이터를 녹화하기 시작한 이후 가장 긴 기간입니다.
It's not entirely bleak for long-term investors. CryptoQuant contributor ShayanBTC notes an accumulation pattern among investors who acquired Bitcoin three to six months ago. Historically, such behavior has been "crucial in forming market bottoms and sparking new uptrends."
장기 투자자에게는 전적으로 황량한 것은 아닙니다. Cryptoquant 기고자 ShayanBTC는 3-6 개월 전에 비트 코인을 인수 한 투자자들 사이에서 축적 패턴을 지적했습니다. 역사적으로, 그러한 행동은 "시장 바닥을 형성하고 새로운 상승을 일으키는 데 중요했습니다."
Will buyers successfully propel Bitcoin above resistance levels? What's the outlook for altcoins? Let's analyze the charts.
구매자는 저항 수준보다 비트 코인을 성공적으로 추진합니까? Altcoins의 전망은 무엇입니까? 차트를 분석합시다.
S&P 500 Index Price Analysis
S & P 500 지수 가격 분석
The S&P 500 Index (SPX) is undergoing a significant correction. The March 13th drop to 5,504 pushed the Relative Strength Index (RSI) into oversold territory, hinting at a potential near-term rebound.
S & P 500 지수 (SPX)는 상당한 수정을 받고 있습니다. 3 월 13 일 5,504로 하락하면서 상대 강도 지수 (RSI)를 과산 영역으로 밀어내어 잠재적 인 단기 반등을 암시했습니다.
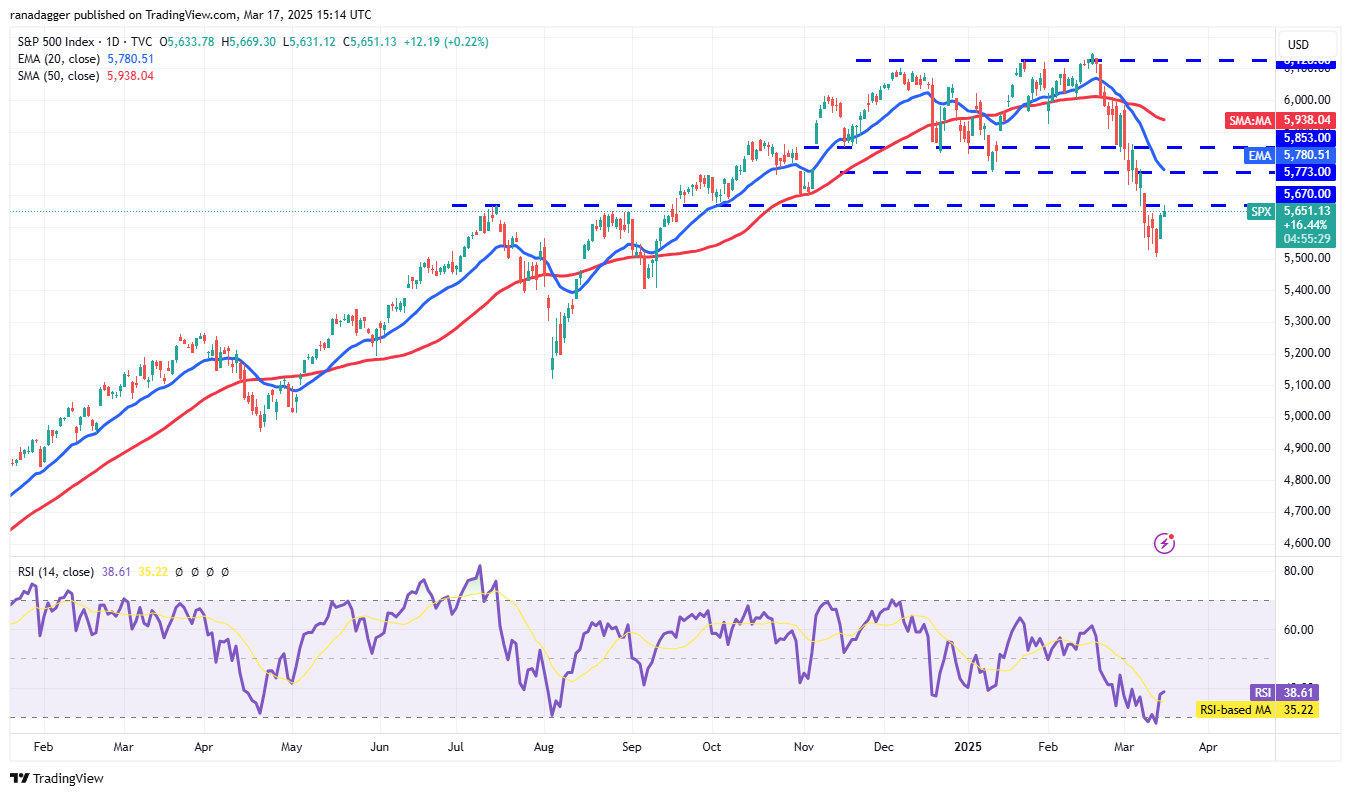
Bears may attempt to halt any recovery within the 5,670 to 5,773 resistance zone. Success here would signal continued negative sentiment and further selling on rallies, potentially leading to a drop to 5,400. The 5,400 level is expected to be strongly defended by bulls; a breach could trigger a decline to 5,100. Conversely, a decisive close above the 20-day exponential moving average (around 5,780) would indicate bullish strength, potentially leading to a rise towards the 50-day simple moving average (around 5,938).
곰은 5,670 ~ 5,773 저항 구역 내에서 회복을 중단하려고 시도 할 수 있습니다. 여기서 성공은 지속적인 부정적인 감정과 집회에 대한 추가 판매를 알리며 잠재적으로 5,400으로 떨어질 것입니다. 5,400 레벨은 황소에 의해 강력하게 방어 될 것으로 예상된다. 위반은 5,100으로 감소 할 수 있습니다. 반대로, 20 일 지수 이동 평균 (약 5,780 명) 이상의 결정적인 근간은 강세를 나타내며 잠재적으로 50 일 간단한 이동 평균 (약 5,938)으로 상승 할 수 있습니다.
US Dollar Index Price Analysis
미국 달러 지수 가격 분석
The weak rebound from the 103.37 support in the US Dollar Index (DXY) suggests sustained bearish pressure.
미국 달러 지수 (DXY)의 103.37 지원에서 약한 반등은 지속적인 약세 압력을 시사합니다.
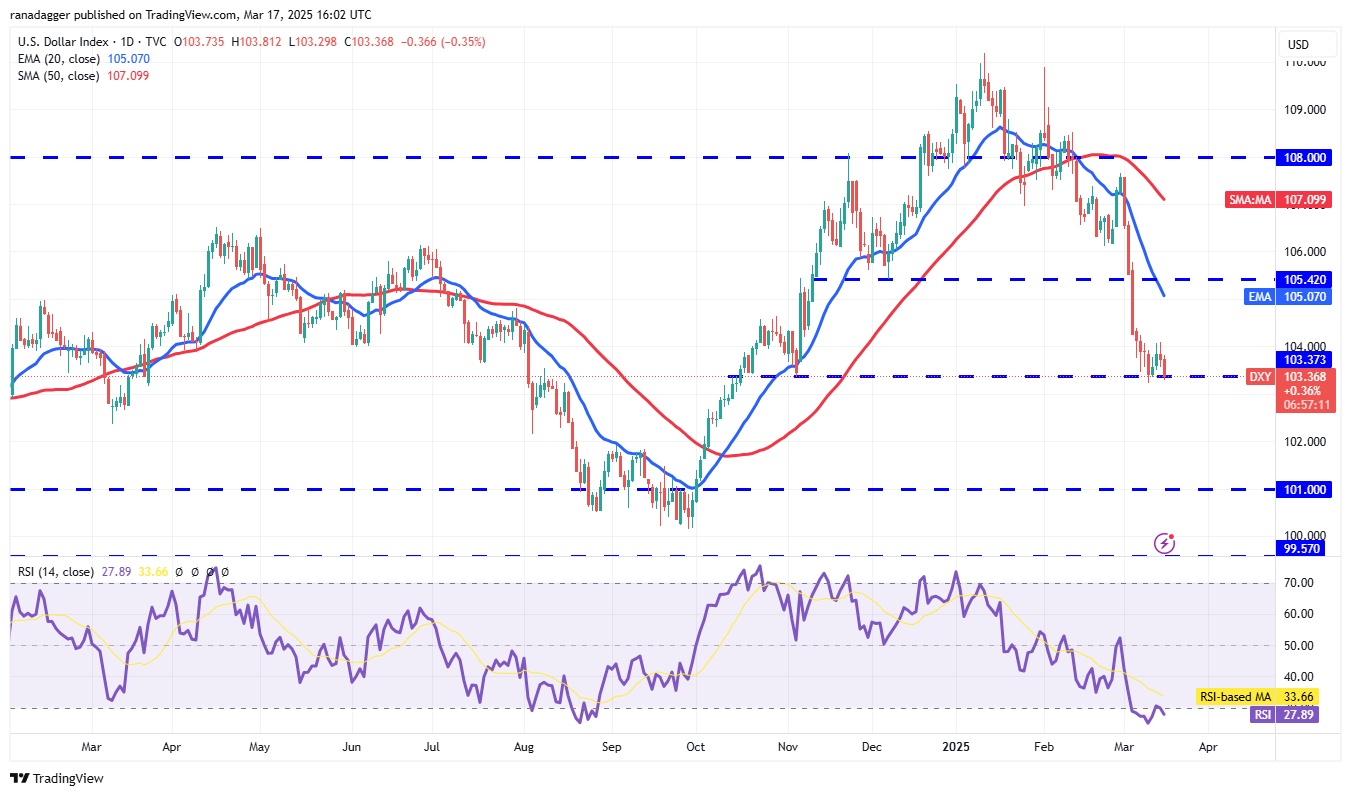
Sellers are aiming to push the index below 103.37, potentially triggering a decline to 102 and then 101. Conversely, a break above 104 would signal a potential buyer resurgence, potentially pushing the index towards the 20-day EMA (around 105), which may attract selling. Sustained buying pressure could lead to a break above the 20-day EMA and a subsequent rise to the 50-day SMA (around 107).
판매자는 103.37 미만으로 인덱스를 추진하여 102 세 및 101로 감소하는 것을 목표로하고 있습니다. 반대로, 104 이상의 휴식은 잠재적 구매자 부활을 알리면서 20 일 EMA (약 105)로 지수를 밀어 올릴 수 있습니다. 지속적인 구매 압력은 20 일 EMA보다 휴식을 취하고 50 일 SMA (약 107)로 증가 할 수 있습니다.
Bitcoin Price Analysis
비트 코인 가격 분석
Bitcoin is attempting to establish a higher low, building momentum for a potential break above the 200-day SMA ($84,112).
Bitcoin은 200 일 SMA ($ 84,112)보다 잠재적 인 휴식을 위해 높은 낮은 낮은 구축 모멘텀을 설정하려고합니다.
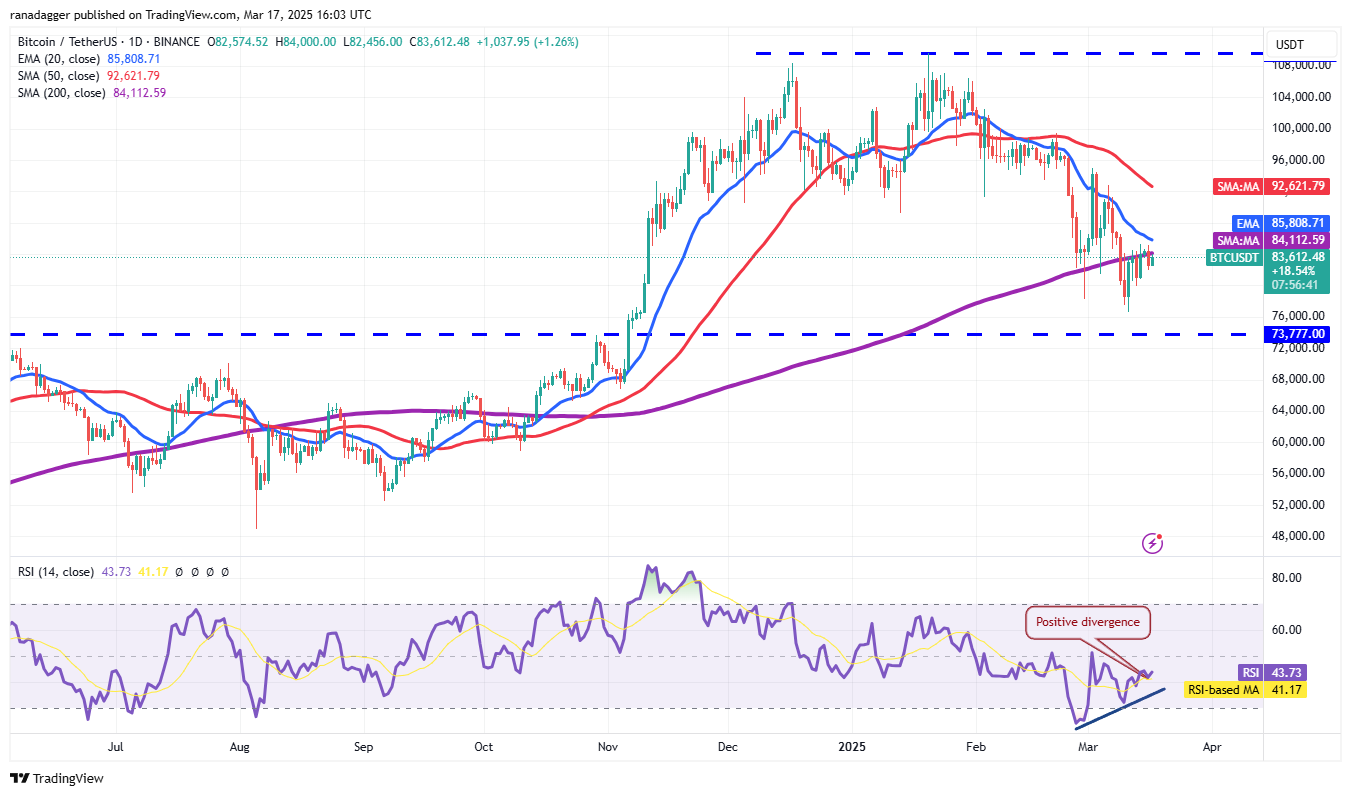
Positive divergence in the RSI suggests weakening bearish momentum. A break above the 20-day EMA ($85,808) could propel the BTC/USDT pair towards the 50-day SMA ($92,621). Conversely, a sharp downturn from the 200-day SMA would indicate a potential bearish reversal, potentially leading to a decline to $80,000 and then $76,606.
RSI의 긍정적 인 발산은 약세의 추진력을 약화시킨다. 20 일 EMA (85,808 달러)를 넘어서 BTC/USDT 쌍을 50 일 SMA ($ 92,621)로 추진할 수 있습니다. 반대로, 200 일 SMA의 급격한 침체는 잠재적 인 약세 반전을 나타내며 잠재적으로 $ 80,000, $ 76,606로 감소 할 수 있습니다.
Ether Price Analysis
에테르 가격 분석
Ether (ETH) is trading within a range of $1,963 and $1,821, indicating a lack of strong buying interest at current levels.
Ether (Eth)는 $ 1,963 및 $ 1,821 범위 내에서 거래되며 현재 수준에서의 강력한 구매이자가 부족함을 나타냅니다.

A fall below the $1,821 to $1,754 support zone would suggest a resumption of the downtrend, potentially leading to a drop to $1,550. Conversely, a break above the 20-day EMA ($2,107) would invalidate this bearish outlook, potentially pushing the ETH/USDT pair towards the 50-day SMA ($2,514) and potentially further to $2,857 if bulls overcome resistance.
$ 1,821에서 $ 1,754의 지원 구역 이하의 하락은 하락세의 재개를 제안하여 잠재적으로 $ 1,550로 떨어질 것입니다. 반대로, 20 일 EMA ($ 2,107)를 넘어서는이 약세의 전망을 무효화하여 ETH/USDT 쌍을 50 일 SMA ($ 2,514)로 밀고 불스가 저항을 극복 한 경우 2,857 달러로 잠재적으로 추진할 수 있습니다.
XRP Price Analysis
XRP 가격 분석
XRP (XRP) reversed from the 50-day SMA ($2.51) on March 15th, highlighting bearish activity at higher levels.
XRP (XRP)는 3 월 15 일 50 일 SMA ($ 2.51)에서 역전하여 더 높은 수준에서 약세 활동을 강조했습니다.
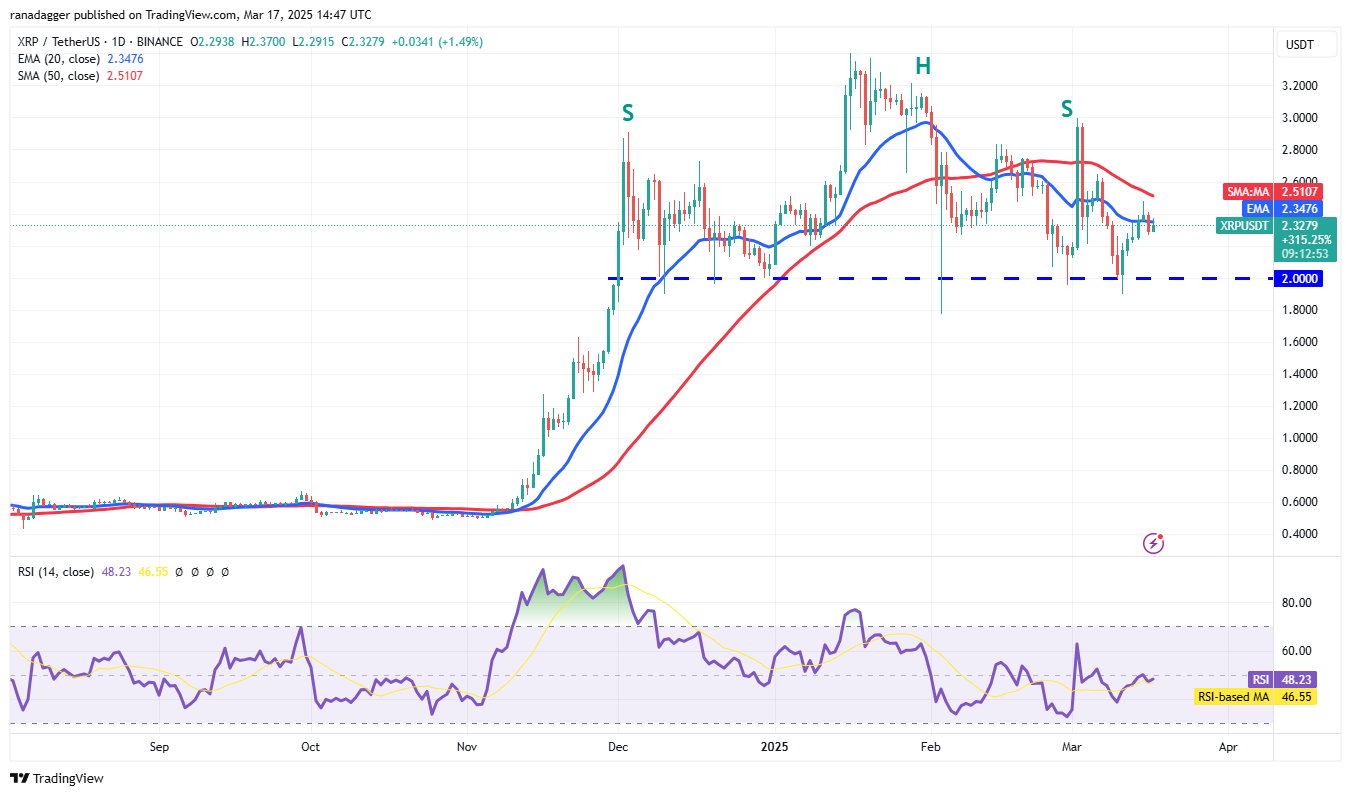
The 20-day EMA ($2.34) is relatively flat, and the RSI is near the midpoint, indicating a balance between supply and demand. The XRP/USDT pair may consolidate between the 50-day SMA and $2. A break above the 50-day SMA could lead to a rally to $3. A break below $2 would complete a head-and-shoulders pattern, potentially leading to a decline to $1.28.
20 일 EMA ($ 2.34)는 상대적으로 평평하며 RSI는 중간 점에 가까워서 수요와 수요 사이의 균형을 나타냅니다. XRP/USDT 쌍은 50 일 SMA와 $ 2 사이에 통합 될 수 있습니다. 50 일 SMA 이상의 휴식은 랠리로 이어질 수 있습니다. $ 2 미만의 휴식은 헤드와 어깨 패턴을 완성하여 잠재적으로 $ 1.28로 감소 할 것입니다.
BNB Price Analysis
BNB 가격 분석
BNB (BNB) rebounded from the 20-day EMA ($598) and surpassed the 50-day SMA ($620), suggesting a potential end to the correction.
BNB (BNB)는 20 일 EMA (598 달러)에서 반등하여 50 일 SMA ($ 620)를 능가하여 교정의 잠재적 종말을 시사했습니다.
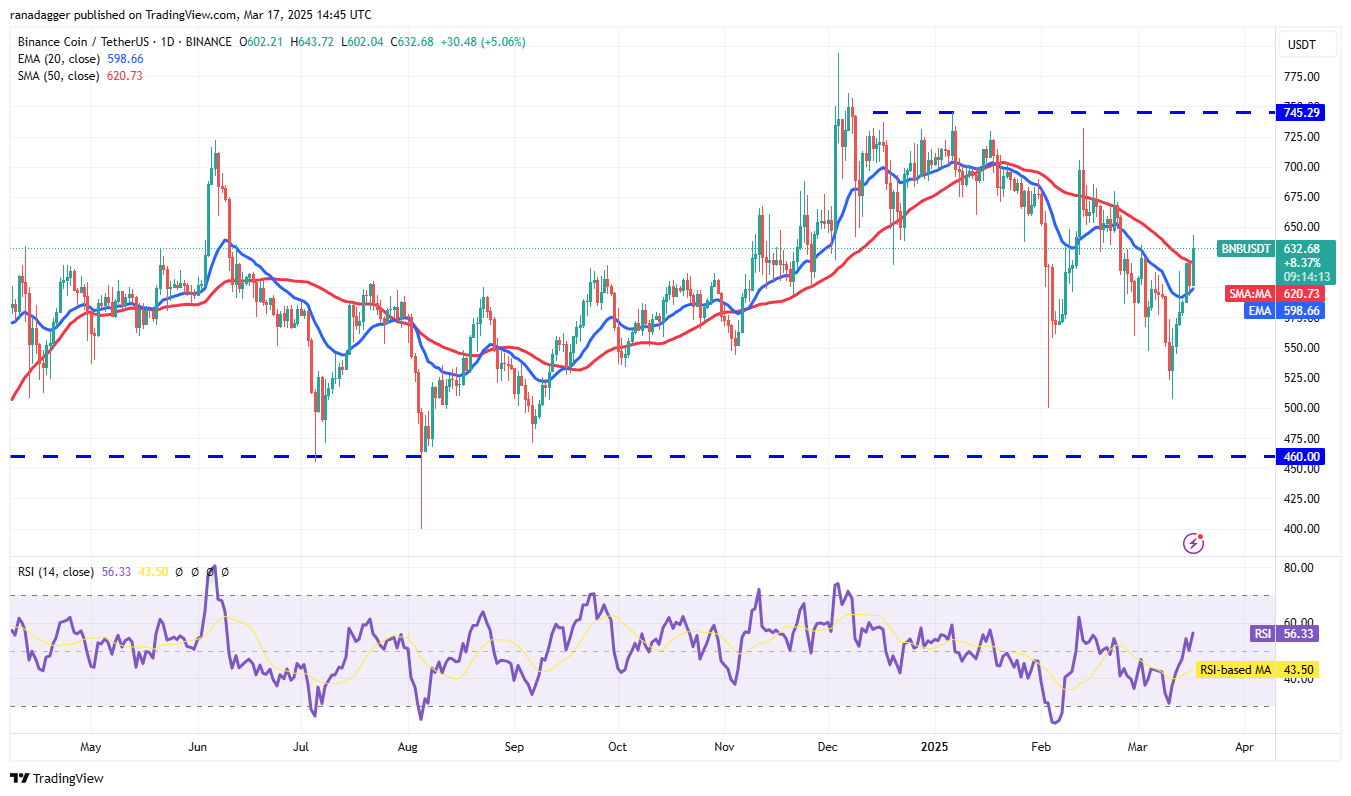
The 20-day EMA is turning upwards, and the RSI is in positive territory, favoring bulls. Sustained trading above the 50-day SMA could lead to a rally to $686 and potentially $745. A break below the 20-day EMA would signal a shift in momentum to bears, potentially leading to a decline to the strong support at $500.
20 일의 EMA가 위로 올라가고 있으며 RSI는 긍정적 인 영토에 있으며 황소를 선호합니다. 50 일 SMA 이상의 지속적인 거래는 686 달러, 잠재적으로 $ 745로 이어질 수 있습니다. 20 일 이하의 EMA 이하의 휴식은 곰으로의 운동량의 전환을 알리며 잠재적으로 500 달러의 강력한 지원이 감소 할 것입니다.
Solana Price Analysis
Solana 가격 분석
Solana (SOL) reversed from the 20-day EMA ($139) on March 16th, indicating strong bearish defense of that level.
Solana (Sol)는 3 월 16 일 20 일 EMA ($ 139)에서 역전하여 그 수준의 강력한 약세 방어를 나타냅니다.
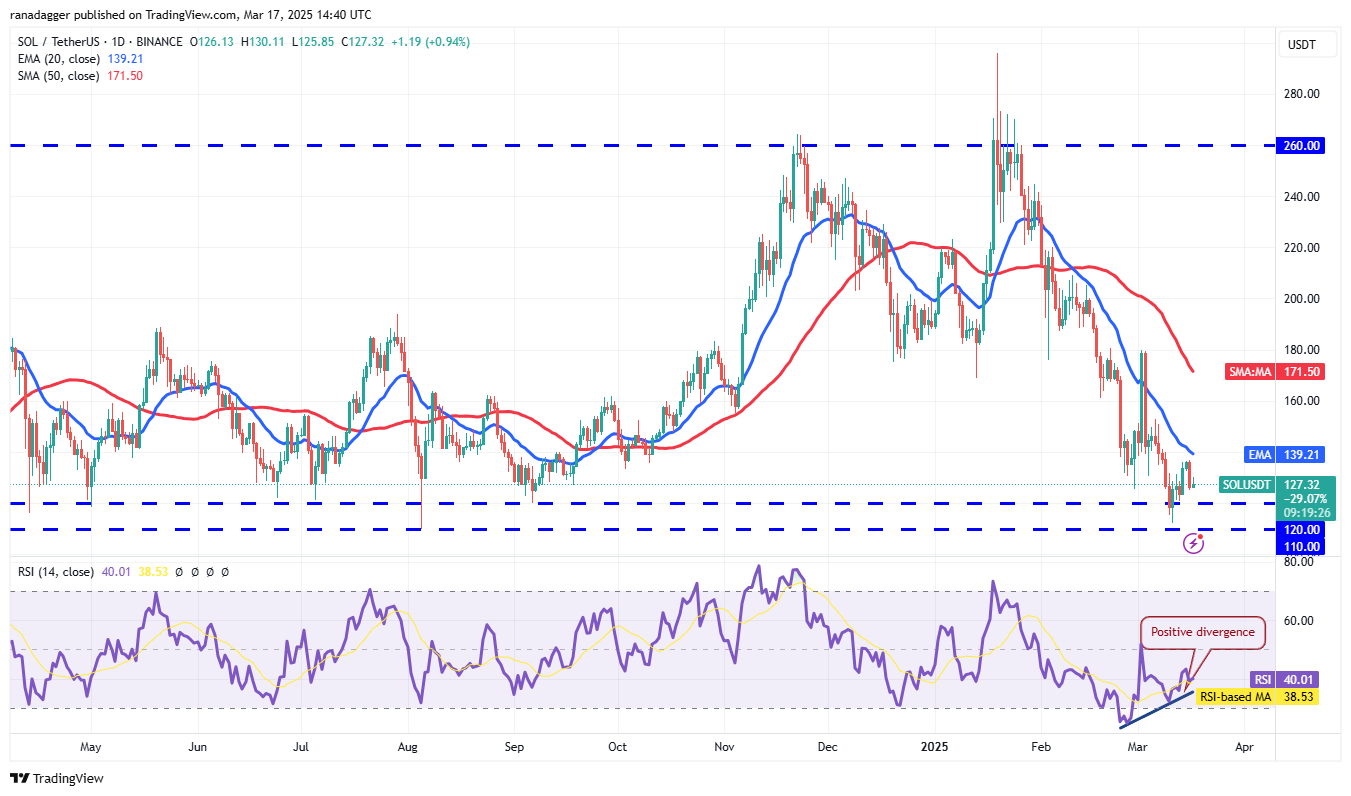
The SOL/USDT pair could decline to $120 and then $110, where buying support is anticipated. A rebound from this support zone could lead to another attempt to break above the 20-day EMA, potentially reaching $180. A continued decline below the support zone would invalidate this bullish scenario, potentially triggering a drop to $100 and then $80.
SOL/USDT 쌍은 구매 지원이 예상되는 경우 $ 120, $ 110로 감소 할 수 있습니다. 이 지원 구역의 반등은 20 일 EMA를 넘어서서 또 다른 시도로 이어질 수 있으며 잠재적으로 $ 180에 도달 할 수 있습니다. 지원 구역 아래의 지속적인 감소는이 낙관적 시나리오를 무효화하여 잠재적으로 $ 100, 80 달러로 떨어질 수 있습니다.
Dogecoin Price Analysis
Dogecoin 가격 분석
Dogecoin (DOGE) is gradually approaching the 20-day EMA ($0.19), a key near-term resistance level.
Dogecoin (Doge)은 주요 단기 저항 수준 인 20 일 EMA ($ 0.19)에 점차 다가오고 있습니다.
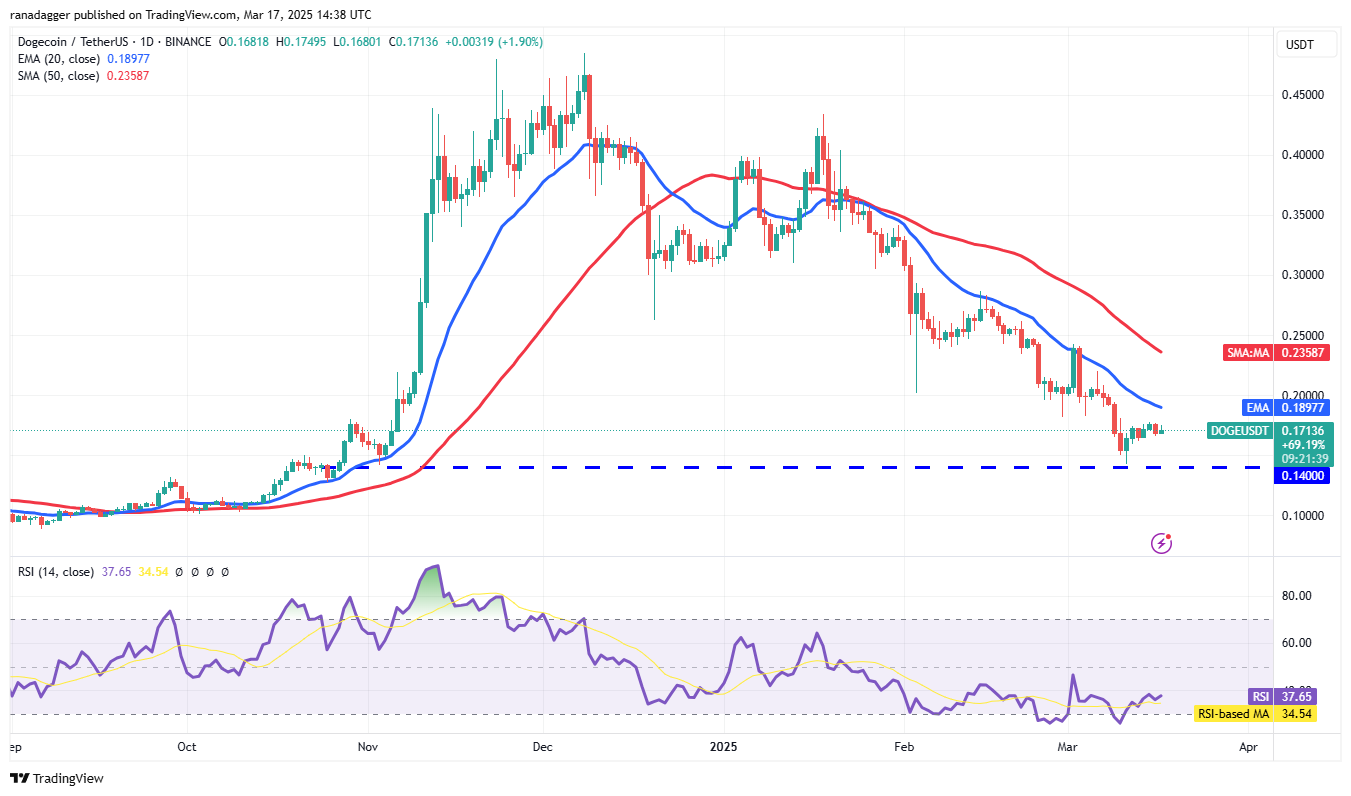
A sharp reversal from the 20-day EMA would suggest bearish selling on rallies, increasing the risk of a break below the $0.14 support and a potential decline to $0.10. Conversely, a break above the 20-day EMA would indicate reduced selling pressure, potentially leading to a rise to the 50-day SMA ($0.23) and then to $0.29. A close above $0.29 would signal strong buyer control.
20 일의 EMA의 급격한 반전은 집회에 대한 약세 판매를 제안하여 $ 0.14의 지원 이하로 휴식의 위험이 증가하고 잠재적 인 잠재적 인 감소가 $ 0.10으로 증가 할 것입니다. 반대로, 20 일 EMA 이상의 휴식은 판매 압력 감소를 나타내며 잠재적으로 50 일 SMA ($ 0.23)로 상승한 다음 $ 0.29로 증가 할 것입니다. $ 0.29 이상은 강력한 구매자 통제를 알릴 것입니다.
Cardano Price Analysis
Cardano 가격 분석
Cardano (ADA) has traded below the 20-day EMA ($0.76) since March 8th, but the bears have failed to break the uptrend line, suggesting weakening selling pressure at lower levels.
Cardano (ADA)는 3 월 8 일 이후 20 일 EMA ($ 0.76) 이하로 거래되었지만 Bears는 UPTREND 라인을 깨지 않아서 낮은 수준에서 판매 압력 약화를 시사합니다.
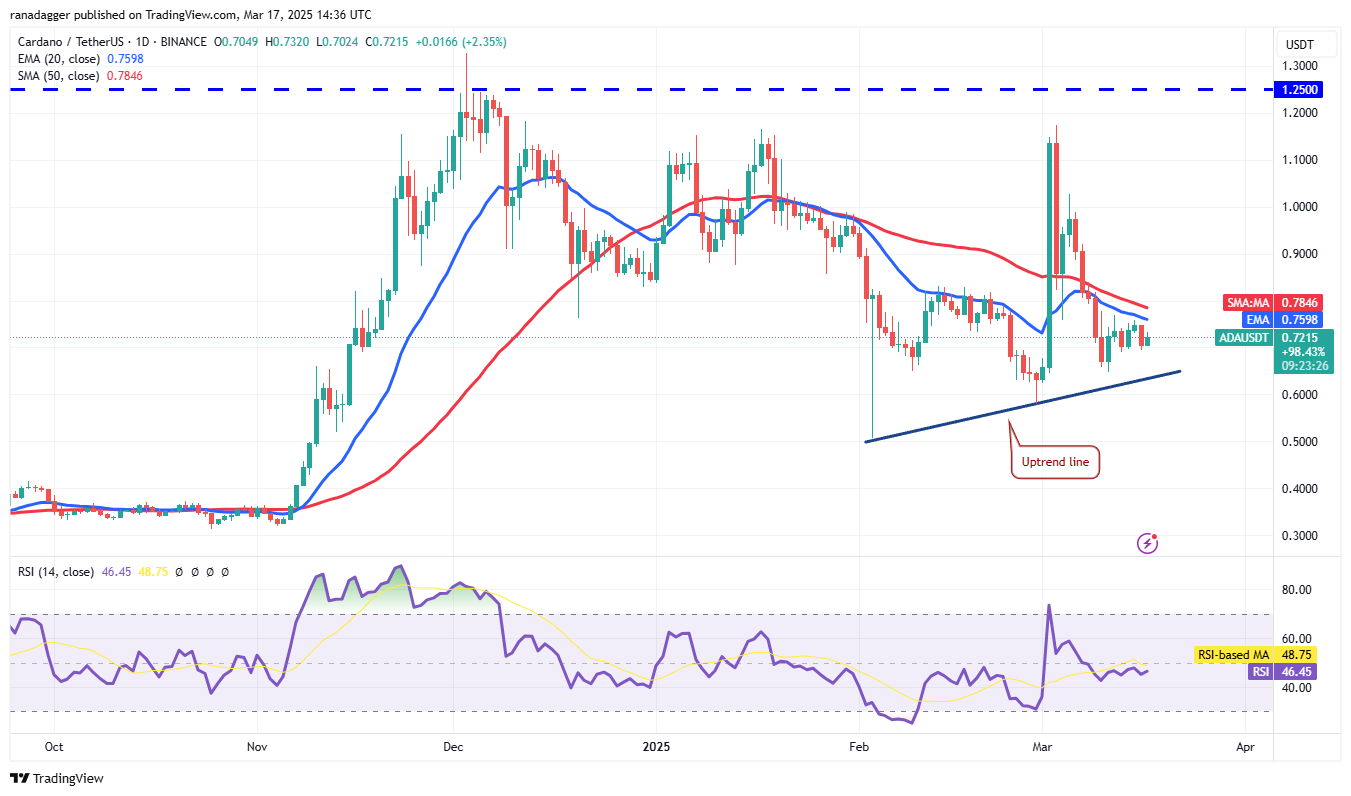
Buyers need to push the price above the moving averages for a sustained recovery, potentially reaching $1.02, where further bearish resistance is expected. A reversal from the moving averages would suggest continued bearish control, potentially leading to a drop below the uptrend line and a decline to $0.50.
구매자는 지속적인 회복을 위해 이동 평균보다 가격을 높여야하며 잠재적으로 $ 1.02에 도달하여 추가적인 약세 저항이 예상됩니다. 움직이는 평균의 반전은 지속적인 약세 제어를 시사 할 수 있으며, 잠재적으로 상승 라인 아래의 하락과 $ 0.50의 감소가 발생할 수 있습니다.
Pi Price Analysis
PI 가격 분석
Pi (PI) is gradually declining towards the $1.23 support level, where buying is anticipated.
PI (PI)는 구매가 예상되는 $ 1.23 지원 수준으로 점차 감소하고 있습니다.
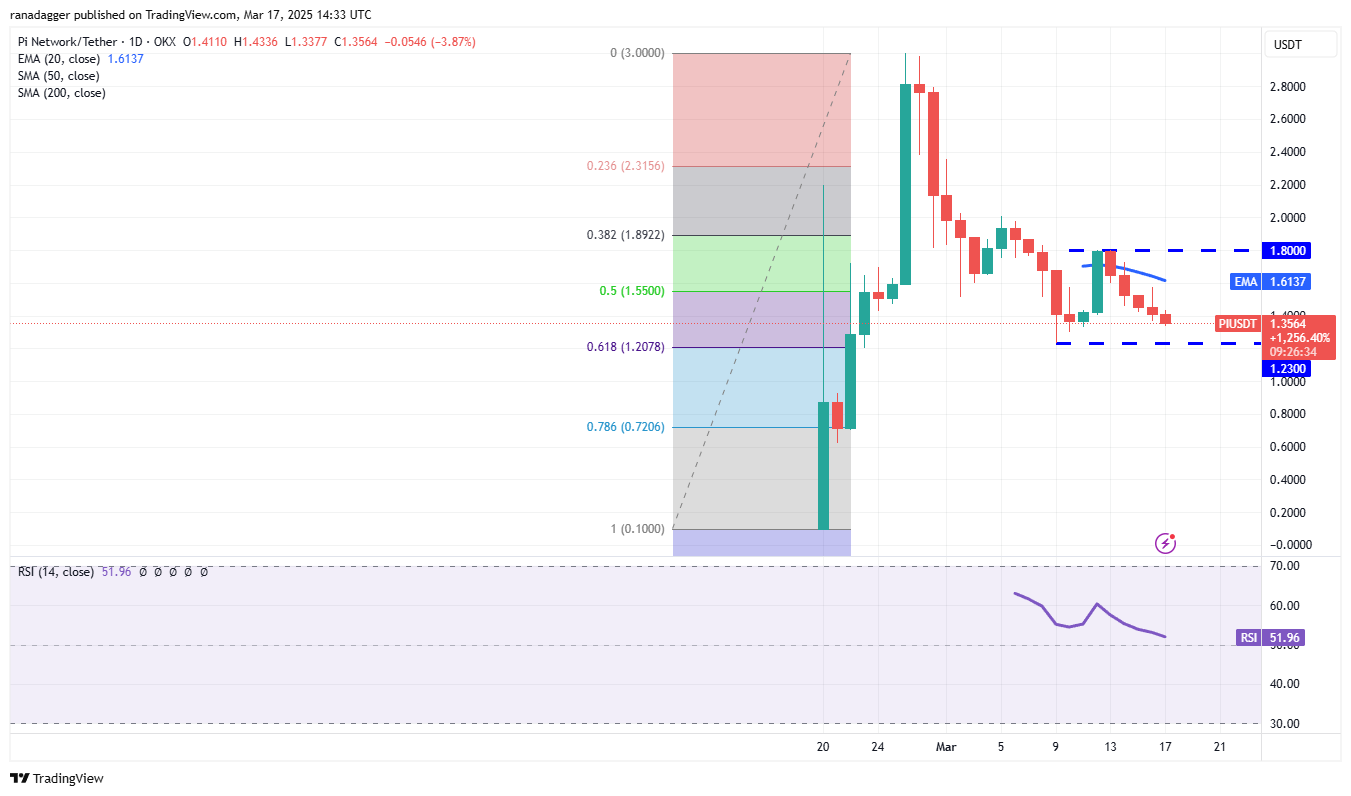
A strong rebound from $1.23 could push the PI/USDT pair back towards $1.80. While sellers are likely to challenge this level, a successful breakout could lead to a rally to $2 and then $2.35. A reversal from $1.80 would suggest range-bound trading between $1.23 and $1.80. A break below $1.23 would strengthen the bearish position, potentially leading to a decline to the 78.6% retracement level of $0.72.
$ 1.23의 강력한 반등은 PI/USDT 쌍을 $ 1.80으로 되돌릴 수 있습니다. 판매자는이 수준에 도전 할 가능성이 있지만 성공적인 탈주는 랠리로 이어질 수 있습니다. $ 1.80의 반전은 $ 1.23에서 $ 1.80 사이의 범위 거래 거래를 제안합니다. $ 1.23 미만의 휴식은 약세 위치를 강화시켜 78.6%의 역전 수준이 $ 0.72로 이어질 것입니다.
Disclaimer: This article does not provide financial advice. All investment and trading decisions involve risk, and readers should conduct their own thorough research.
면책 조항 :이 기사는 재정적 조언을 제공하지 않습니다. 모든 투자 및 거래 결정에는 위험이 포함되며 독자는 자신의 철저한 연구를 수행해야합니다.
 DogeHome
 ETHNews
 Cryptopolitan_News
 Optimisus
 BlockchainReporter
 Cryptopolitan_News
 Cryptos Newss


