

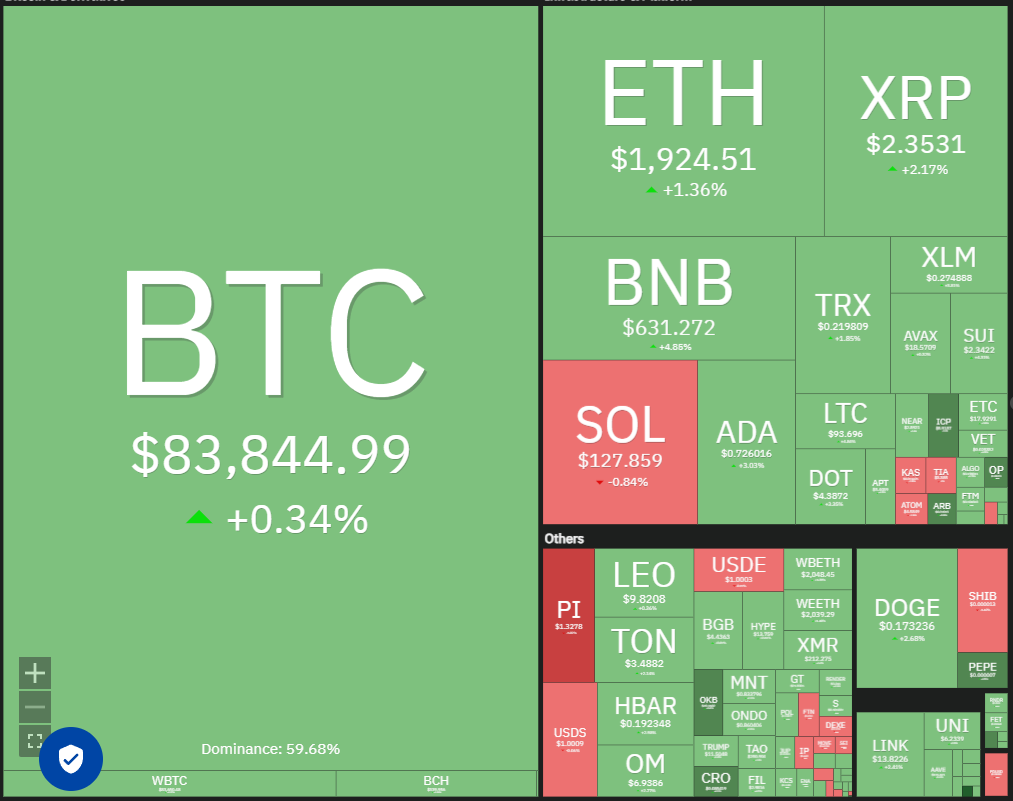
Bitcoin (BTC) has largely remained above $80,000 since March 11th, suggesting strong buyer support and a reluctance to accept deeper corrections. However, the inability to break above $86,000 indicates persistent bearish pressure and continued profit-taking on rallies.
CoinShares' weekly report reveals significant cryptocurrency exchange-traded product (ETP) outflows totaling $1.7 billion last week. This brings the five-week outflow total to $6.4 billion, extending the negative streak to 17 days – the longest such period since CoinShares began recording data in 2015.
It's not entirely bleak for long-term investors. CryptoQuant contributor ShayanBTC notes an accumulation pattern among investors who acquired Bitcoin three to six months ago. Historically, such behavior has been "crucial in forming market bottoms and sparking new uptrends."
Will buyers successfully propel Bitcoin above resistance levels? What's the outlook for altcoins? Let's analyze the charts.
S&P 500 Index Price Analysis
The S&P 500 Index (SPX) is undergoing a significant correction. The March 13th drop to 5,504 pushed the Relative Strength Index (RSI) into oversold territory, hinting at a potential near-term rebound.
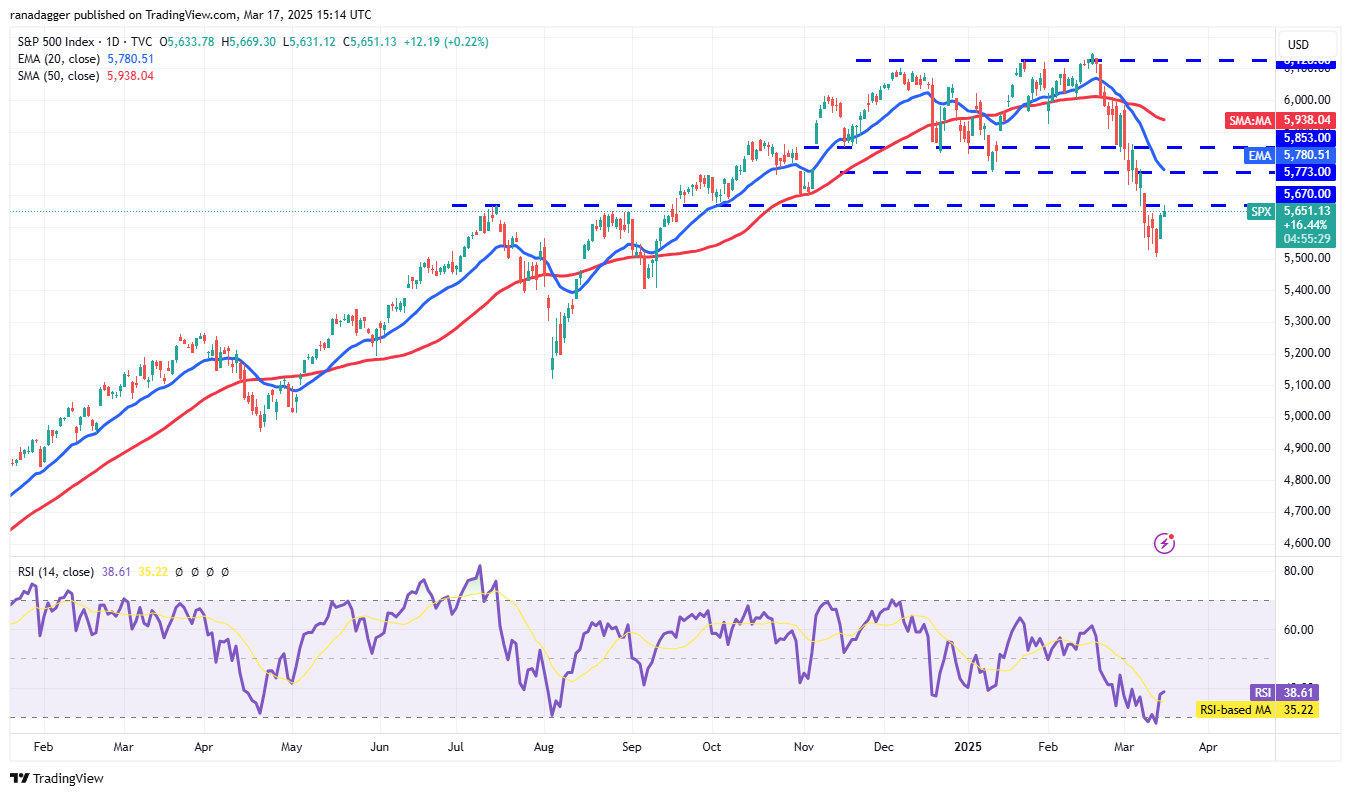
Bears may attempt to halt any recovery within the 5,670 to 5,773 resistance zone. Success here would signal continued negative sentiment and further selling on rallies, potentially leading to a drop to 5,400. The 5,400 level is expected to be strongly defended by bulls; a breach could trigger a decline to 5,100. Conversely, a decisive close above the 20-day exponential moving average (around 5,780) would indicate bullish strength, potentially leading to a rise towards the 50-day simple moving average (around 5,938).
US Dollar Index Price Analysis
The weak rebound from the 103.37 support in the US Dollar Index (DXY) suggests sustained bearish pressure.
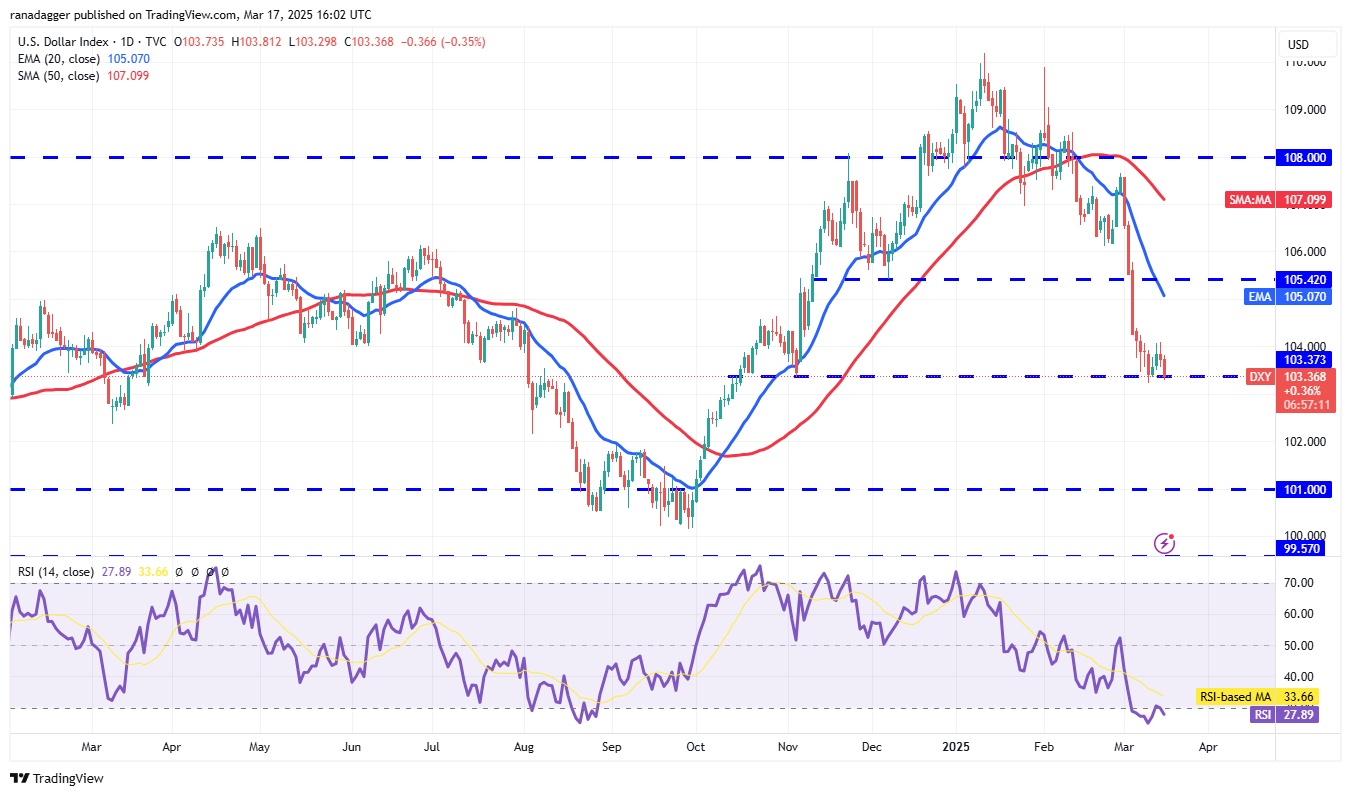
Sellers are aiming to push the index below 103.37, potentially triggering a decline to 102 and then 101. Conversely, a break above 104 would signal a potential buyer resurgence, potentially pushing the index towards the 20-day EMA (around 105), which may attract selling. Sustained buying pressure could lead to a break above the 20-day EMA and a subsequent rise to the 50-day SMA (around 107).
Bitcoin Price Analysis
Bitcoin is attempting to establish a higher low, building momentum for a potential break above the 200-day SMA ($84,112).
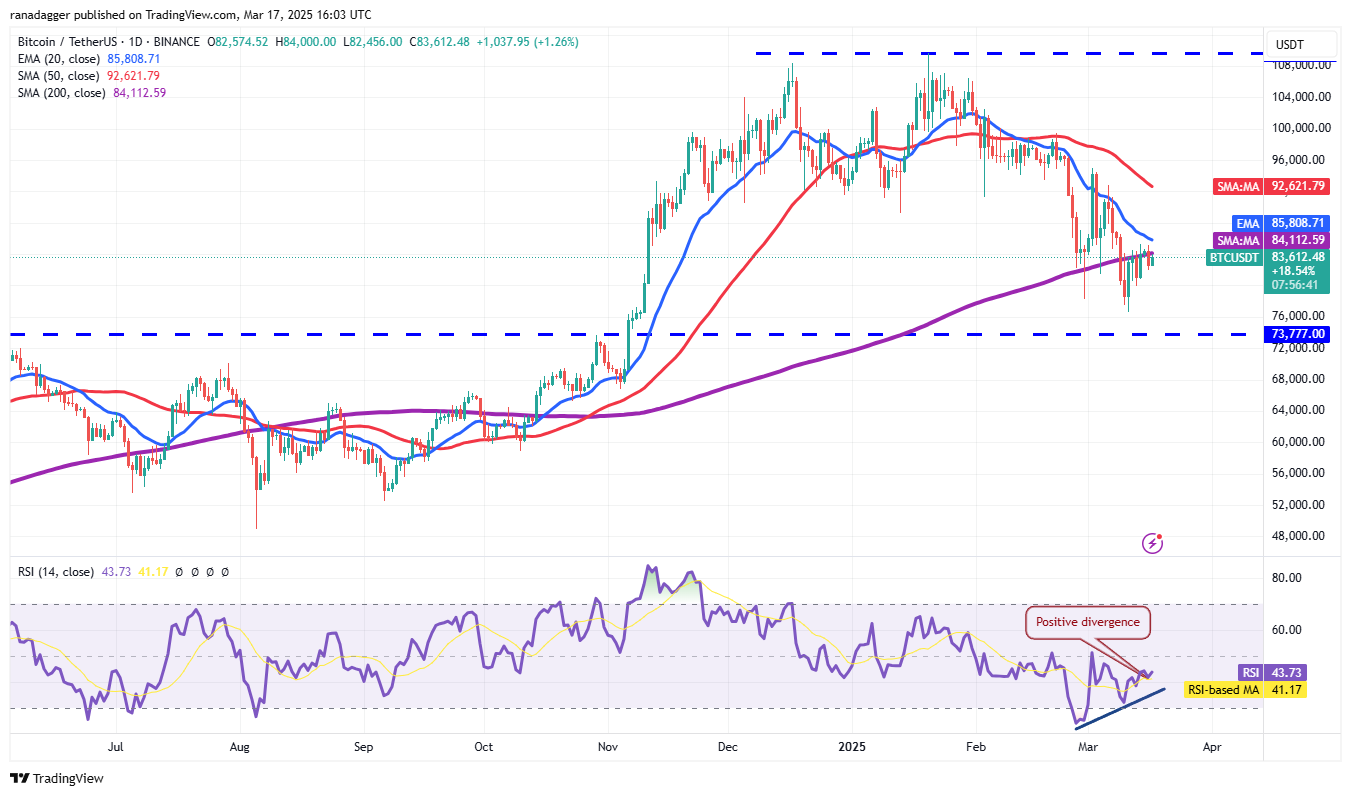
Positive divergence in the RSI suggests weakening bearish momentum. A break above the 20-day EMA ($85,808) could propel the BTC/USDT pair towards the 50-day SMA ($92,621). Conversely, a sharp downturn from the 200-day SMA would indicate a potential bearish reversal, potentially leading to a decline to $80,000 and then $76,606.
Ether Price Analysis
Ether (ETH) is trading within a range of $1,963 and $1,821, indicating a lack of strong buying interest at current levels.

A fall below the $1,821 to $1,754 support zone would suggest a resumption of the downtrend, potentially leading to a drop to $1,550. Conversely, a break above the 20-day EMA ($2,107) would invalidate this bearish outlook, potentially pushing the ETH/USDT pair towards the 50-day SMA ($2,514) and potentially further to $2,857 if bulls overcome resistance.
XRP Price Analysis
XRP (XRP) reversed from the 50-day SMA ($2.51) on March 15th, highlighting bearish activity at higher levels.
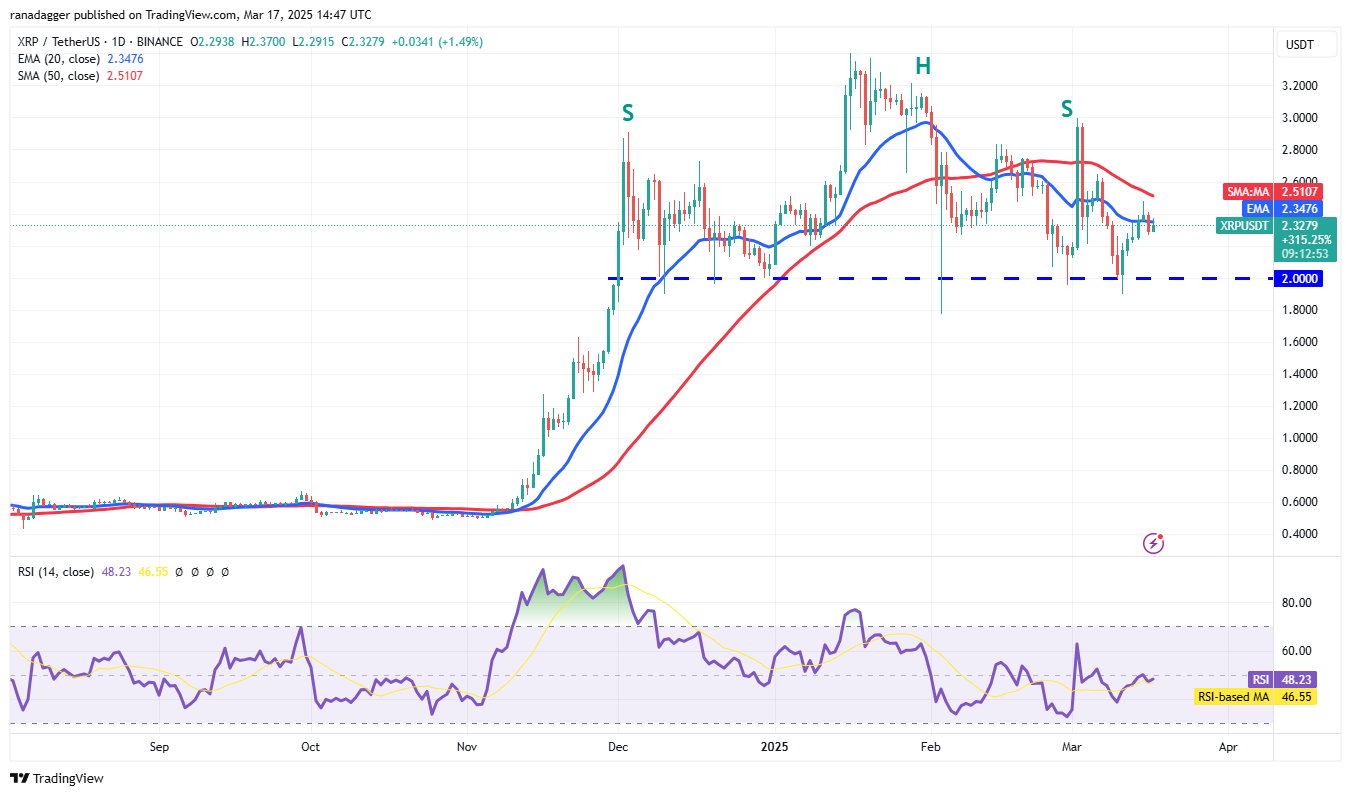
The 20-day EMA ($2.34) is relatively flat, and the RSI is near the midpoint, indicating a balance between supply and demand. The XRP/USDT pair may consolidate between the 50-day SMA and $2. A break above the 50-day SMA could lead to a rally to $3. A break below $2 would complete a head-and-shoulders pattern, potentially leading to a decline to $1.28.
BNB Price Analysis
BNB (BNB) rebounded from the 20-day EMA ($598) and surpassed the 50-day SMA ($620), suggesting a potential end to the correction.
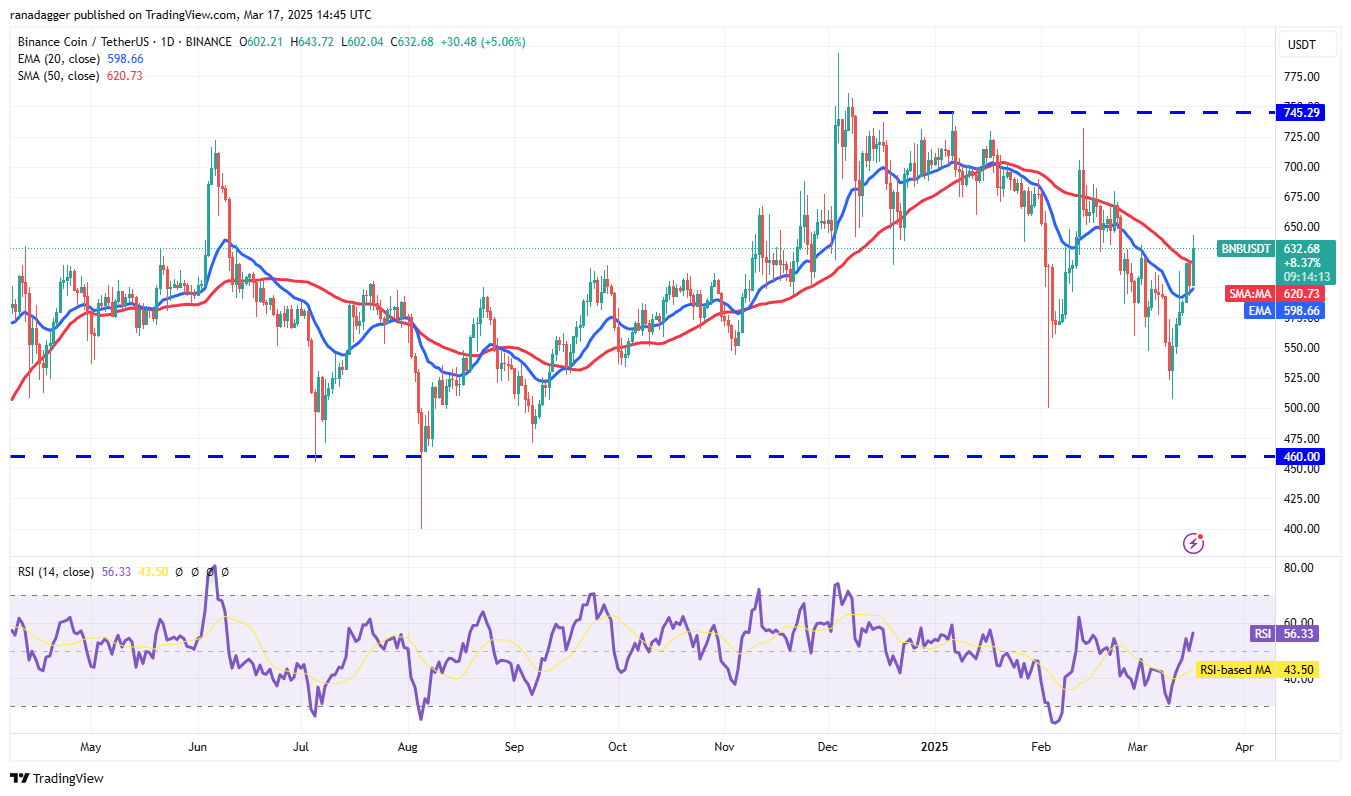
The 20-day EMA is turning upwards, and the RSI is in positive territory, favoring bulls. Sustained trading above the 50-day SMA could lead to a rally to $686 and potentially $745. A break below the 20-day EMA would signal a shift in momentum to bears, potentially leading to a decline to the strong support at $500.
Solana Price Analysis
Solana (SOL) reversed from the 20-day EMA ($139) on March 16th, indicating strong bearish defense of that level.
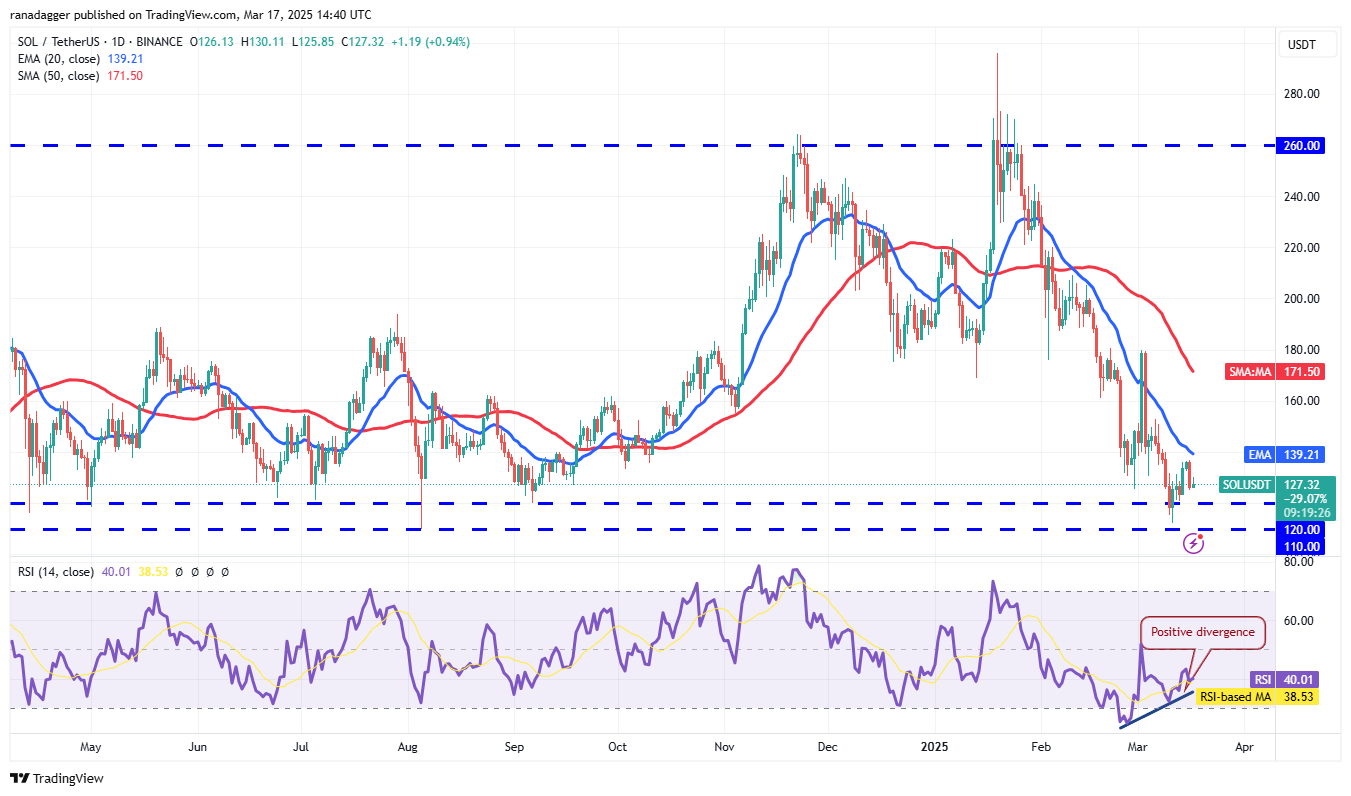
The SOL/USDT pair could decline to $120 and then $110, where buying support is anticipated. A rebound from this support zone could lead to another attempt to break above the 20-day EMA, potentially reaching $180. A continued decline below the support zone would invalidate this bullish scenario, potentially triggering a drop to $100 and then $80.
Dogecoin Price Analysis
Dogecoin (DOGE) is gradually approaching the 20-day EMA ($0.19), a key near-term resistance level.
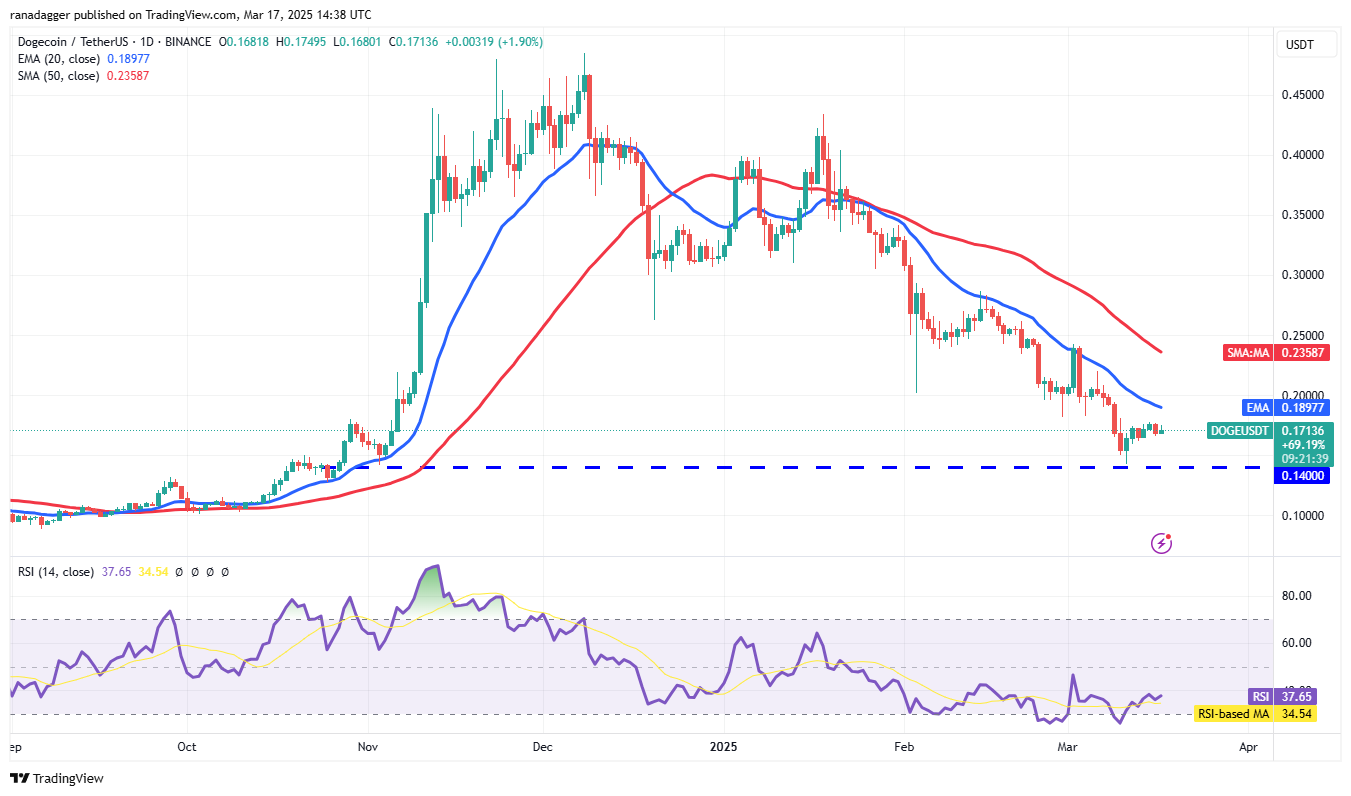
A sharp reversal from the 20-day EMA would suggest bearish selling on rallies, increasing the risk of a break below the $0.14 support and a potential decline to $0.10. Conversely, a break above the 20-day EMA would indicate reduced selling pressure, potentially leading to a rise to the 50-day SMA ($0.23) and then to $0.29. A close above $0.29 would signal strong buyer control.
Cardano Price Analysis
Cardano (ADA) has traded below the 20-day EMA ($0.76) since March 8th, but the bears have failed to break the uptrend line, suggesting weakening selling pressure at lower levels.
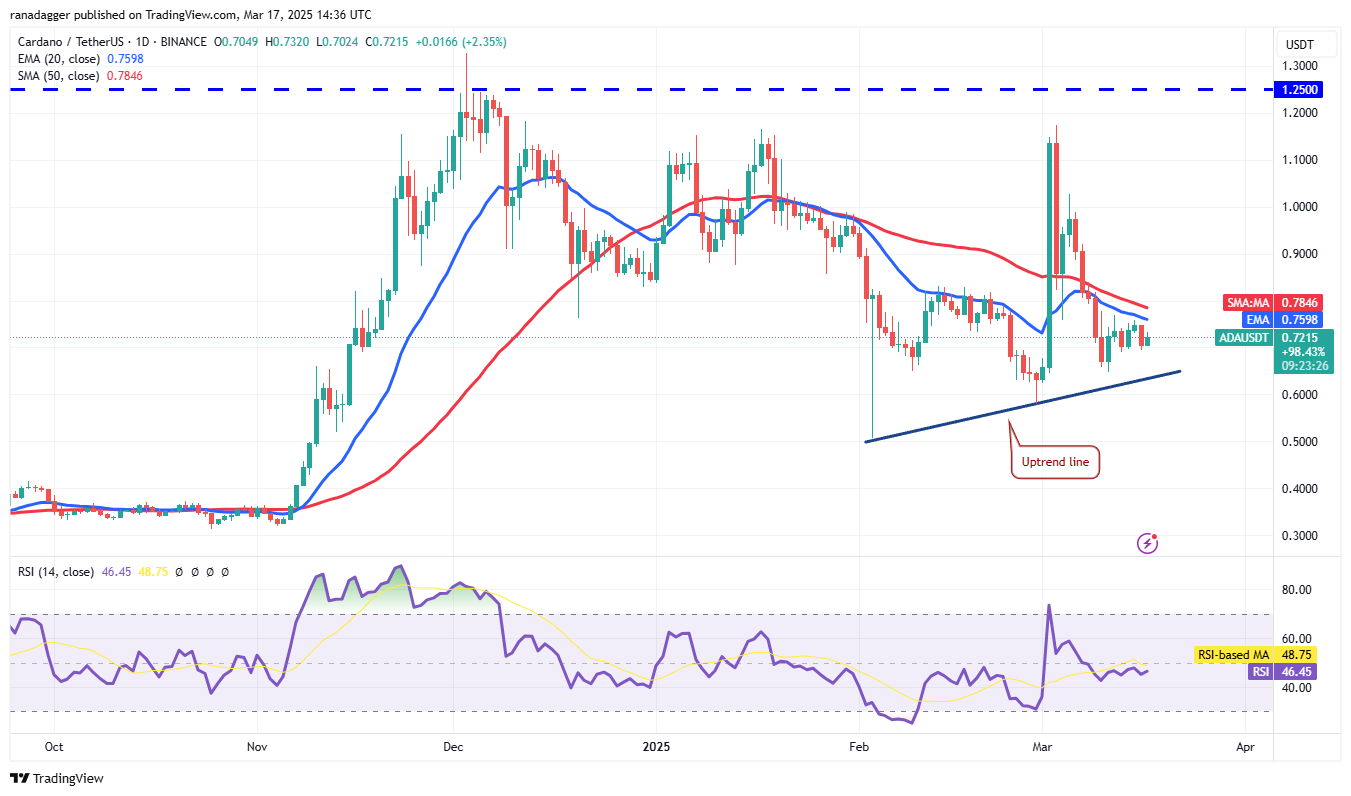
Buyers need to push the price above the moving averages for a sustained recovery, potentially reaching $1.02, where further bearish resistance is expected. A reversal from the moving averages would suggest continued bearish control, potentially leading to a drop below the uptrend line and a decline to $0.50.
Pi Price Analysis
Pi (PI) is gradually declining towards the $1.23 support level, where buying is anticipated.
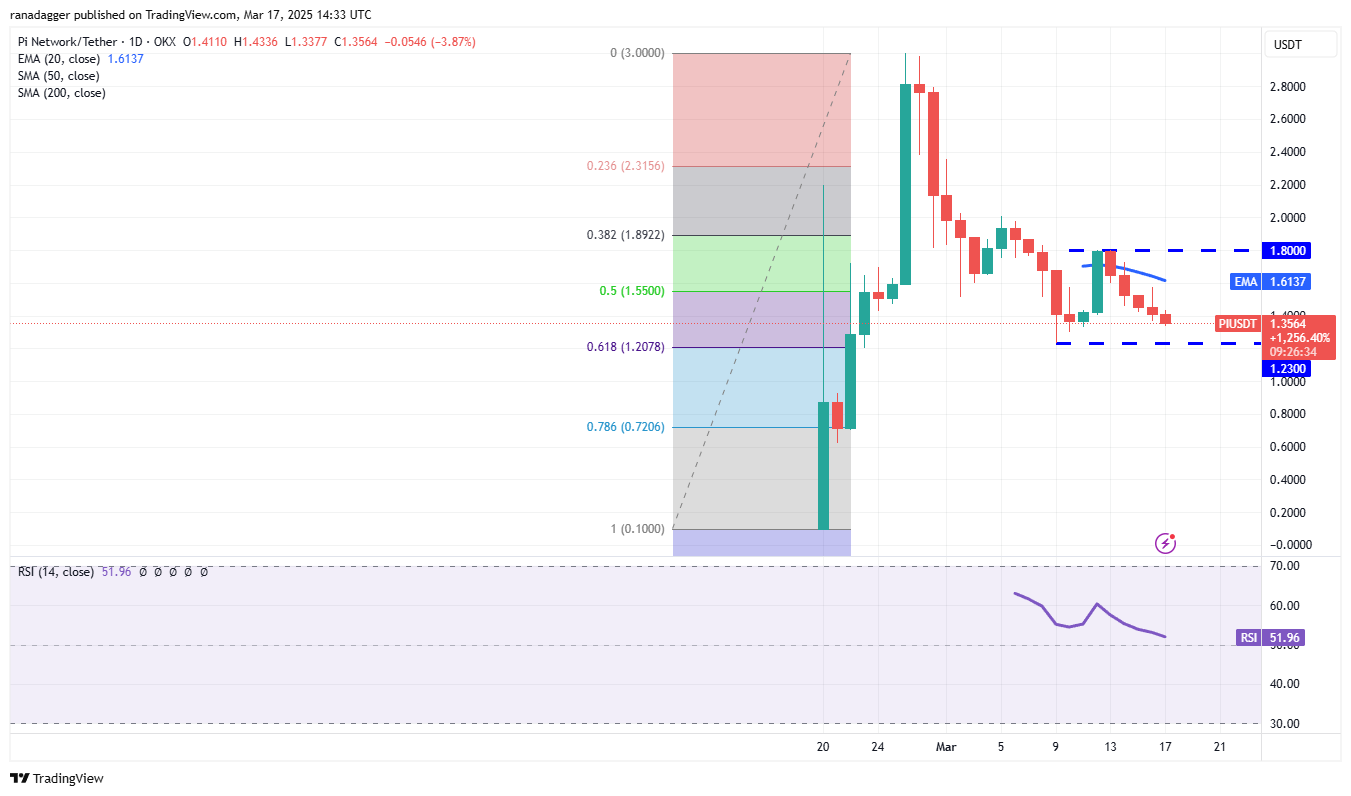
A strong rebound from $1.23 could push the PI/USDT pair back towards $1.80. While sellers are likely to challenge this level, a successful breakout could lead to a rally to $2 and then $2.35. A reversal from $1.80 would suggest range-bound trading between $1.23 and $1.80. A break below $1.23 would strengthen the bearish position, potentially leading to a decline to the 78.6% retracement level of $0.72.
Disclaimer: This article does not provide financial advice. All investment and trading decisions involve risk, and readers should conduct their own thorough research.
 Optimisus
 CFN
CFN DogeHome
 U_Today
 Cryptopolitan
 Cointelegraph
 Crypto Daily™


