

Bitcoin (BTC) has largely remained above $80,000 since March 11th, suggesting strong buyer support and a reluctance to accept deeper corrections. However, the inability to break above $86,000 indicates persistent bearish pressure and continued profit-taking on rallies.
ビットコイン(BTC)は、3月11日以来、ほぼ80,000ドルを超えていることを示唆しており、強力なバイヤーのサポートと、より深い修正を受け入れることを嫌がります。 ただし、86,000ドルを超えることができないことは、持続的な弱気圧力と集会への利益を継続することを示しています。
CoinShares' weekly report reveals significant cryptocurrency exchange-traded product (ETP) outflows totaling $1.7 billion last week. This brings the five-week outflow total to $6.4 billion, extending the negative streak to 17 days – the longest such period since CoinShares began recording data in 2015.
Coinsharesの毎週のレポートは、先週合計17億ドルの重要な暗号通貨取引所取引製品(ETP)の流出を明らかにしています。これにより、5週間の流出の合計が64億ドルになり、負の連勝を17日間に延長します。これは、コインシェアが2015年にデータの記録を開始して以来の最長の期間です。
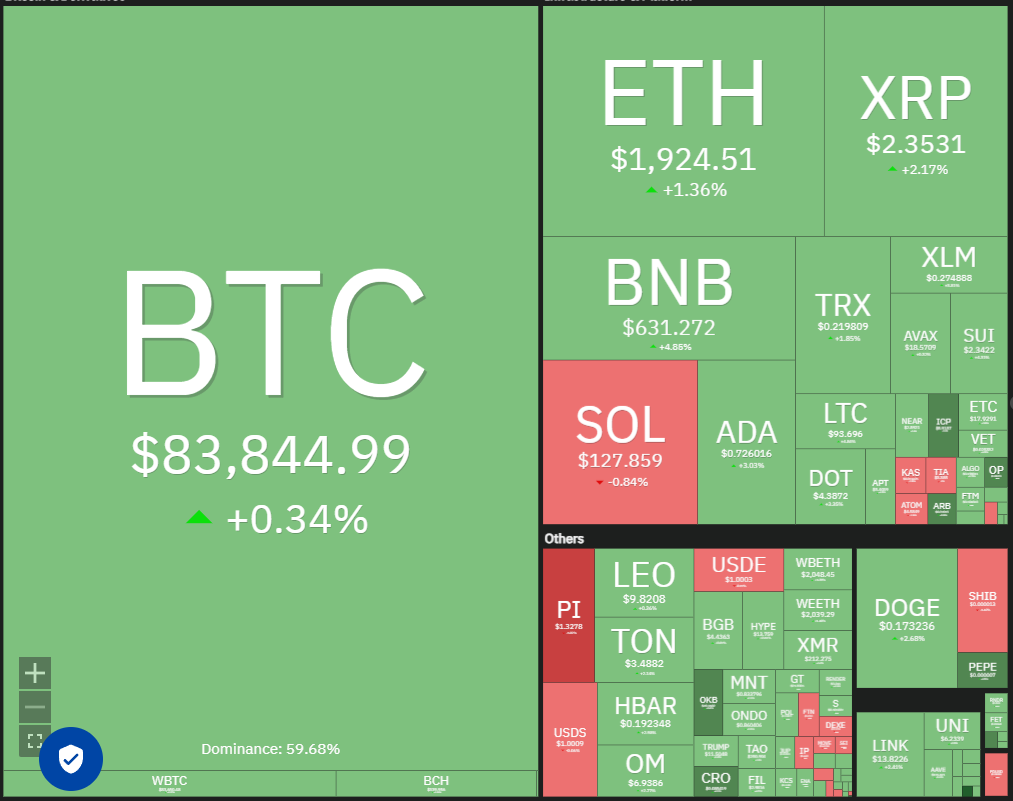
It's not entirely bleak for long-term investors. CryptoQuant contributor ShayanBTC notes an accumulation pattern among investors who acquired Bitcoin three to six months ago. Historically, such behavior has been "crucial in forming market bottoms and sparking new uptrends."
長期投資家にとって完全に暗いわけではありません。 Cryptoquantの貢献者ShayanBtcは、3〜6か月前にビットコインを取得した投資家の間で蓄積パターンを指摘しています。歴史的に、そのような行動は「市場の底を形成し、新しいアップトレンドを引き起こす上で重要でした」。
Will buyers successfully propel Bitcoin above resistance levels? What's the outlook for altcoins? Let's analyze the charts.
バイヤーはビットコインを抵抗レベルよりも上回ることに成功裏に推進しますか? Altcoinsの見通しは何ですか?チャートを分析しましょう。
S&P 500 Index Price Analysis
S&P 500インデックス価格分析
The S&P 500 Index (SPX) is undergoing a significant correction. The March 13th drop to 5,504 pushed the Relative Strength Index (RSI) into oversold territory, hinting at a potential near-term rebound.
S&P 500インデックス(SPX)は、大幅な修正を受けています。 3月13日に5,504に低下したため、相対強度指数(RSI)が売られた領土に押し込まれ、潜在的な短期的なリバウンドを示唆しました。
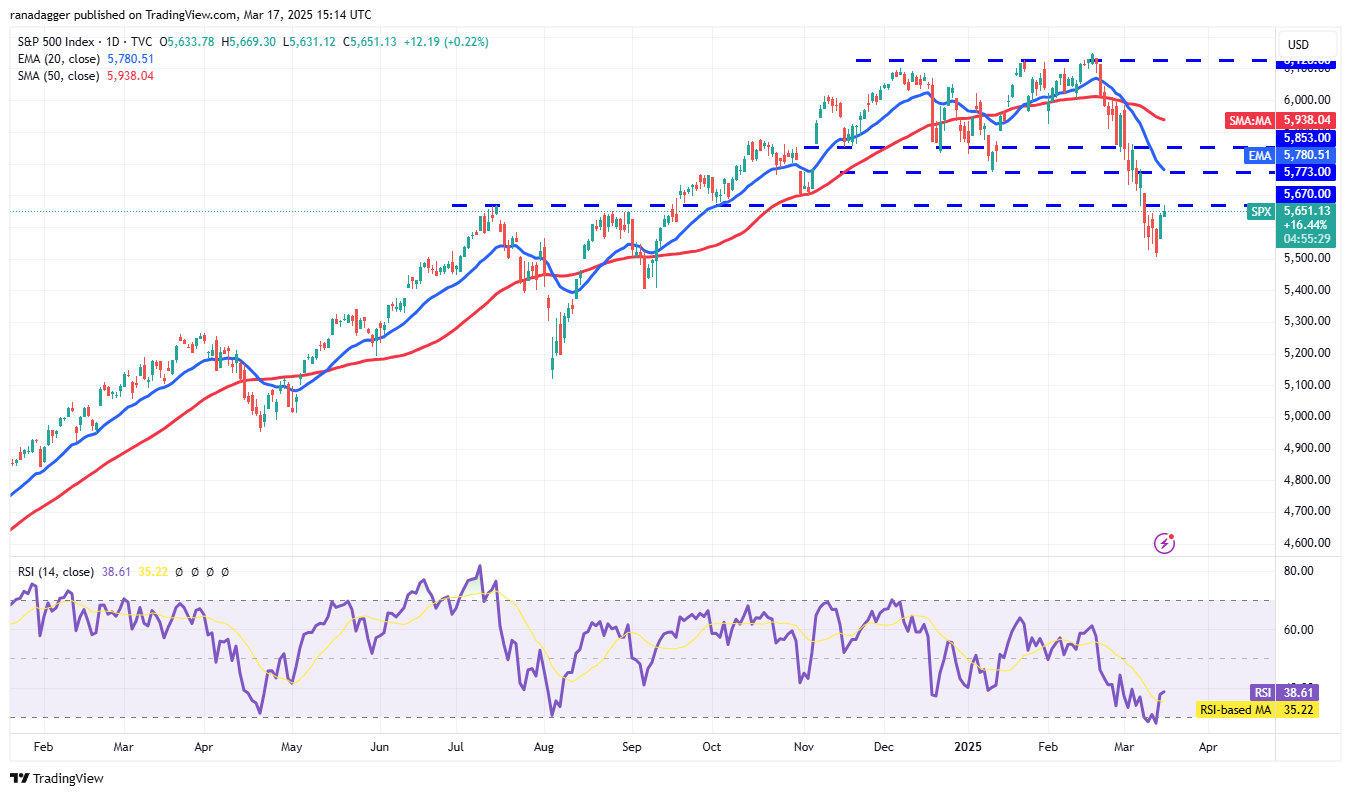
Bears may attempt to halt any recovery within the 5,670 to 5,773 resistance zone. Success here would signal continued negative sentiment and further selling on rallies, potentially leading to a drop to 5,400. The 5,400 level is expected to be strongly defended by bulls; a breach could trigger a decline to 5,100. Conversely, a decisive close above the 20-day exponential moving average (around 5,780) would indicate bullish strength, potentially leading to a rise towards the 50-day simple moving average (around 5,938).
クマは、5,670〜5,773の抵抗ゾーン内での回復を停止しようとする場合があります。ここでの成功は、継続的な否定的な感情と集会でのさらなる販売を示し、5,400に低下する可能性があります。 5,400レベルは、雄牛によって強く擁護されると予想されます。違反は5,100に減少する可能性があります。 逆に、20日間の指数移動平均(約5,780)を超える決定的な閉鎖は、強気の強さを示し、50日間の単純移動平均(約5,938)に上昇する可能性があります。
US Dollar Index Price Analysis
米ドルのインデックス価格分析
The weak rebound from the 103.37 support in the US Dollar Index (DXY) suggests sustained bearish pressure.
米ドル指数(DXY)の103.37のサポートからの弱いリバウンドは、持続的な弱気を示唆しています。
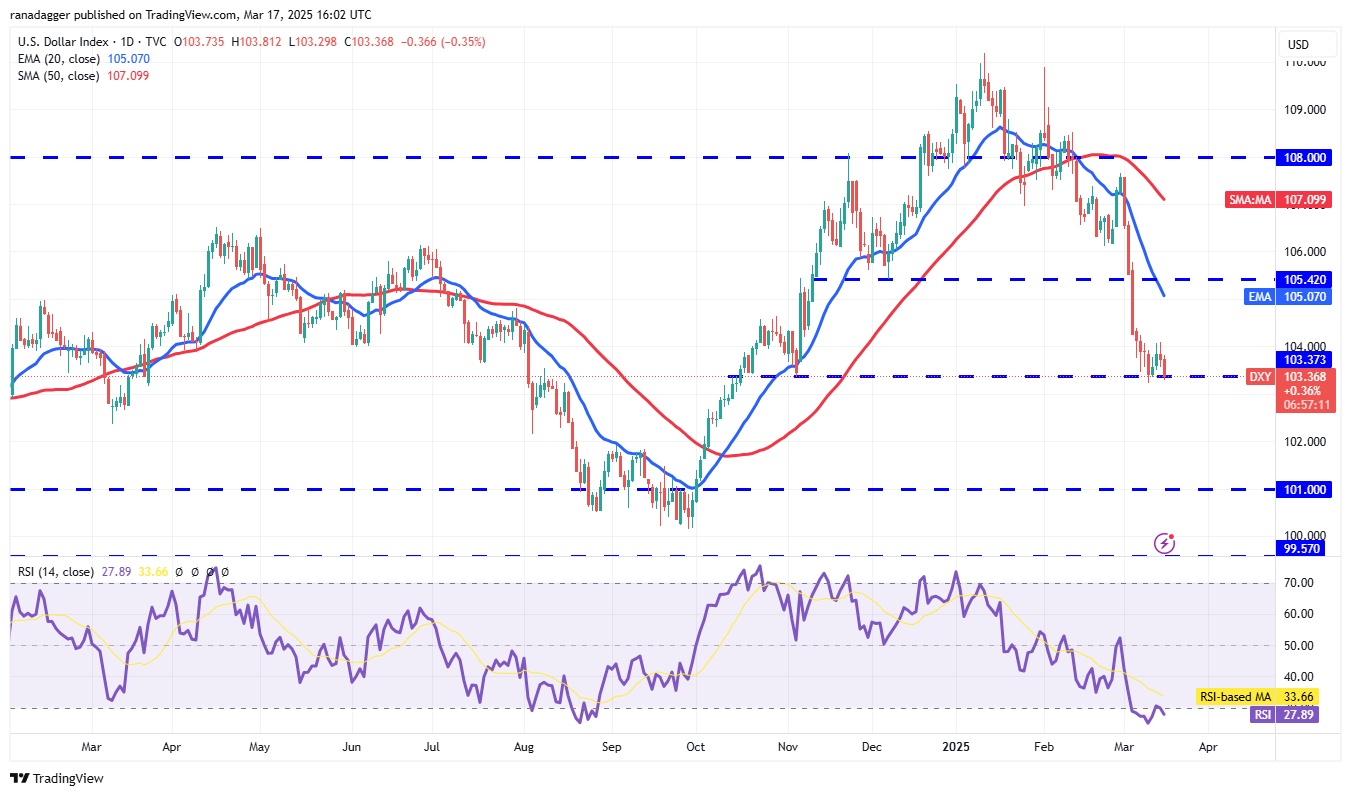
Sellers are aiming to push the index below 103.37, potentially triggering a decline to 102 and then 101. Conversely, a break above 104 would signal a potential buyer resurgence, potentially pushing the index towards the 20-day EMA (around 105), which may attract selling. Sustained buying pressure could lead to a break above the 20-day EMA and a subsequent rise to the 50-day SMA (around 107).
売り手は、103.37未満のインデックスをプッシュすることを目指しており、潜在的に102から101に減少することを引き起こすことを目指しています。逆に、104を超えるブレークは、潜在的な買い手の復活を示し、潜在的にインデックスを20日間のEMA(約105)に押し付けることができます。 持続的な購入圧力は、20日間のEMAを超えて休憩をとり、その後50日間のSMA(約107)への上昇につながる可能性があります。
Bitcoin Price Analysis
ビットコインの価格分析
Bitcoin is attempting to establish a higher low, building momentum for a potential break above the 200-day SMA ($84,112).
ビットコインは、200日間のSMA(84,112ドル)を超える潜在的な休憩のために、より高い低い、構築の勢いを確立しようとしています。
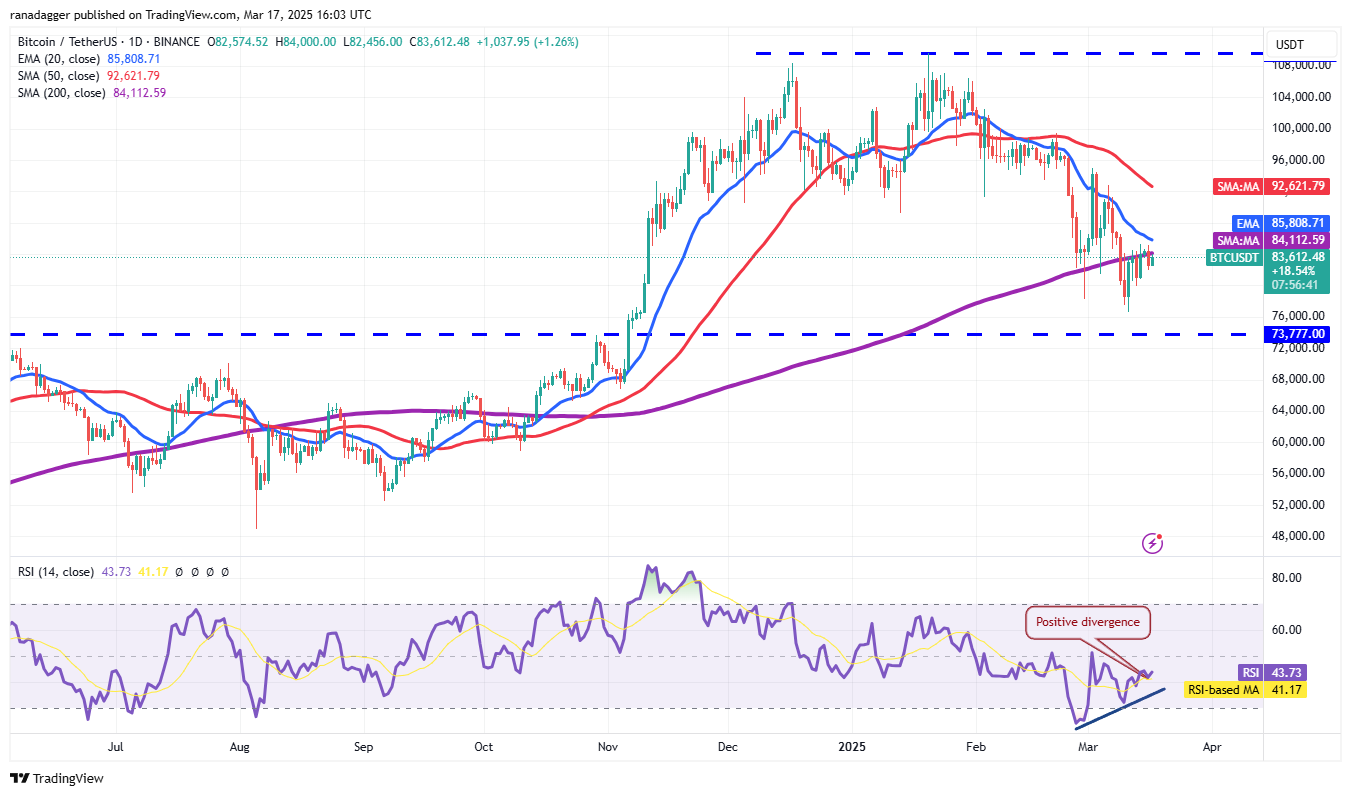
Positive divergence in the RSI suggests weakening bearish momentum. A break above the 20-day EMA ($85,808) could propel the BTC/USDT pair towards the 50-day SMA ($92,621). Conversely, a sharp downturn from the 200-day SMA would indicate a potential bearish reversal, potentially leading to a decline to $80,000 and then $76,606.
RSIの正の発散は、弱気の勢いを弱めることを示唆しています。 20日間のEMA($ 85,808)を超えるブレークは、BTC/USDTペアを50日間のSMA($ 92,621)に向けて推進する可能性があります。 逆に、200日間のSMAからの急激な低迷は、潜在的な弱気の逆転を示しており、潜在的に80,000ドル、76,606ドルに減少します。
Ether Price Analysis
エーテル価格分析
Ether (ETH) is trading within a range of $1,963 and $1,821, indicating a lack of strong buying interest at current levels.
Ether(ETH)は1,963ドルと1,821ドルの範囲内で取引されており、現在のレベルでの強い購入権が不足していることを示しています。

A fall below the $1,821 to $1,754 support zone would suggest a resumption of the downtrend, potentially leading to a drop to $1,550. Conversely, a break above the 20-day EMA ($2,107) would invalidate this bearish outlook, potentially pushing the ETH/USDT pair towards the 50-day SMA ($2,514) and potentially further to $2,857 if bulls overcome resistance.
1,821ドルから1,754ドルのサポートゾーンを下回ると、下降トレンドの再開が示唆され、1,550ドルに低下する可能性があります。 逆に、20日間のEMA($ 2,107)を超えるブレークは、この弱気な見通しを無効にし、潜在的にETH/USDTペアを50日間のSMA(2,514ドル)に押し付け、ブルズが抵抗を克服した場合、潜在的にさらに2,857ドルになります。
XRP Price Analysis
XRP価格分析
XRP (XRP) reversed from the 50-day SMA ($2.51) on March 15th, highlighting bearish activity at higher levels.
XRP(XRP)は、3月15日に50日間のSMA($ 2.51)から逆転し、より高いレベルでの弱気活動を強調しました。
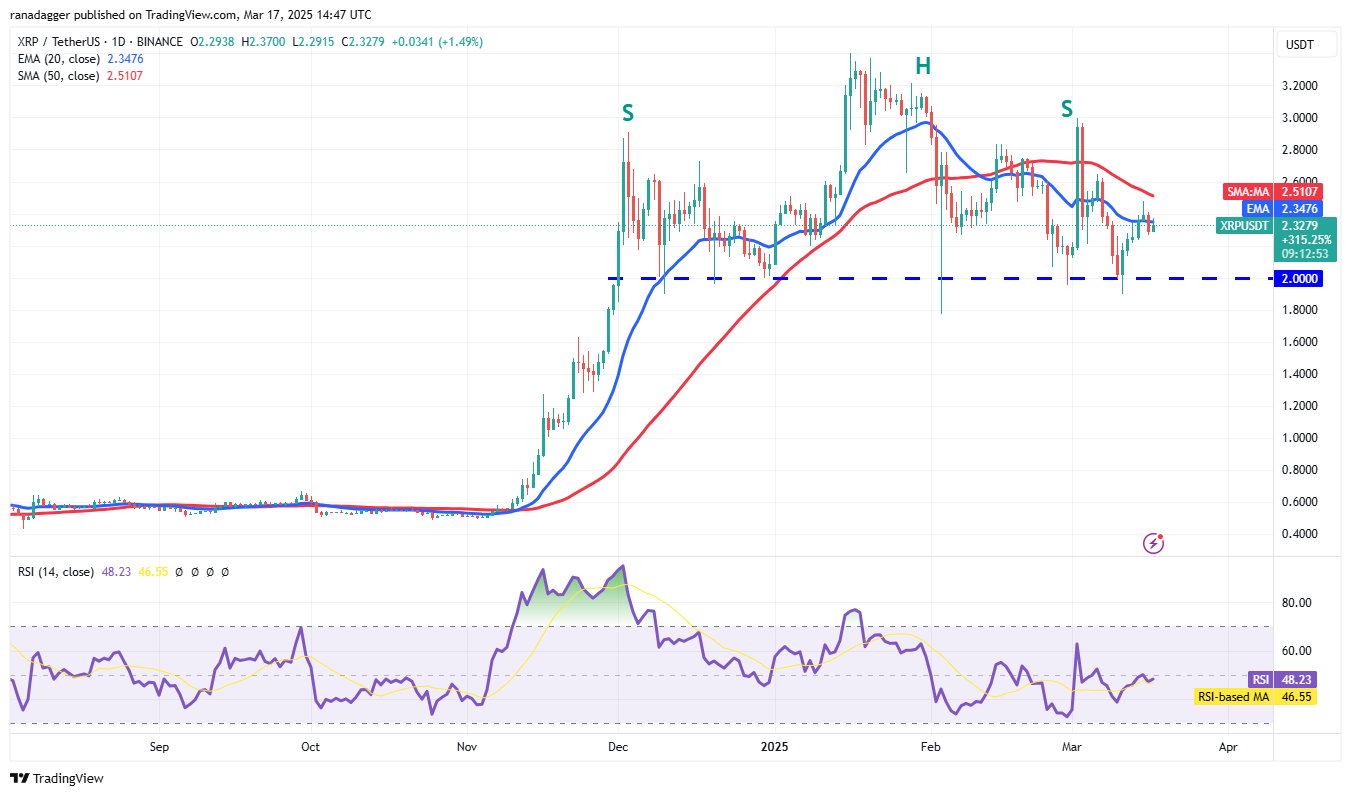
The 20-day EMA ($2.34) is relatively flat, and the RSI is near the midpoint, indicating a balance between supply and demand. The XRP/USDT pair may consolidate between the 50-day SMA and $2. A break above the 50-day SMA could lead to a rally to $3. A break below $2 would complete a head-and-shoulders pattern, potentially leading to a decline to $1.28.
20日間のEMA(2.34ドル)は比較的平坦で、RSIは中間点に近く、需要と供給のバランスを示しています。 XRP/USDTペアは、50日間のSMAと2ドルの間で統合する場合があります。 50日間のSMAを上回るブレークは、3ドルまでの集会につながる可能性があります。 2ドルを下回るブレークは、頭と肩のパターンを完成させ、潜在的に1.28ドルに減少する可能性があります。
BNB Price Analysis
BNB価格分析
BNB (BNB) rebounded from the 20-day EMA ($598) and surpassed the 50-day SMA ($620), suggesting a potential end to the correction.
BNB(BNB)は20日間のEMA(598ドル)から反発し、50日間のSMA(620ドル)を上回り、補正の潜在的な終了を示唆しています。
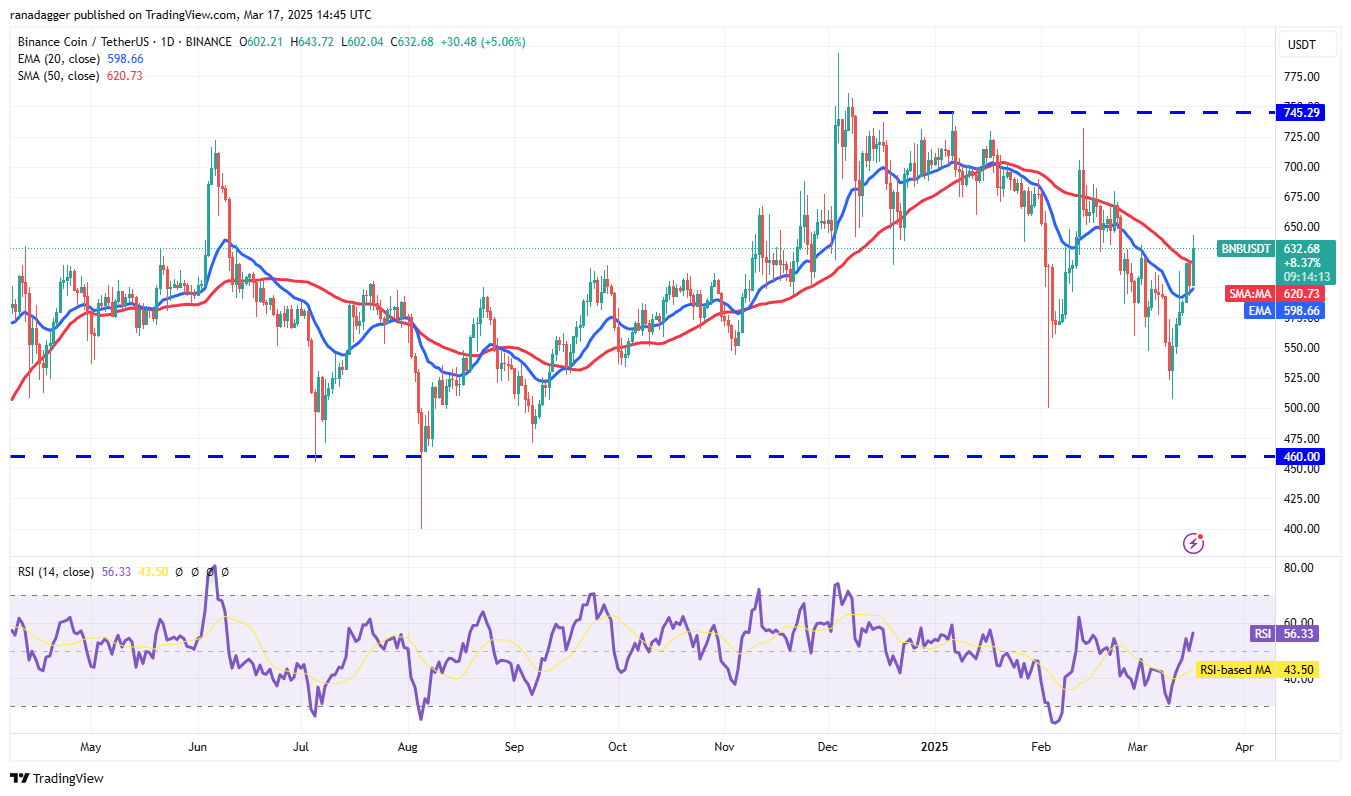
The 20-day EMA is turning upwards, and the RSI is in positive territory, favoring bulls. Sustained trading above the 50-day SMA could lead to a rally to $686 and potentially $745. A break below the 20-day EMA would signal a shift in momentum to bears, potentially leading to a decline to the strong support at $500.
20日間のEMAは上に向かっており、RSIは前向きな領域にあり、雄牛を支持しています。 50日間のSMAを超える持続的な取引は、686ドル、潜在的に745ドルまでの集会につながる可能性があります。 20日間のEMAを下回るブレークは、クマへの勢いの変化を示し、潜在的に500ドルの強力な支援を拒否することになります。
Solana Price Analysis
ソラナ価格分析
Solana (SOL) reversed from the 20-day EMA ($139) on March 16th, indicating strong bearish defense of that level.
Solana(Sol)は3月16日に20日間のEMA($ 139)から逆転し、そのレベルの強い弱気の防御を示しています。
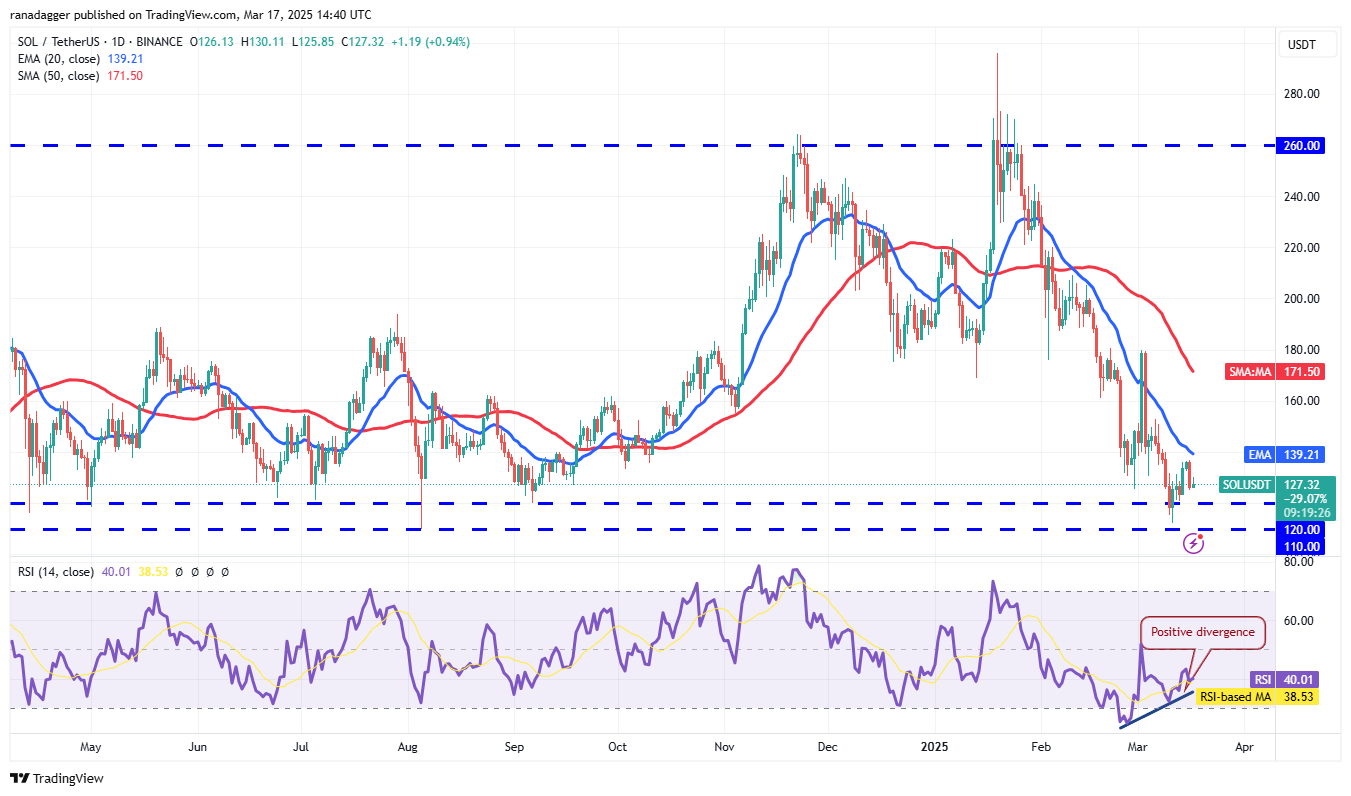
The SOL/USDT pair could decline to $120 and then $110, where buying support is anticipated. A rebound from this support zone could lead to another attempt to break above the 20-day EMA, potentially reaching $180. A continued decline below the support zone would invalidate this bullish scenario, potentially triggering a drop to $100 and then $80.
Sol/USDTペアは、購入サポートが予想される場合、120ドル、その後110ドルに減少する可能性があります。 このサポートゾーンからのリバウンドは、20日間のEMAを超えようとする別の試みにつながる可能性があり、潜在的に180ドルに達する可能性があります。 サポートゾーンを下回る継続的な減少は、この強気のシナリオを無効にし、100ドルに減少してから80ドルに引き下げられる可能性があります。
Dogecoin Price Analysis
Dogecoin価格分析
Dogecoin (DOGE) is gradually approaching the 20-day EMA ($0.19), a key near-term resistance level.
Dogecoin(Doge)は、主要な短期抵抗レベルである20日間のEMA(0.19ドル)に徐々に近づいています。
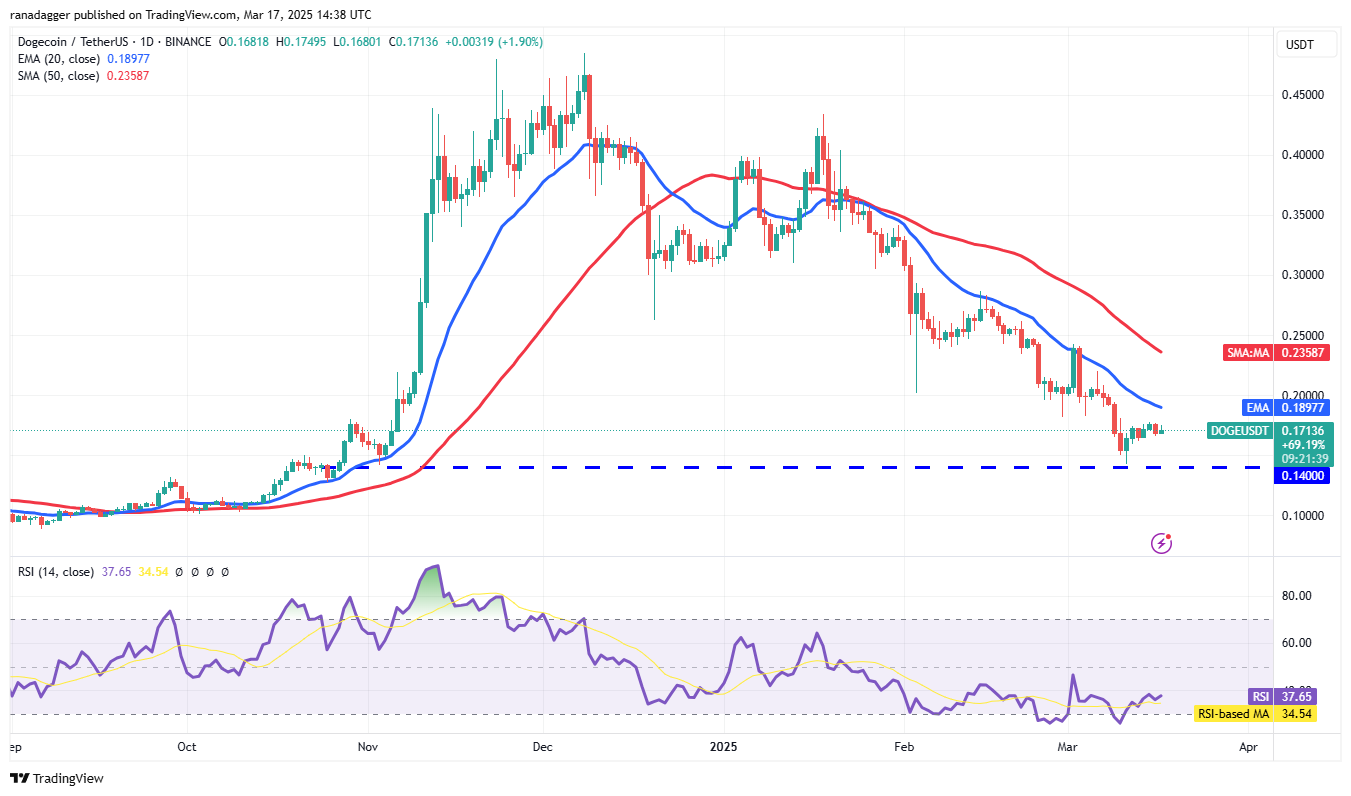
A sharp reversal from the 20-day EMA would suggest bearish selling on rallies, increasing the risk of a break below the $0.14 support and a potential decline to $0.10. Conversely, a break above the 20-day EMA would indicate reduced selling pressure, potentially leading to a rise to the 50-day SMA ($0.23) and then to $0.29. A close above $0.29 would signal strong buyer control.
20日間のEMAからの鋭い逆転は、集会での弱気販売を示唆し、0.14ドルのサポートを下回る休憩のリスクを高め、0.10ドルへの潜在的な減少を示唆しています。 逆に、20日間のEMAを超えるブレークは、販売圧力の低下を示し、50日間のSMA(0.23ドル)に上昇し、その後0.29ドルになります。 0.29ドルを超える近づきは、強力なバイヤーコントロールを知らせます。
Cardano Price Analysis
カルダノ価格分析
Cardano (ADA) has traded below the 20-day EMA ($0.76) since March 8th, but the bears have failed to break the uptrend line, suggesting weakening selling pressure at lower levels.
カルダノ(ADA)は3月8日から20日間のEMA(0.76ドル)を下回っていますが、ベアーズは上昇傾向を壊すことができず、低レベルでの販売圧力の弱さを示唆しています。
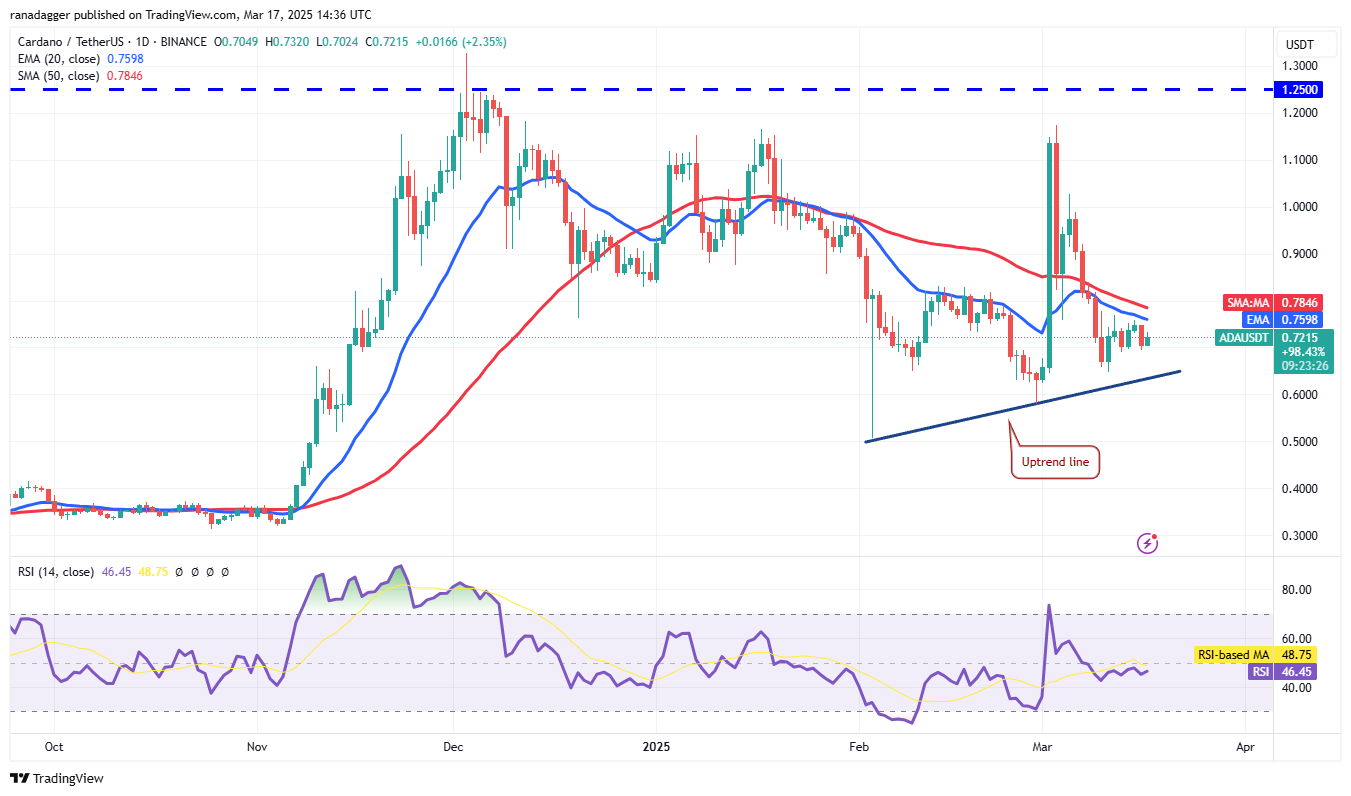
Buyers need to push the price above the moving averages for a sustained recovery, potentially reaching $1.02, where further bearish resistance is expected. A reversal from the moving averages would suggest continued bearish control, potentially leading to a drop below the uptrend line and a decline to $0.50.
バイヤーは、さらなる弱気抵抗が予想される潜在的に1.02ドルに達する可能性がある、持続的な回復のために、移動平均を上回る価格をプッシュする必要があります。 移動平均からの逆転は、継続的な弱気制御を示唆し、潜在的にアップトレンドラインを下回り、0.50ドルに減少することを示唆します。
Pi Price Analysis
PI価格分析
Pi (PI) is gradually declining towards the $1.23 support level, where buying is anticipated.
PI(PI)は、購入が予想される1.23ドルのサポートレベルに徐々に減少しています。
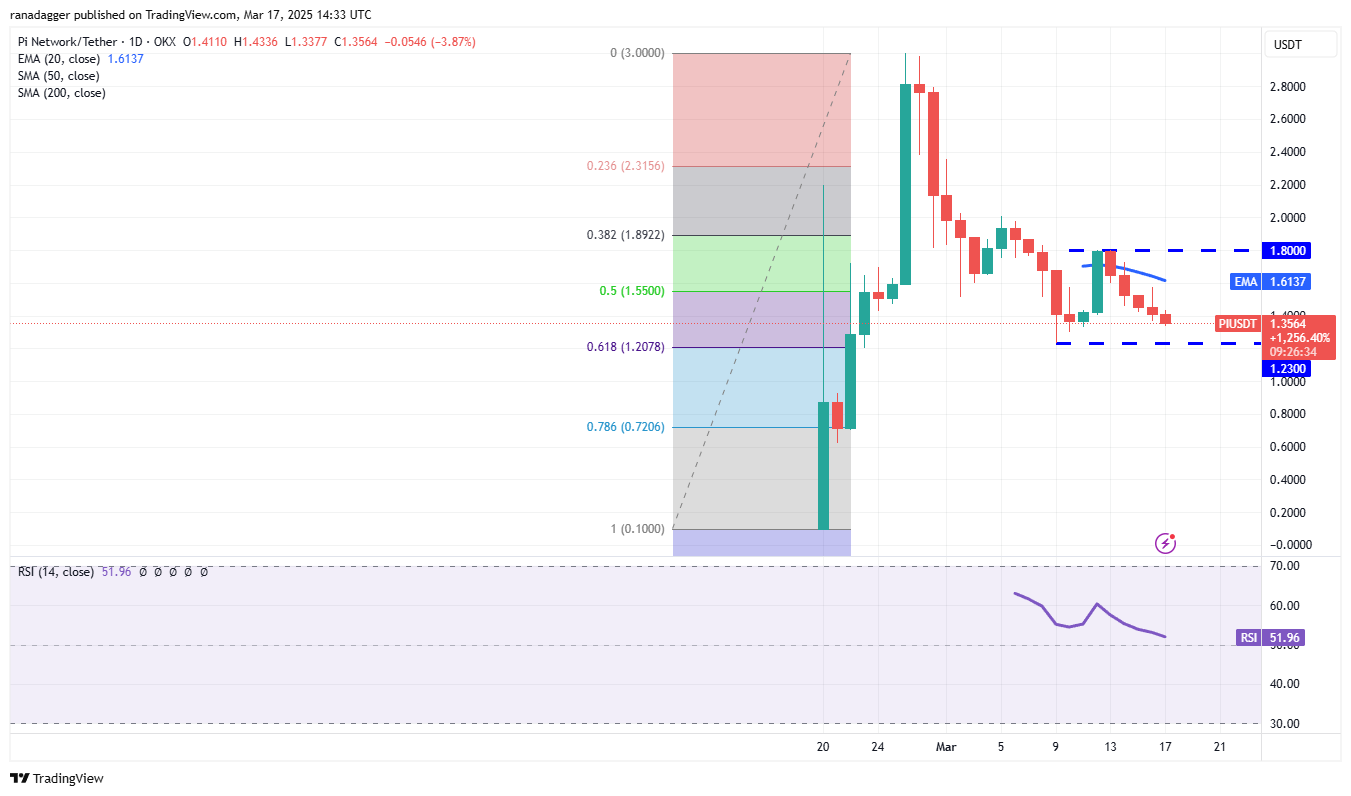
A strong rebound from $1.23 could push the PI/USDT pair back towards $1.80. While sellers are likely to challenge this level, a successful breakout could lead to a rally to $2 and then $2.35. A reversal from $1.80 would suggest range-bound trading between $1.23 and $1.80. A break below $1.23 would strengthen the bearish position, potentially leading to a decline to the 78.6% retracement level of $0.72.
1.23ドルからの強いリバウンドは、Pi/USDTペアを1.80ドルに戻す可能性があります。 売り手はこのレベルに挑戦する可能性が高いが、ブレイクアウトが成功すると、集会が2ドル、2.35ドルになる可能性があります。 1.80ドルからの逆転は、1.23ドルから1.80ドルの範囲に縛られた取引を示唆します。 1.23ドルを下回るブレークは、弱気の位置を強化し、78.6%のリトレースメントレベルが0.72ドルの減少につながる可能性があります。
Disclaimer: This article does not provide financial advice. All investment and trading decisions involve risk, and readers should conduct their own thorough research.
免責事項:この記事では、財政的なアドバイスは提供されていません。すべての投資と取引の決定にはリスクが含まれ、読者は独自の徹底的な調査を行う必要があります。
 DogeHome
 CFN
CFN Optimisus
 CFN
CFN U_Today


