

Bitcoin (BTC) has largely remained above $80,000 since March 11th, suggesting strong buyer support and a reluctance to accept deeper corrections. However, the inability to break above $86,000 indicates persistent bearish pressure and continued profit-taking on rallies.
自3月11日以來,比特幣(BTC)一直保持在80,000美元以上,這表明買家的支持和不願接受更深入的更正。 但是,無法中斷86,000美元以表明持續的看跌壓力和對集會的持續利潤。
CoinShares' weekly report reveals significant cryptocurrency exchange-traded product (ETP) outflows totaling $1.7 billion last week. This brings the five-week outflow total to $6.4 billion, extending the negative streak to 17 days – the longest such period since CoinShares began recording data in 2015.
Coinshares的每週報告顯示,上週總計17億美元的加密貨幣交易所交易產品(ETP)流出。這使五週的流出量達到64億美元,將負連續劇延長至17天,這是自2015年Coinshares開始錄製數據以來的最長時期。
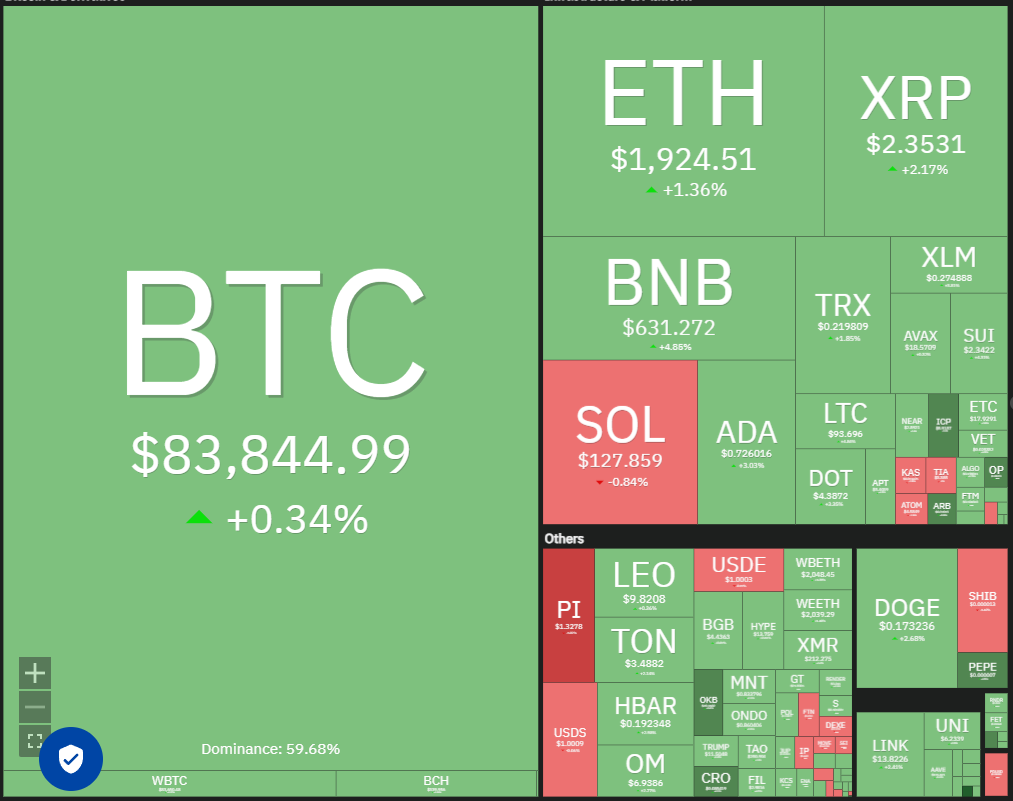
It's not entirely bleak for long-term investors. CryptoQuant contributor ShayanBTC notes an accumulation pattern among investors who acquired Bitcoin three to six months ago. Historically, such behavior has been "crucial in forming market bottoms and sparking new uptrends."
對於長期投資者而言,這並不是完全黯淡的。 加密貢獻者Shayanbtc指出了三到六個月前收購比特幣的投資者的積累模式。從歷史上看,這種行為“對於形成市場底層和引發新的上升趨勢至關重要”。
Will buyers successfully propel Bitcoin above resistance levels? What's the outlook for altcoins? Let's analyze the charts.
買家會成功推動比特幣高於阻力水平嗎? Altcoins的前景是什麼?讓我們分析圖表。
S&P 500 Index Price Analysis
標準普爾500指數分析
The S&P 500 Index (SPX) is undergoing a significant correction. The March 13th drop to 5,504 pushed the Relative Strength Index (RSI) into oversold territory, hinting at a potential near-term rebound.
標準普爾500指數(SPX)正在進行明顯的校正。 3月13日下降到5,504,將相對強度指數(RSI)推向了超賣領土,暗示了潛在的近期反彈。
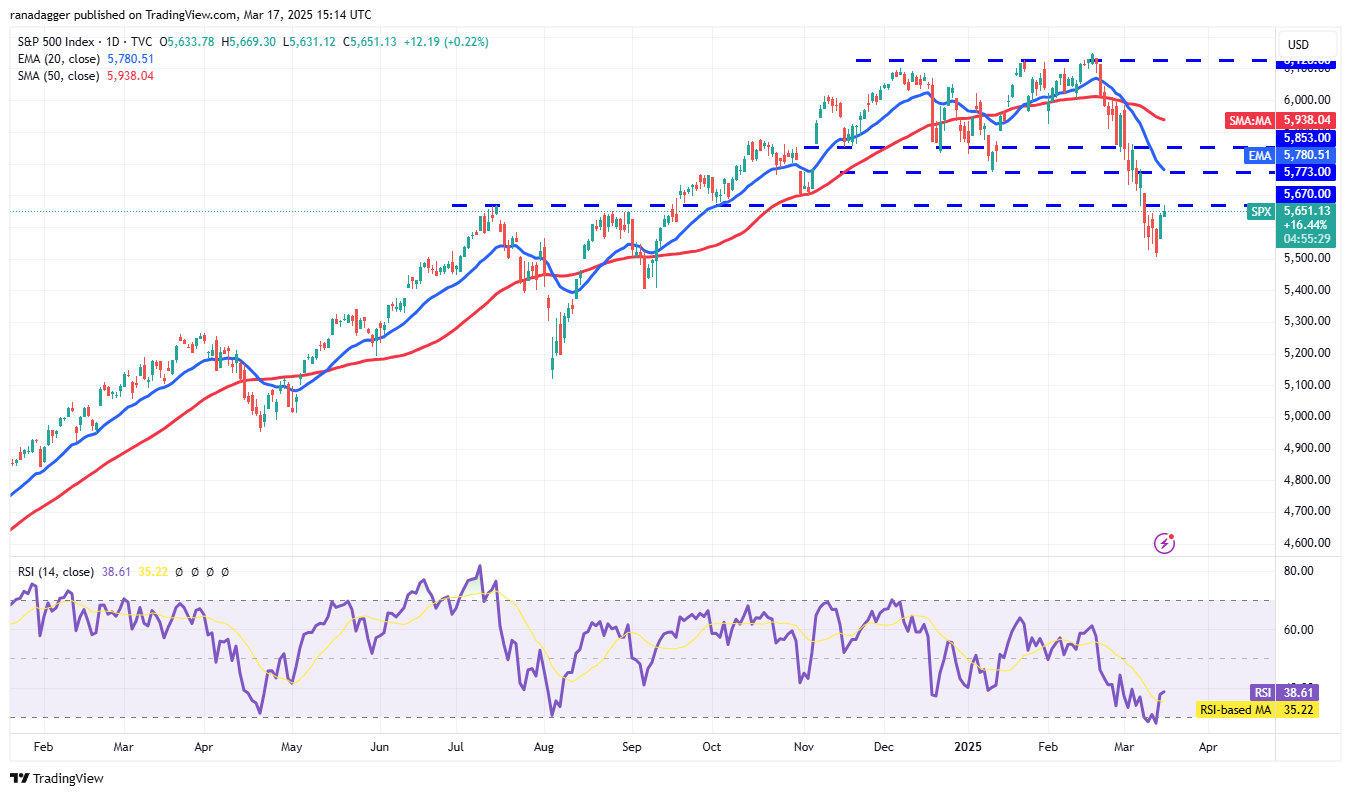
Bears may attempt to halt any recovery within the 5,670 to 5,773 resistance zone. Success here would signal continued negative sentiment and further selling on rallies, potentially leading to a drop to 5,400. The 5,400 level is expected to be strongly defended by bulls; a breach could trigger a decline to 5,100. Conversely, a decisive close above the 20-day exponential moving average (around 5,780) would indicate bullish strength, potentially leading to a rise towards the 50-day simple moving average (around 5,938).
熊可能試圖停止5,670至5,773電阻區內的任何恢復。在這裡的成功將表明持續的負面情緒並進一步銷售集會,可能導致5,400次下降。 預計公牛會強烈捍衛5,400級;違規行為可能會導致下降到5,100。 相反,超過20天的指數移動平均線(約5,780)的決定性接近將表明看漲力量,這可能導致朝著50天的簡單移動平均線升高(約5,938)。
US Dollar Index Price Analysis
美元索引價格分析
The weak rebound from the 103.37 support in the US Dollar Index (DXY) suggests sustained bearish pressure.
美元指數(DXY)中103.37支持的反彈較弱,表明持續的看跌壓力。
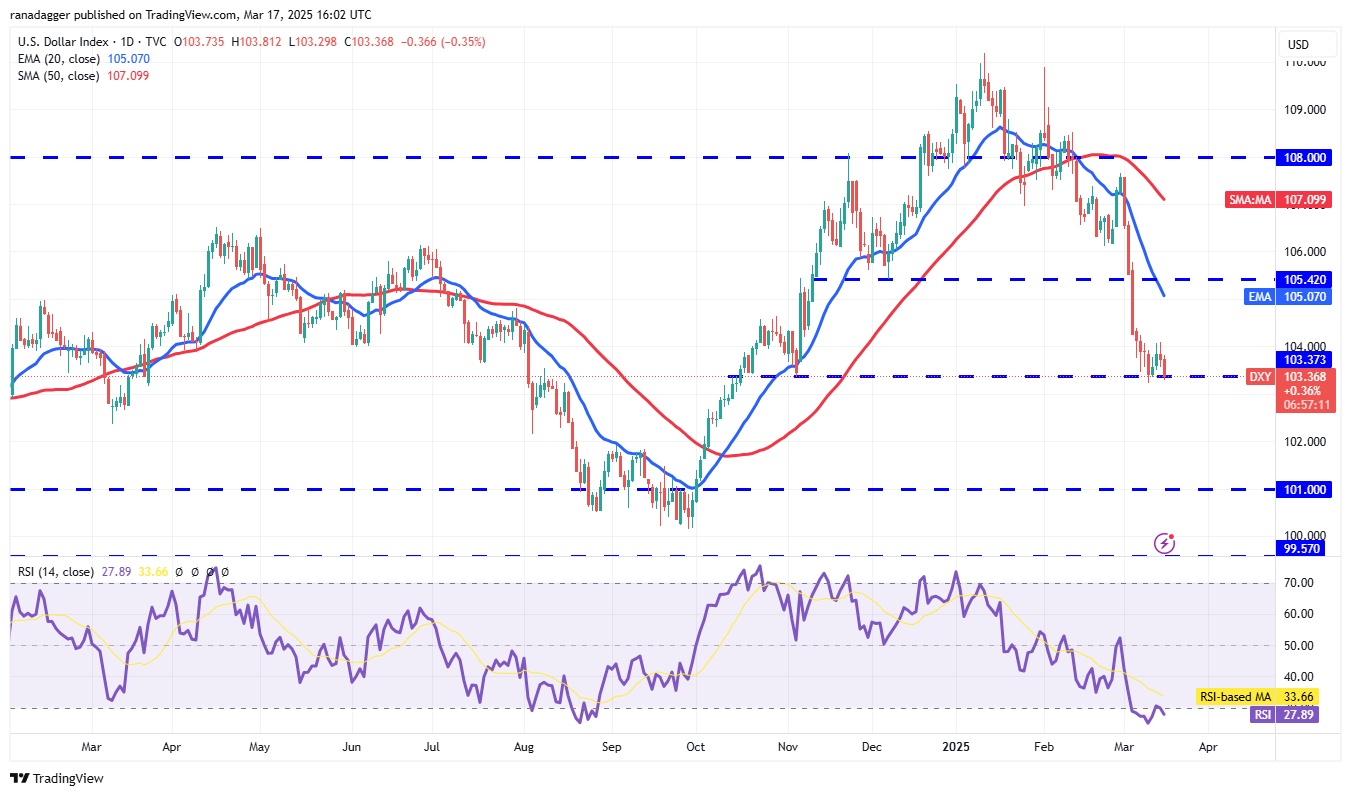
Sellers are aiming to push the index below 103.37, potentially triggering a decline to 102 and then 101. Conversely, a break above 104 would signal a potential buyer resurgence, potentially pushing the index towards the 20-day EMA (around 105), which may attract selling. Sustained buying pressure could lead to a break above the 20-day EMA and a subsequent rise to the 50-day SMA (around 107).
賣方的目標是將指數提高到103.37以下,可能會導致下降到102,然後將101下降到101中。相反,超過104的突破將表明潛在的買家復興,可能會將指數推向20天EMA(左右105),這可能會吸引銷售。 持續的購買壓力可能導致超過20天EMA的突破,隨後增加到50天的SMA(約107左右)。
Bitcoin Price Analysis
比特幣價格分析
Bitcoin is attempting to establish a higher low, building momentum for a potential break above the 200-day SMA ($84,112).
比特幣試圖建立更高的低點,建立勢頭,以高於200天SMA的潛在突破(84,112美元)。
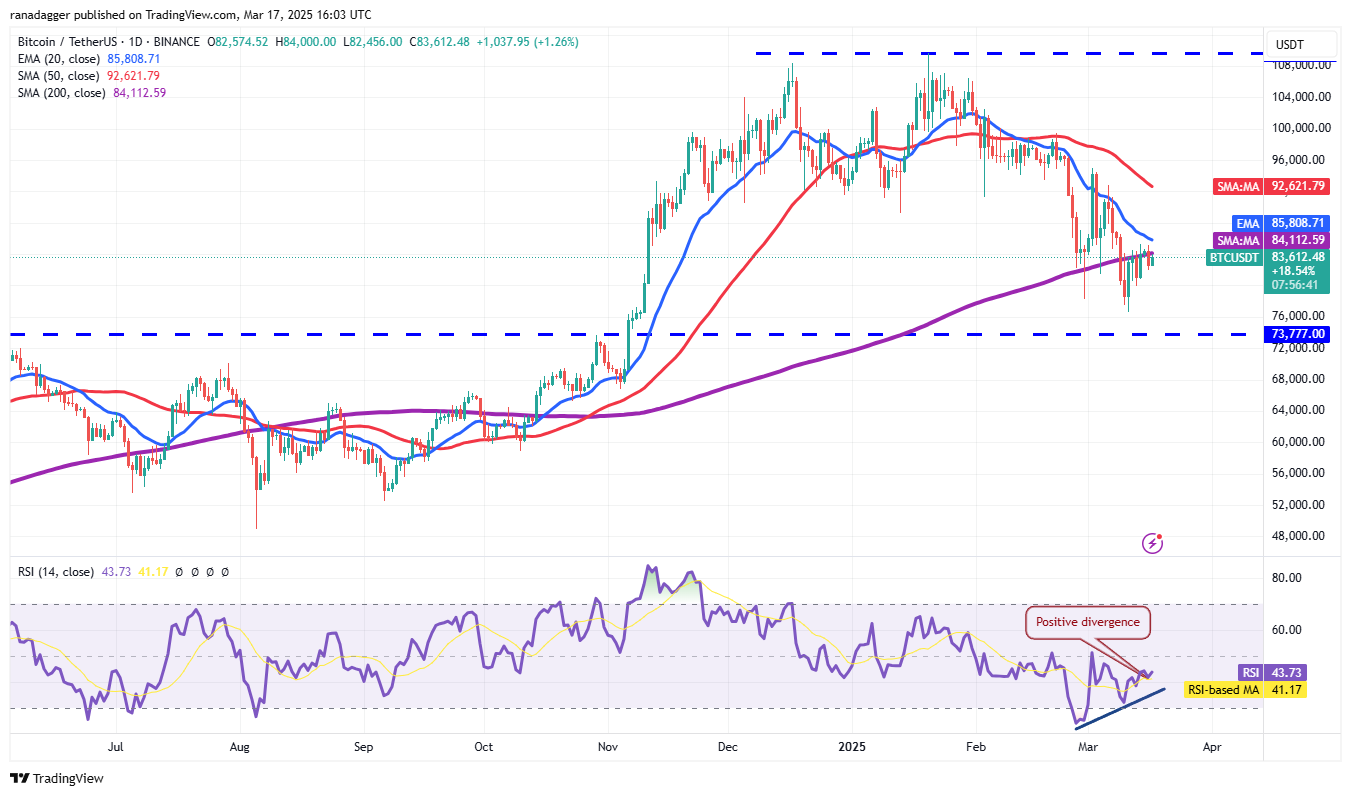
Positive divergence in the RSI suggests weakening bearish momentum. A break above the 20-day EMA ($85,808) could propel the BTC/USDT pair towards the 50-day SMA ($92,621). Conversely, a sharp downturn from the 200-day SMA would indicate a potential bearish reversal, potentially leading to a decline to $80,000 and then $76,606.
RSI中的陽性差異表明看跌勢頭減弱。 超過20天EMA($ 85,808)的休息時間可以推動BTC/USDT對的50天SMA($ 92,621)。 相反,200天SMA的急劇下滑將表明潛在的看跌逆轉,可能導致下降到80,000美元,然後下降76,606美元。
Ether Price Analysis
以太價格分析
Ether (ETH) is trading within a range of $1,963 and $1,821, indicating a lack of strong buying interest at current levels.
Ether(ETH)的交易範圍在1,963美元和1,821美元之間,這表明目前水平缺乏強勁的購買息。

A fall below the $1,821 to $1,754 support zone would suggest a resumption of the downtrend, potentially leading to a drop to $1,550. Conversely, a break above the 20-day EMA ($2,107) would invalidate this bearish outlook, potentially pushing the ETH/USDT pair towards the 50-day SMA ($2,514) and potentially further to $2,857 if bulls overcome resistance.
低於$ 1,821到$ 1,754的支持區的下降將表明恢復下降趨勢,可能導致下降至1,550美元。 相反,超過20天EMA(2,107美元)的休息時間將使這種看跌的前景無效,這可能會將ETH/USDT對推向50天的SMA(2,514美元),如果公牛克服抵抗力,則可能會進一步降至2,857美元。
XRP Price Analysis
XRP價格分析
XRP (XRP) reversed from the 50-day SMA ($2.51) on March 15th, highlighting bearish activity at higher levels.
XRP(XRP)於3月15日從50天的SMA($ 2.51)逆轉,突出了更高級別的看跌活動。
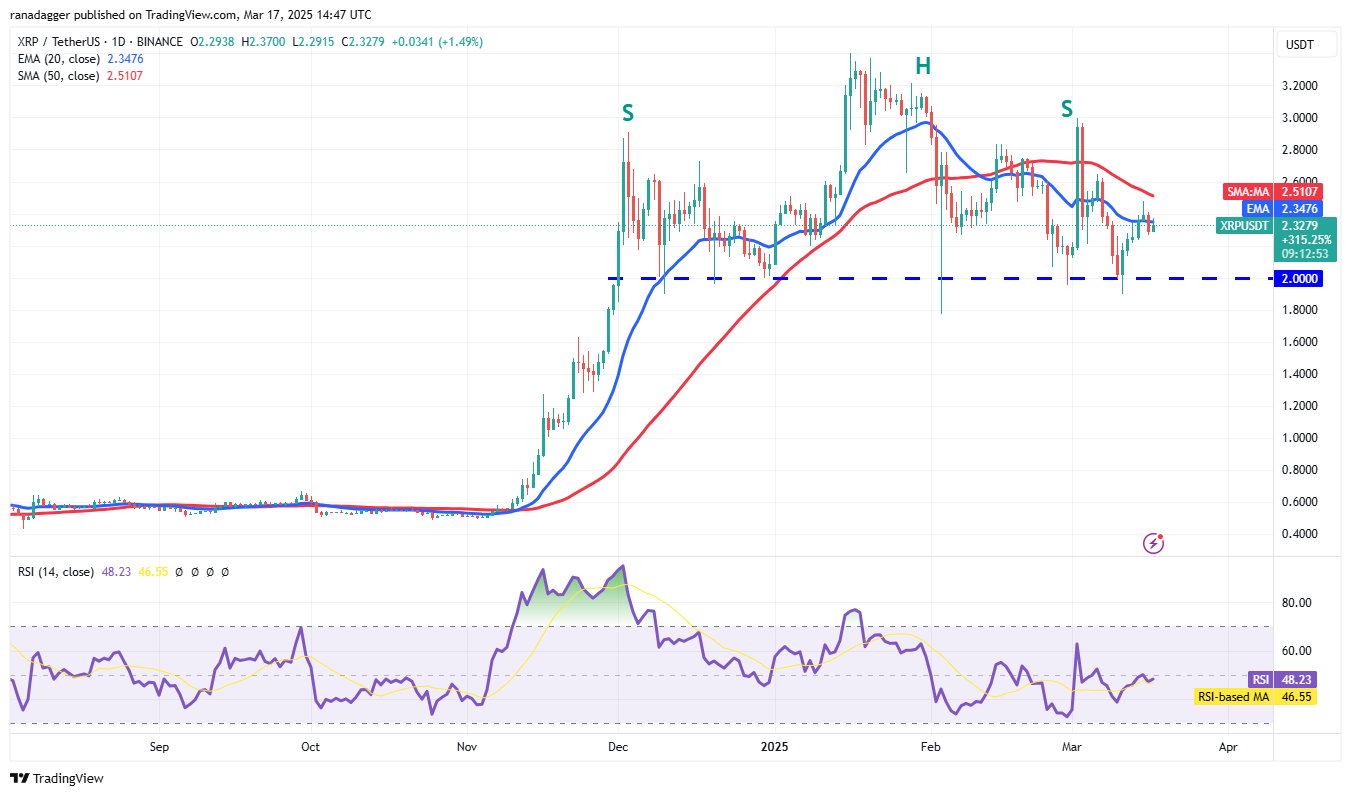
The 20-day EMA ($2.34) is relatively flat, and the RSI is near the midpoint, indicating a balance between supply and demand. The XRP/USDT pair may consolidate between the 50-day SMA and $2. A break above the 50-day SMA could lead to a rally to $3. A break below $2 would complete a head-and-shoulders pattern, potentially leading to a decline to $1.28.
20天EMA($ 2.34)相對平坦,RSI接近中點,表明供應和需求之間的平衡。 XRP/USDT對可以合併50天的SMA至$ 2。超過50天的SMA的休息可能會導致集會至3美元。 低於$ 2的休息時間將完成頭部和肩膀的模式,可能導致下降至1.28美元。
BNB Price Analysis
BNB價格分析
BNB (BNB) rebounded from the 20-day EMA ($598) and surpassed the 50-day SMA ($620), suggesting a potential end to the correction.
BNB(BNB)從20天的EMA(598美元)反彈,超過了50天的SMA(620美元),這表明該更正的潛在結束。
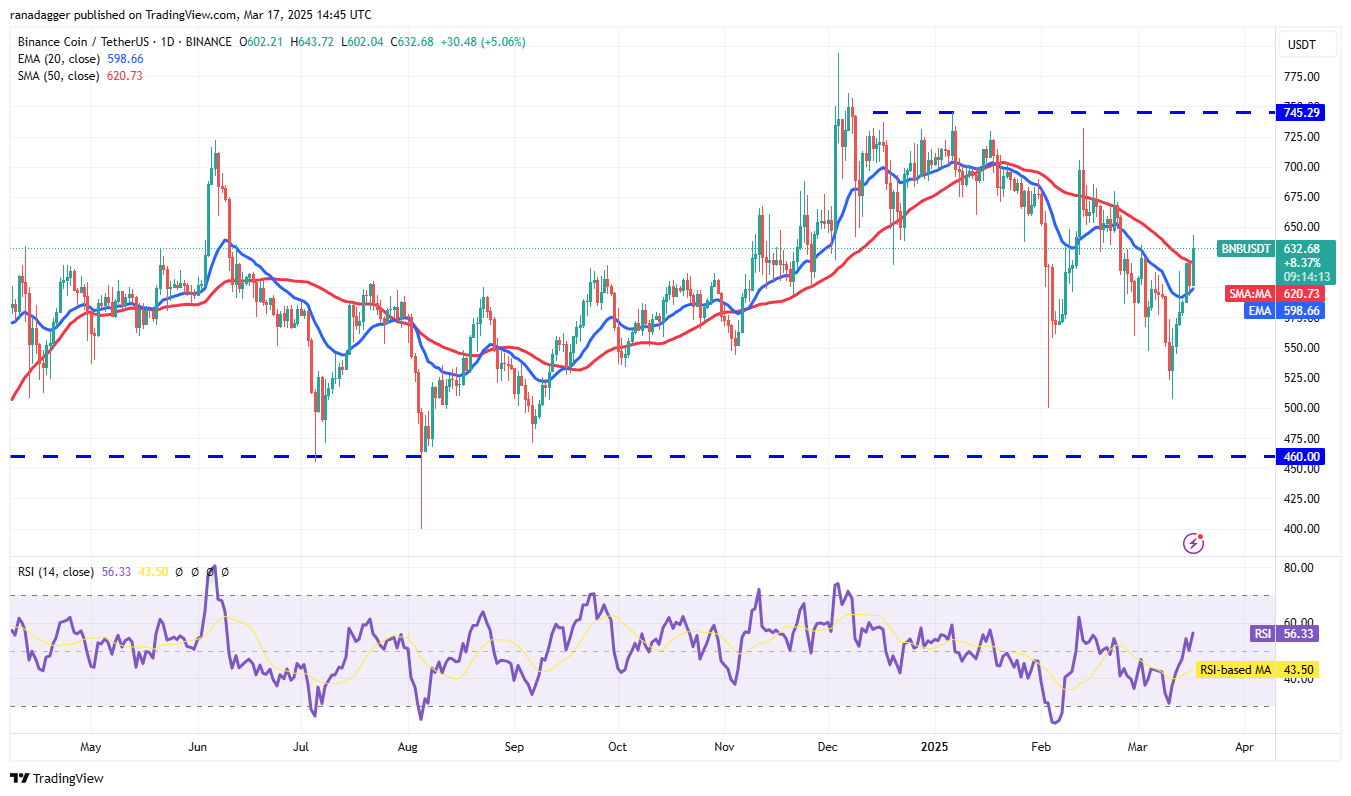
The 20-day EMA is turning upwards, and the RSI is in positive territory, favoring bulls. Sustained trading above the 50-day SMA could lead to a rally to $686 and potentially $745. A break below the 20-day EMA would signal a shift in momentum to bears, potentially leading to a decline to the strong support at $500.
為期20天的EMA正在向上轉動,RSI在積極的領土上,偏愛公牛。 超過50天SMA的持續交易可能會導致集會至686美元,並可能達到745美元。 低於20天的EMA的突破將表明動量轉向熊,可能導致下降到500美元的強勁支持下降。
Solana Price Analysis
Solana價格分析
Solana (SOL) reversed from the 20-day EMA ($139) on March 16th, indicating strong bearish defense of that level.
Solana(Sol)於3月16日從20天的EMA(139美元)扭轉,表明對此水平有強烈的看跌防禦。
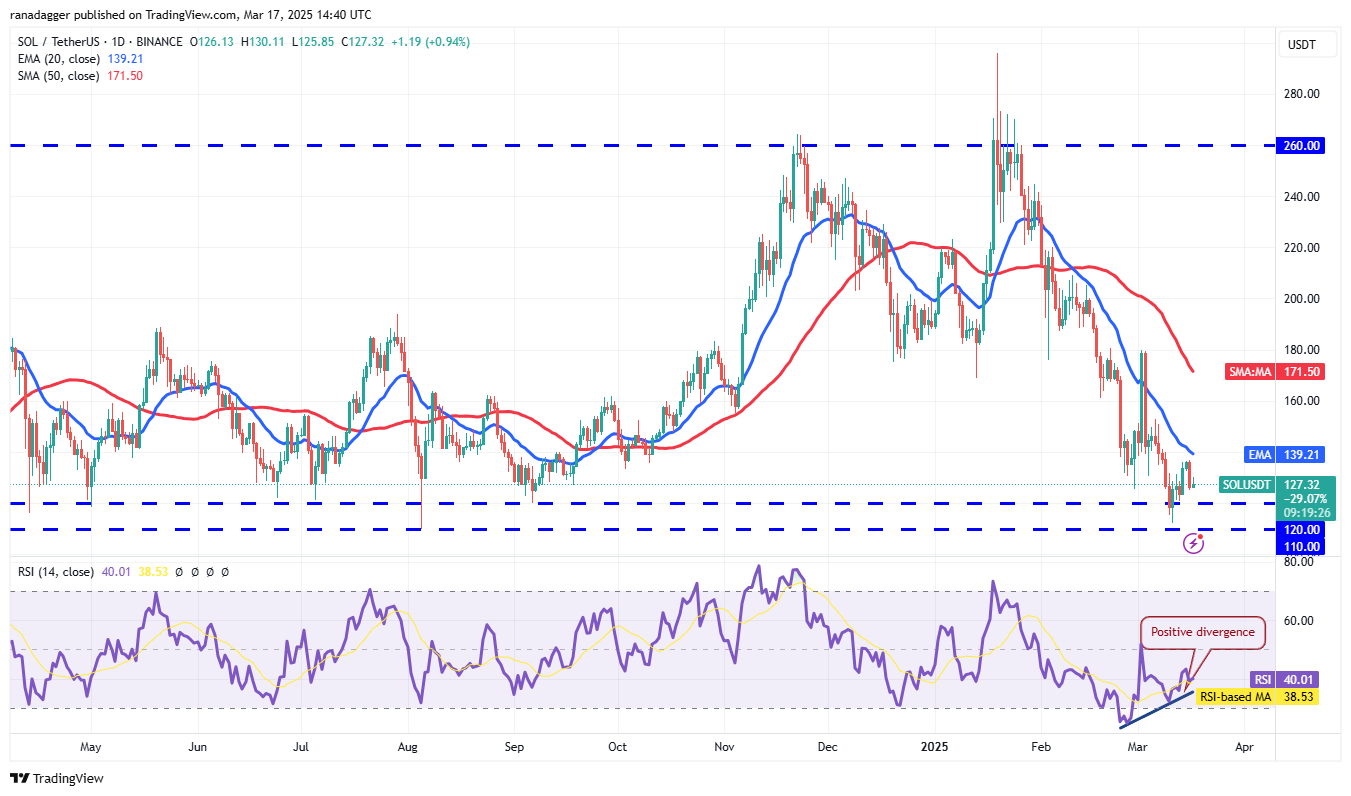
The SOL/USDT pair could decline to $120 and then $110, where buying support is anticipated. A rebound from this support zone could lead to another attempt to break above the 20-day EMA, potentially reaching $180. A continued decline below the support zone would invalidate this bullish scenario, potentially triggering a drop to $100 and then $80.
SOL/USDT對可能會降至120美元,然後降至110美元,預計購買支持。 從這個支持區的反彈可能會導致另一次超越20天EMA的嘗試,可能達到180美元。 在支持區以下的持續下降將使這種看漲的情況無效,這可能會導致下降到100美元,然後導致80美元。
Dogecoin Price Analysis
Dogecoin價格分析
Dogecoin (DOGE) is gradually approaching the 20-day EMA ($0.19), a key near-term resistance level.
Dogecoin(Doge)逐漸接近20天EMA(0.19美元),這是一個近期阻力水平的關鍵。
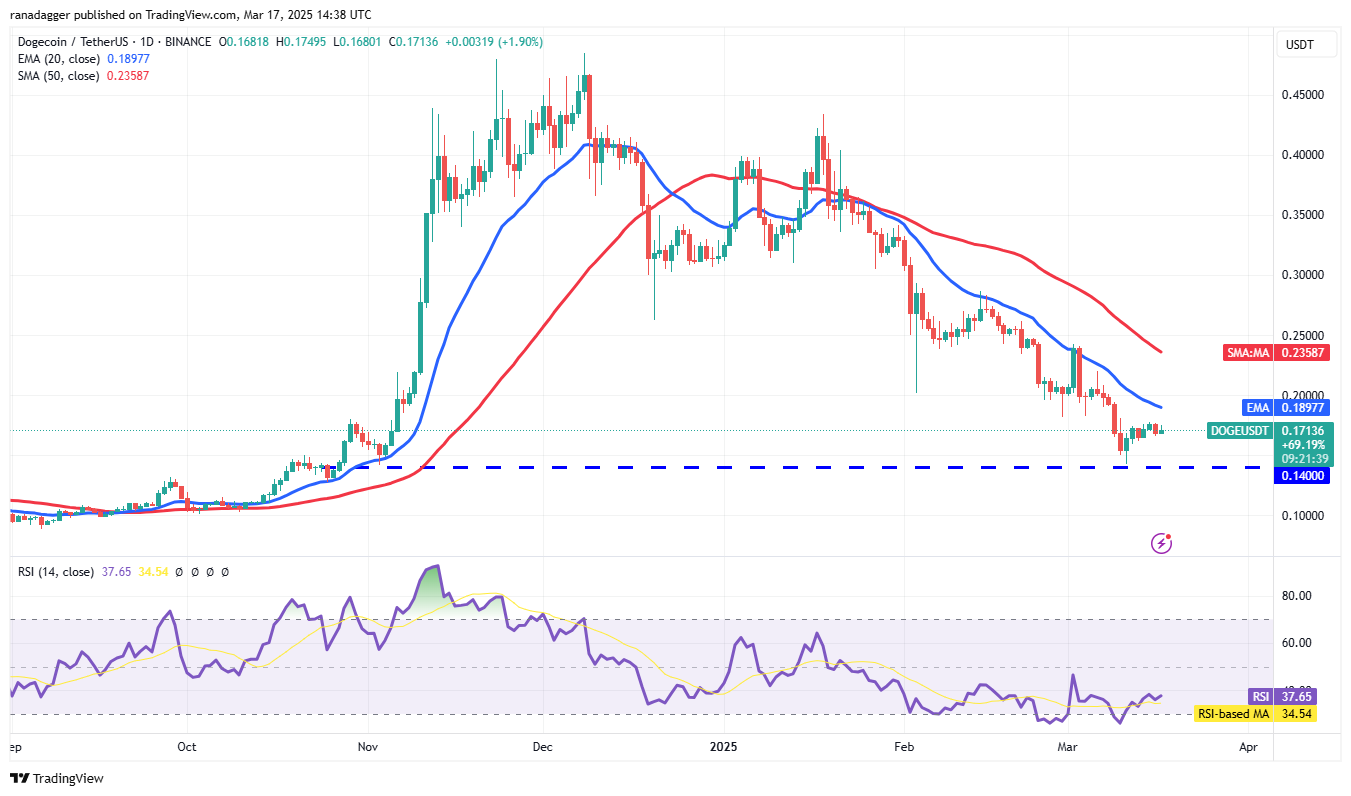
A sharp reversal from the 20-day EMA would suggest bearish selling on rallies, increasing the risk of a break below the $0.14 support and a potential decline to $0.10. Conversely, a break above the 20-day EMA would indicate reduced selling pressure, potentially leading to a rise to the 50-day SMA ($0.23) and then to $0.29. A close above $0.29 would signal strong buyer control.
與20天的EMA相比,急劇逆轉將表明對集會上的看跌銷售,從而將休息的風險降至0.14美元以下,並可能下降到0.10美元。 相反,超過20天EMA的休息時間將表明銷售壓力降低,可能導致50天SMA(0.23美元),然後升至0.29美元。 超過$ 0.29的收盤價將表示強大的買家控制。
Cardano Price Analysis
Cardano價格分析
Cardano (ADA) has traded below the 20-day EMA ($0.76) since March 8th, but the bears have failed to break the uptrend line, suggesting weakening selling pressure at lower levels.
自3月8日以來,Cardano(ADA)的交易低於20天EMA(0.76美元),但熊隊未能打破上升趨勢線,這表明較低水平的銷售壓力減弱。
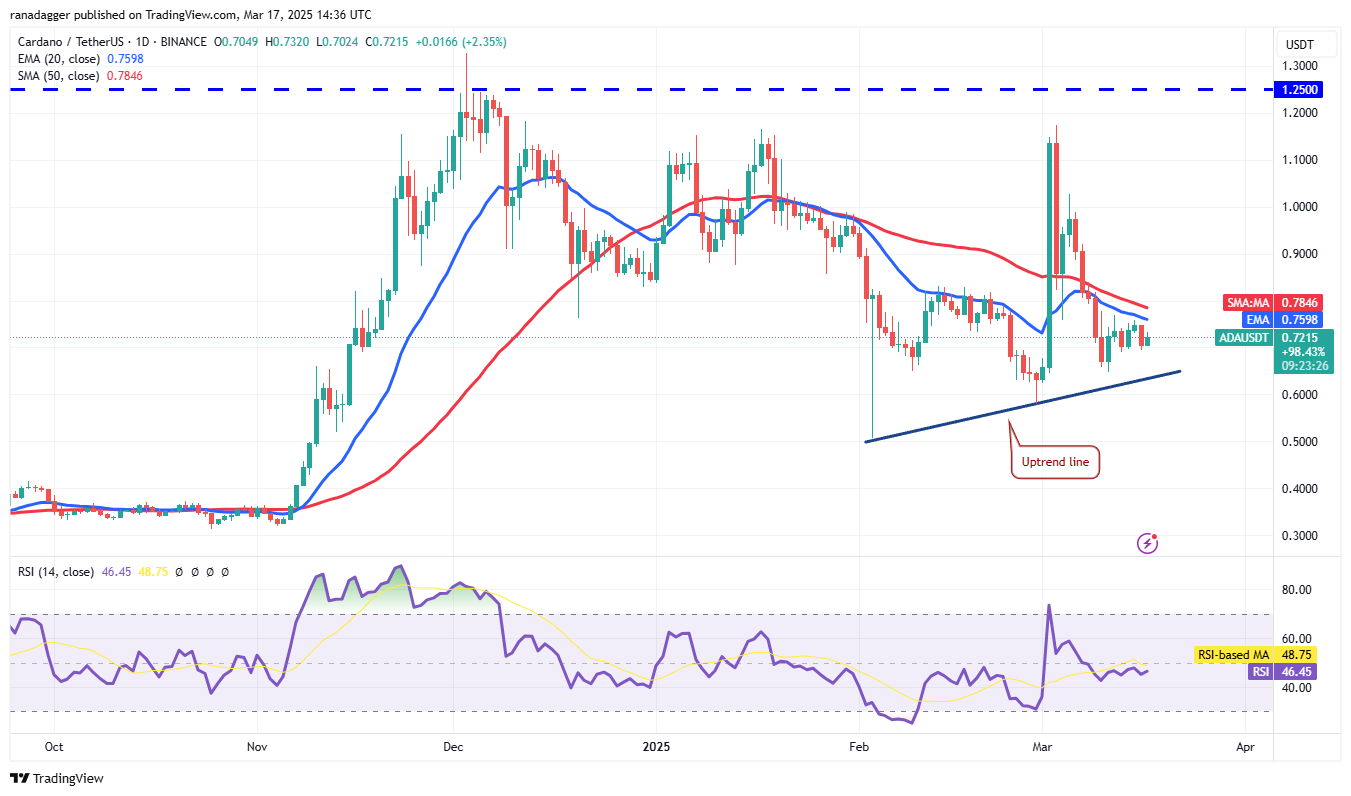
Buyers need to push the price above the moving averages for a sustained recovery, potentially reaching $1.02, where further bearish resistance is expected. A reversal from the moving averages would suggest continued bearish control, potentially leading to a drop below the uptrend line and a decline to $0.50.
買家需要將價格推到持續恢復的移動平均值上方,可能會達到1.02美元,預計會進一步看跌。 從移動的平均值中逆轉將表明持續的看跌控制,可能導致上升趨勢線以下,下降到0.50美元。
Pi Price Analysis
PI價格分析
Pi (PI) is gradually declining towards the $1.23 support level, where buying is anticipated.
PI(PI)逐漸下降到預計購買的1.23美元支持水平。
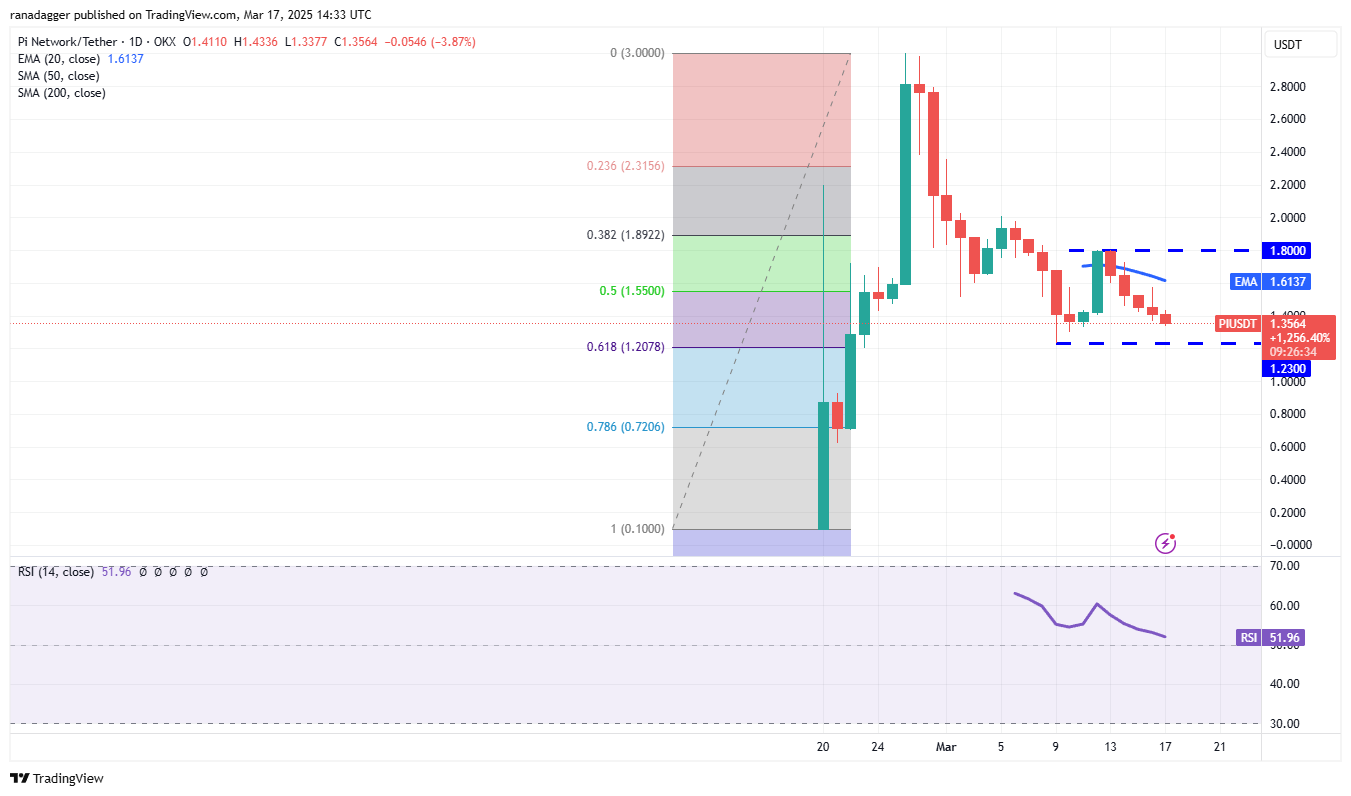
A strong rebound from $1.23 could push the PI/USDT pair back towards $1.80. While sellers are likely to challenge this level, a successful breakout could lead to a rally to $2 and then $2.35. A reversal from $1.80 would suggest range-bound trading between $1.23 and $1.80. A break below $1.23 would strengthen the bearish position, potentially leading to a decline to the 78.6% retracement level of $0.72.
從$ 1.23起的強勁反彈可以將PI/USDT對推回1.80美元。 儘管賣家可能會挑戰這一水平,但成功的突破可能會導致盧比達到2美元,然後$ 2.35。 從$ 1.80的逆轉將表明,範圍內的交易在1.23美元至1.80美元之間。 低於$ 1.23的休息時間將加強看跌地位,可能導致下降到78.6%的回收水平為0.72美元。
Disclaimer: This article does not provide financial advice. All investment and trading decisions involve risk, and readers should conduct their own thorough research.
免責聲明:本文不提供財務建議。所有投資和交易決策都涉及風險,讀者應進行自己的全面研究。
 DogeHome
 CFN
CFN Optimisus
 CFN
CFN U_Today


