

Cover image via U.Today
通過U.Today掩護圖像
A bearish pattern has recently appeared on the Dogecoin (DOGE) price chart against Bitcoin (BTC). A 23-day moving average has crossed below the 200-day moving average, forming a "death cross" – a bearish technical indicator.
最近在針對比特幣(BTC)的Dogecoin(Doge)價格表上出現了看跌模式。 一個23天的移動平均線超過200天移動平均線,形成了“死亡十字” - 看跌技術指標。
It's important to note this death cross occurs on a two-day timeframe for DOGE/BTC, a less commonly used chart setting. However, with the increasing use of algorithms and AI in cryptocurrency trading, even subtle shifts in timeframe analysis can offer valuable insights. 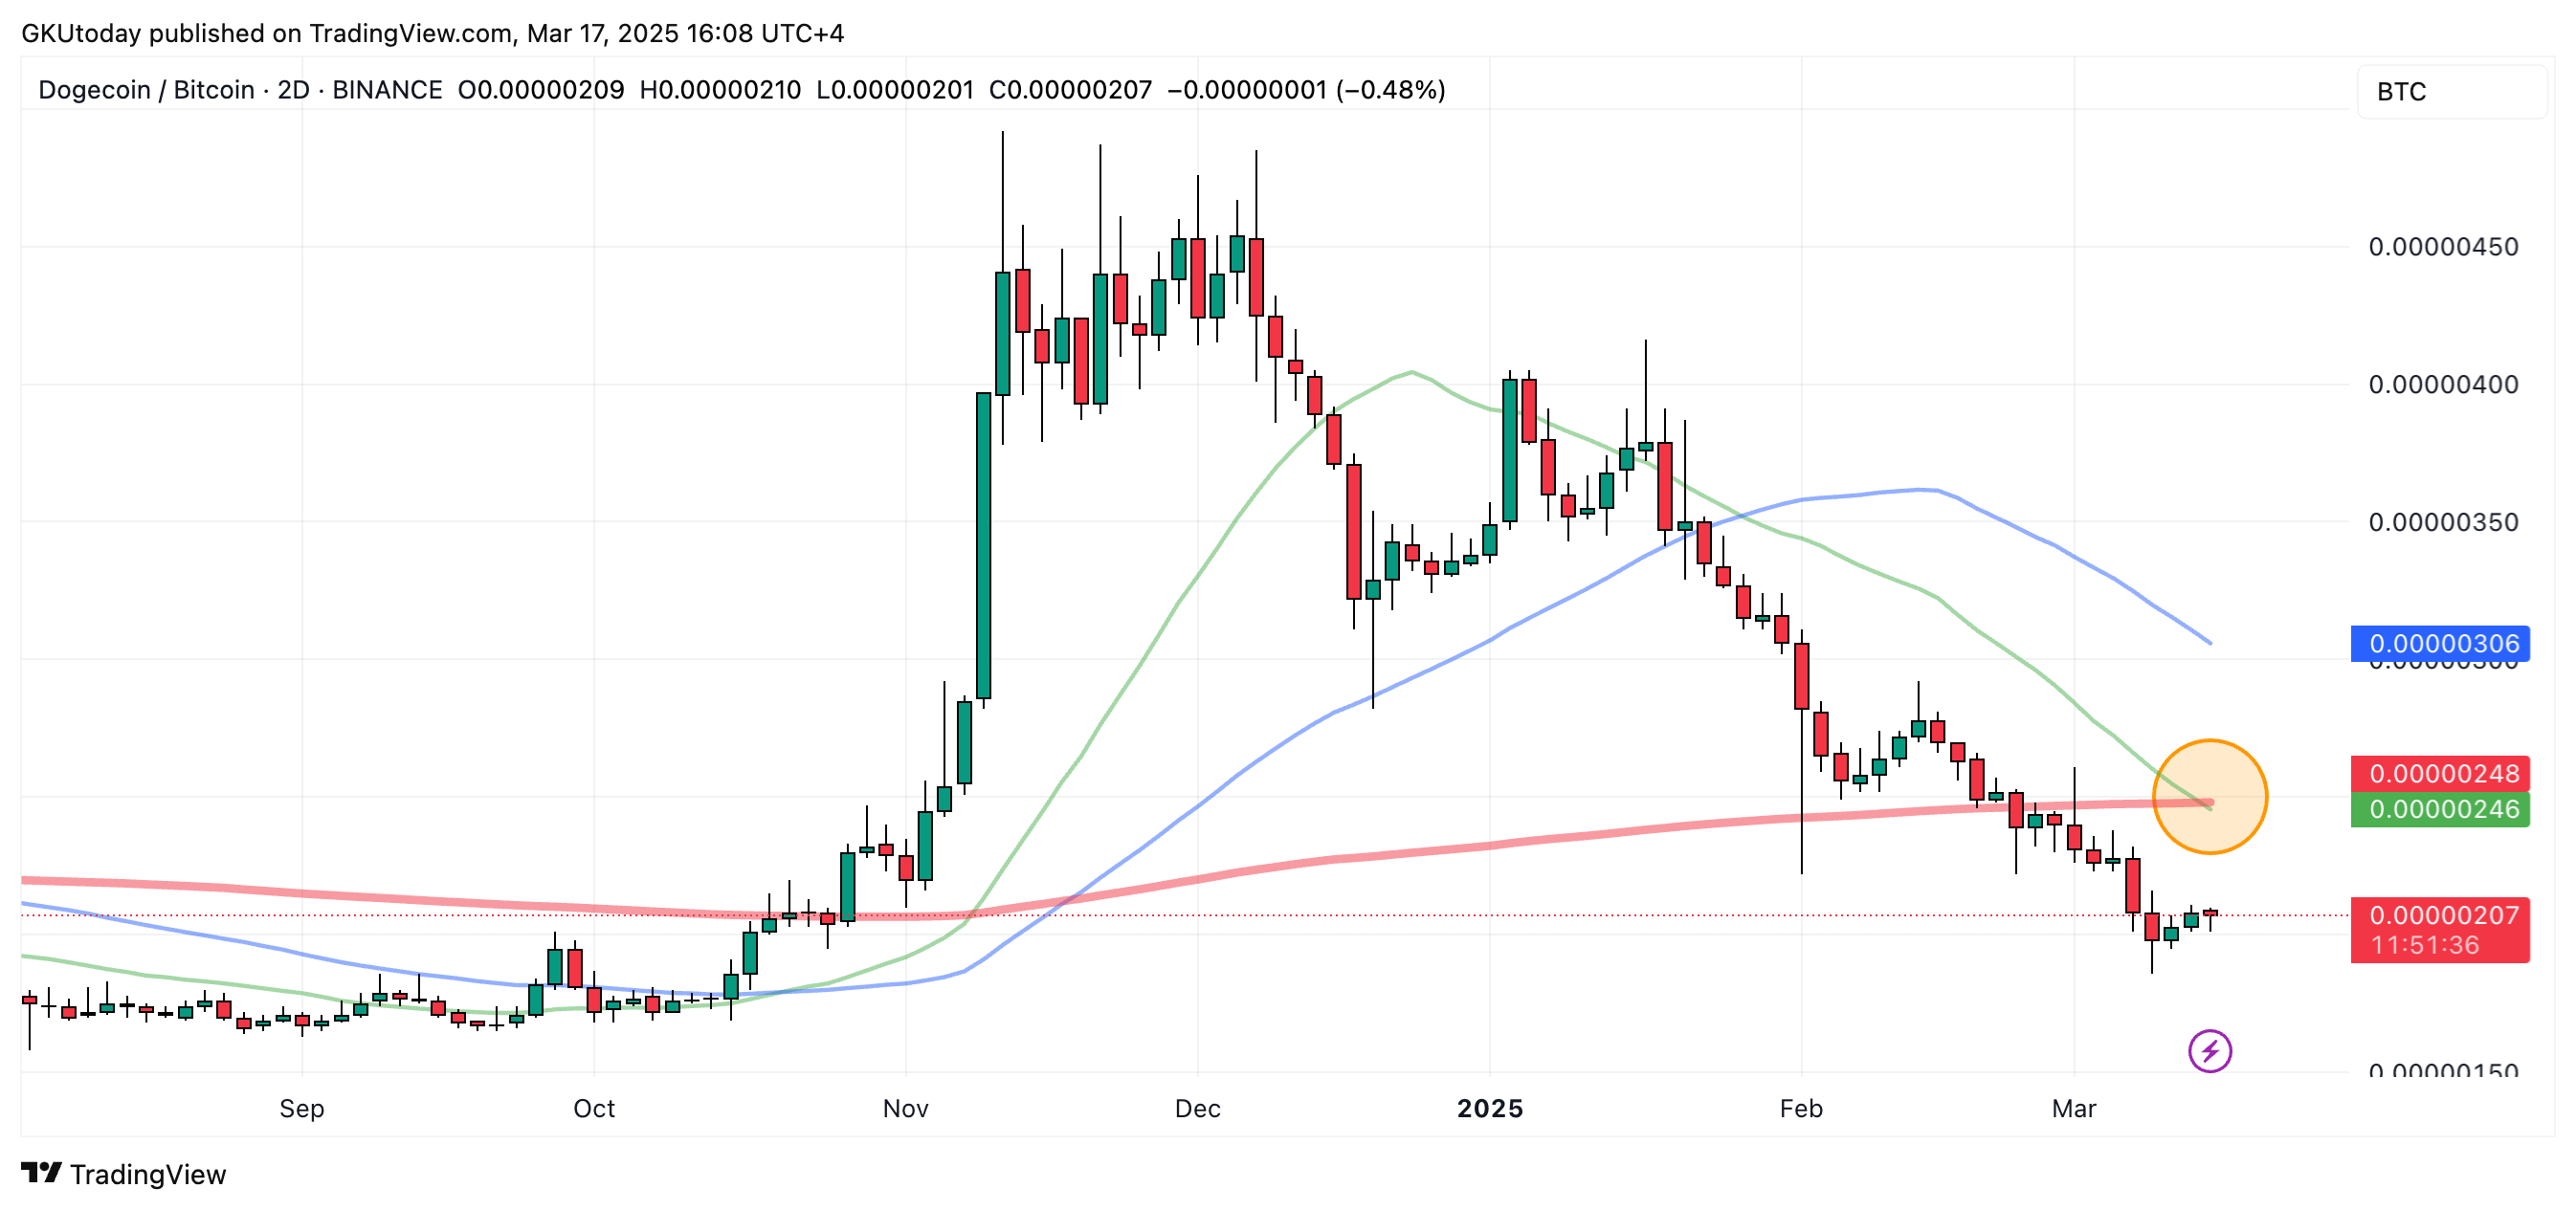 重要的是要注意此死亡十字架發生在Doge/BTC的為期兩天的時間範圍內,這是一個不常用的圖表設置。但是,隨著算法和AI在加密貨幣交易中的使用越來越多,時間範圍分析的微妙變化也可以提供有價值的見解。
This death cross suggests a potential correction for DOGE relative to BTC. Dogecoin has already seen a decline following the brief price surge around the U.S. elections. This new technical development could indicate continued underperformance against Bitcoin.
該死亡交叉表明,相對於BTC,Doge的潛在校正。 在美國大選周圍的短暫價格上漲之後,Dogecoin已經下降了。這種新的技術發展可能表明對比特幣的表現不佳。
If the overall market trends upward, DOGE may struggle to keep pace. A downward market correction could lead to even sharper declines relative to BTC.
如果總體市場趨勢向上趨勢,Doge可能會難以保持步伐。 下降的市場校正可能會導致相對於BTC的更高下降。
While technical indicators like the death cross aren't always definitive, especially on less conventional timeframes, they offer a valuable perspective for traders. This warrants cautious consideration. Read original article on U.Today
儘管像死亡十字架這樣的技術指標並不總是確定的,尤其是在較少的傳統時間表上,但它們為交易者提供了寶貴的觀點。 這需要謹慎考慮。閱讀有關U.Today的原始文章
 Optimisus
 CFN
CFN DogeHome
 U_Today
 Cryptopolitan
 Cointelegraph
 Crypto Daily™


