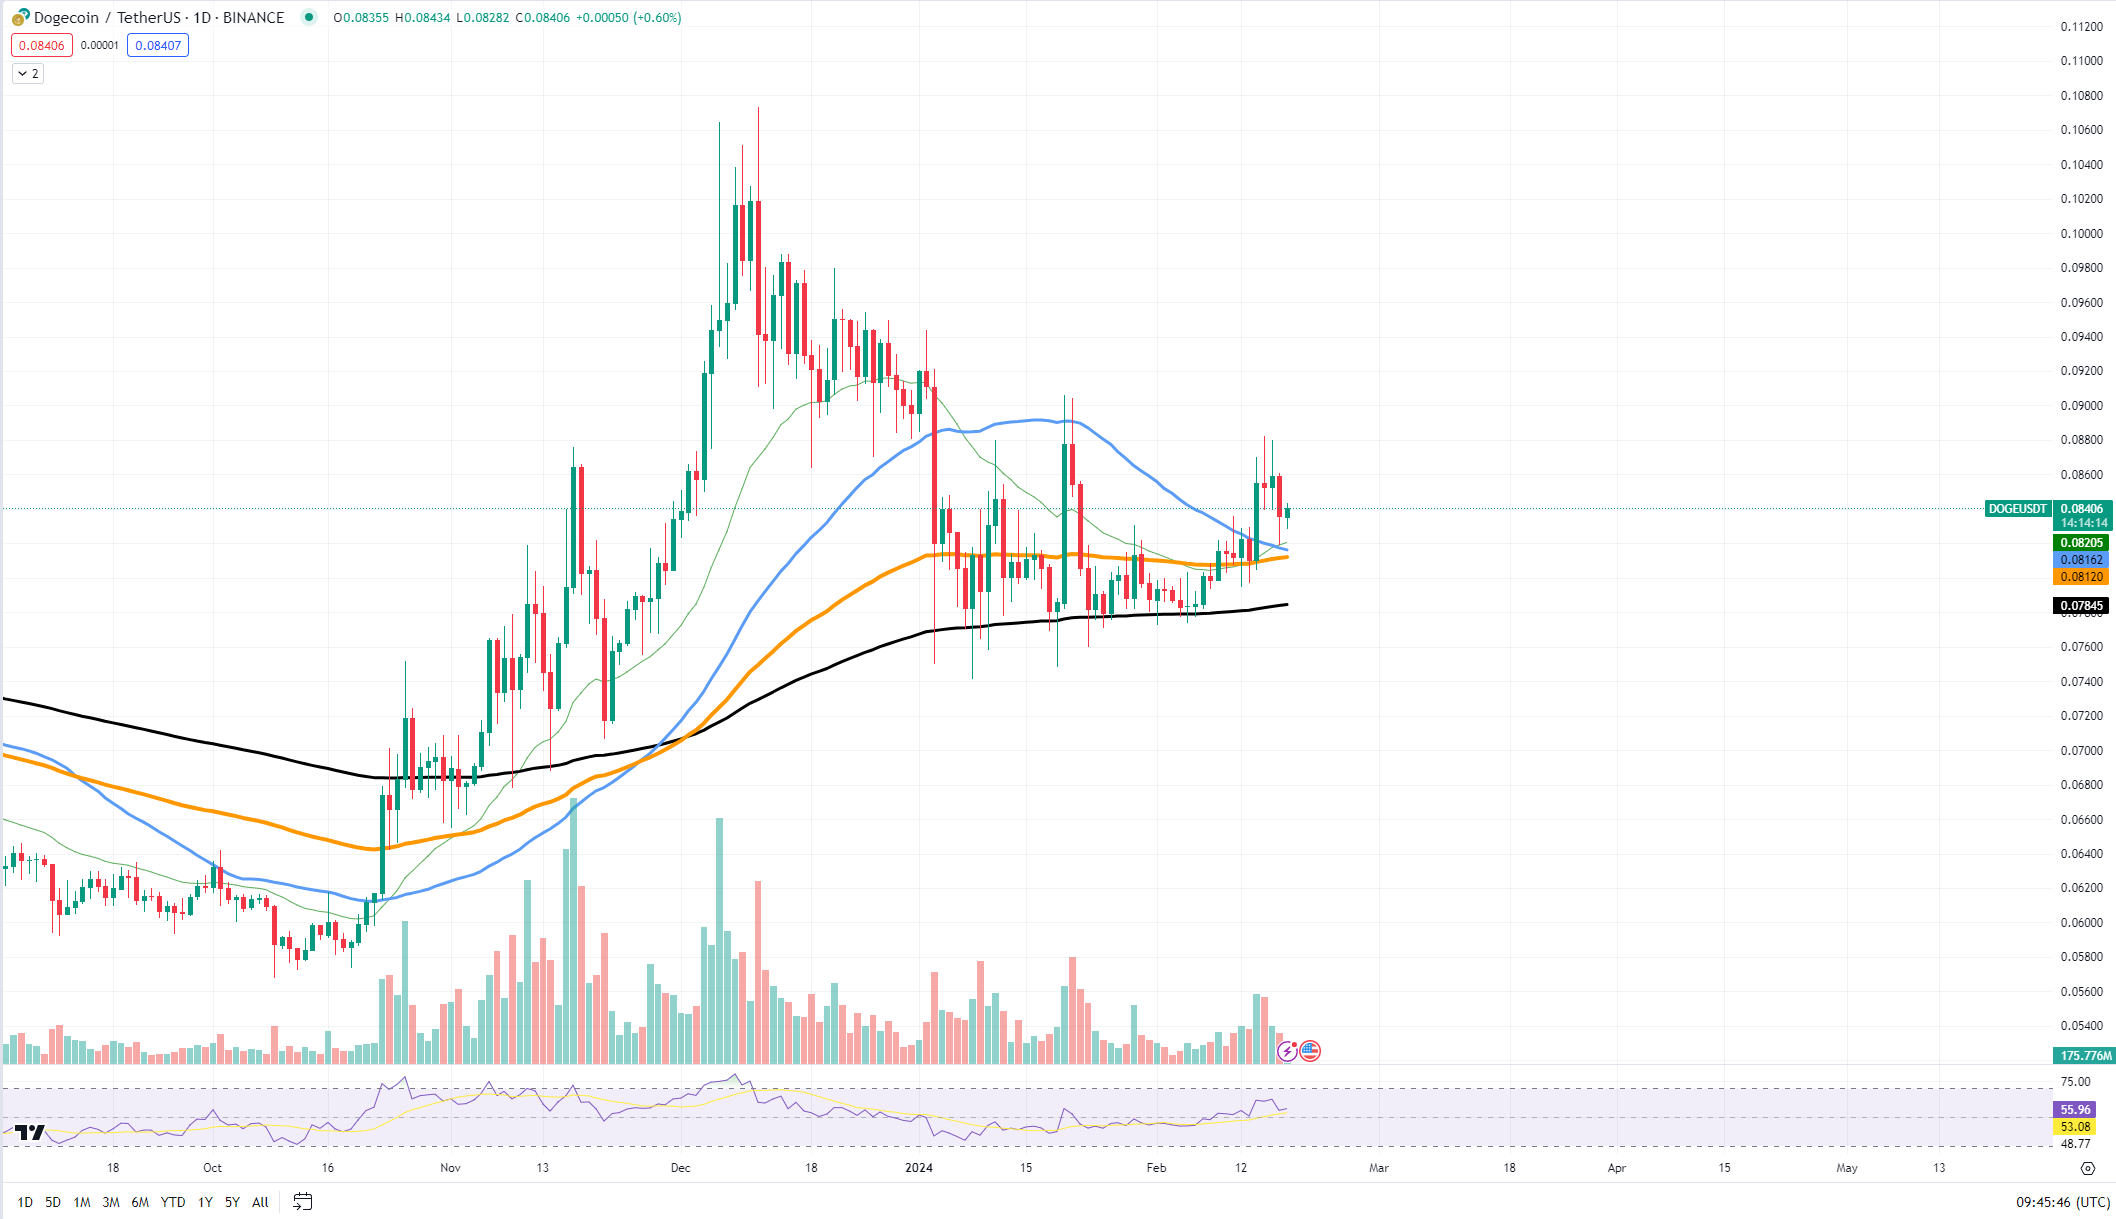
An approaching event on the technical charts is stirring up the sentiment around Dogecoin: the imminent cross of the 50-day and 100-day EMA. While EMA crosses are common technical events that can indicate trend shifts, they are not definitive price patterns and can sometimes lead to misinterpretations in the market.
기술 차트에 다가오는 이벤트는 50일 EMA와 100일 EMA의 교차가 임박한 Dogecoin 주변의 정서를 자극하고 있습니다. EMA 교차는 추세 변화를 나타낼 수 있는 일반적인 기술 이벤트이지만 확정적인 가격 패턴이 아니며 때로는 시장에서 잘못된 해석을 초래할 수 있습니다.
Currently, Dogecoin is flirting with this potential EMA cross, which could introduce volatility into the market. If the 50-day EMA crosses below the 100-day EMA, traditionally known as a "death cross," it might be perceived as a bearish signal, potentially leading to an increase in selling pressure. Conversely, if the 50-day EMA crosses above the 100-day EMA, often referred to as a "golden cross," it could be seen as a bullish indicator.
현재 Dogecoin은 시장에 변동성을 가져올 수 있는 잠재적인 EMA 교차를 시도하고 있습니다. 50일 EMA가 전통적으로 "데드 크로스"로 알려진 100일 EMA 아래로 교차하는 경우 이는 약세 신호로 인식되어 잠재적으로 매도 압력이 증가할 수 있습니다. 반대로, 50일 EMA가 100일 EMA(종종 "골든 크로스"라고 함)를 교차하면 강세 지표로 볼 수 있습니다.
 DOGE/USDT Chart by TradingView
TradingView의 DOGE/USDT 차트
Looking at the price chart, Dogecoin is holding above the key support level at $0.080. This level has acted as a strong foundation in recent times, and a sustained hold above it is crucial for maintaining the current trend.
가격 차트를 보면 Dogecoin은 $0.080의 주요 지원 수준을 유지하고 있습니다. 이 수준은 최근 강력한 기반 역할을 해왔으며, 현재 추세를 유지하려면 이 수준을 지속적으로 유지하는 것이 중요합니다.
On the upside, resistance is found near $0.0845, where previous attempts to push higher have been rejected. A decisive break above this resistance could pave the way for further growth, potentially leading to a test of the $0.090 psychological barrier.
반면, 저항은 $0.0845 근처에서 발견되었으며, 이전에 더 높이 올라가려는 시도가 거부되었습니다. 이 저항선을 확실히 돌파하면 추가 성장의 길을 열어 잠재적으로 심리적 장벽인 0.090달러를 시험할 수 있습니다.
Cardano new local high is around
Cardano의 새로운 지역 최고가가 다가오고 있습니다.
Cardano is edging closer to reclaiming its 2023 peak price levels. Currently, ADA is eyeing the $0.65 to $0.70 range, a zone that last year symbolized the pinnacle of its market value. Such an ascent not only boosts profitability for early investors but also enhances Cardano's allure as a promising asset within the crypto ecosystem.
Cardano는 2023년 최고 가격 수준 회복에 점점 더 가까워지고 있습니다. 현재 ADA는 지난해 시장 가치의 정점을 상징했던 0.65~0.70달러 범위를 주목하고 있습니다. 이러한 상승은 초기 투자자의 수익성을 높일 뿐만 아니라 암호화폐 생태계 내 유망 자산으로서 Cardano의 매력을 강화합니다.
The latest price movements of ADA reflect a robust momentum, with the token steadily climbing in value. The price action is decisively bullish, as it is now testing the resistance levels established in the previous year. A breakthrough above this range could signal a new era of confidence and growth for Cardano, potentially leading to an influx of investor interest and capital.
ADA의 최신 가격 변동은 토큰의 가치가 꾸준히 상승하는 강력한 모멘텀을 반영합니다. 현재 전년도에 설정된 저항 수준을 테스트하고 있기 때문에 가격 움직임은 결정적으로 강세입니다. 이 범위를 넘어서는 돌파구는 Cardano에 대한 자신감과 성장의 새로운 시대를 알리고 잠재적으로 투자자의 관심과 자본의 유입으로 이어질 수 있습니다.
The growth drivers for ADA are multifaceted and may stem from the continuous development of decentralized finance (DeFi) solutions on the Cardano network, as well as a general uptick in market sentiment toward altcoins.
ADA의 성장 동인은 다면적이며 Cardano 네트워크의 탈중앙화 금융(DeFi) 솔루션의 지속적인 개발과 알트코인에 대한 시장 정서의 전반적인 상승에서 비롯될 수 있습니다.
Solana's hidden potential
솔라나의 숨겨진 잠재력
Solana is currently displaying intriguing chart patterns that suggest hidden potential for growth. An inspection of SOL's price movement against Ethereum reveals what appears to be an inverse double bottom pattern, a formation typically associated with bullish reversals. This pattern, often seen as a signal of the end of a downtrend and the start of an upward trajectory, indicates that Solana might be gearing up for a significant rally.
솔라나는 현재 숨겨진 성장 잠재력을 암시하는 흥미로운 차트 패턴을 보여주고 있습니다. 이더리움에 대한 SOL의 가격 움직임을 조사한 결과 일반적으로 강세 반전과 관련된 형성인 역 이중 바닥 패턴으로 보이는 것이 드러났습니다. 종종 하락세의 끝과 상승 궤도의 시작을 나타내는 신호로 간주되는 이 패턴은 솔라나가 상당한 랠리를 준비하고 있음을 나타냅니다.
Despite the formation of a local double top, which some may interpret as a bearish signal, the broader interpretation of the chart suggests that this does not necessarily negate the bullish potential of the inverse double bottom. The double top may indeed introduce a level of resistance in the short term, but it does not outweigh the potential indicated by the double bottom.
일부에서는 약세 신호로 해석할 수 있는 국지적인 이중 천정이 형성되었음에도 불구하고, 차트를 더 폭넓게 해석하면 이것이 역 이중 바닥의 강세 잠재력을 반드시 무효화하는 것은 아니라는 점을 알 수 있습니다. 이중 천정은 실제로 단기적으로 일정 수준의 저항을 가져올 수 있지만 이중 바닥이 나타내는 잠재력보다 크지는 않습니다.
Currently, Solana is trading near a critical juncture where the 50-day moving average converges with a notable support level. This support is crucial for maintaining the bullish outlook and is found around the 0.0038 ETH mark. Should Solana hold above this level, it would confirm the strength of the support and could act as a springboard for further gains.
현재 솔라나는 50일 이동평균이 주목할 만한 지지 수준에 수렴하는 중요한 시점 근처에서 거래되고 있습니다. 이 지원은 강세 전망을 유지하는 데 중요하며 0.0038 ETH 표시 주변에서 발견됩니다. 솔라나가 이 수준 이상을 유지한다면 지지의 강도를 확인하고 추가 상승을 위한 발판 역할을 할 수 있습니다.
On the resistance side, the level to watch closely is at the 0.0040 ETH mark, aligning with the peak of the recent double top. A breakout above this resistance could validate the inverse double bottom pattern and set the stage for a stronger upward movement. The next key resistance would likely be at the 0.0042 ETH level, where previous attempts to advance were thwarted.
저항 측면에서 주목해야 할 수준은 0.0040 ETH 수준으로 최근 이중 천정의 정점과 일치합니다. 이 저항선을 돌파하면 역 이중 바닥 패턴이 확인되고 더 강한 상승세를 보일 수 있는 발판이 마련될 수 있습니다. 다음 주요 저항은 이전의 상승 시도가 좌절된 0.0042 ETH 수준일 가능성이 높습니다.


 Optimisus
 Optimisus
 Optimisus
 Thecryptoupdates
 DogeHome
 The Crypto Times
 Coincu
 Optimisus
 Coin_Gabbar


