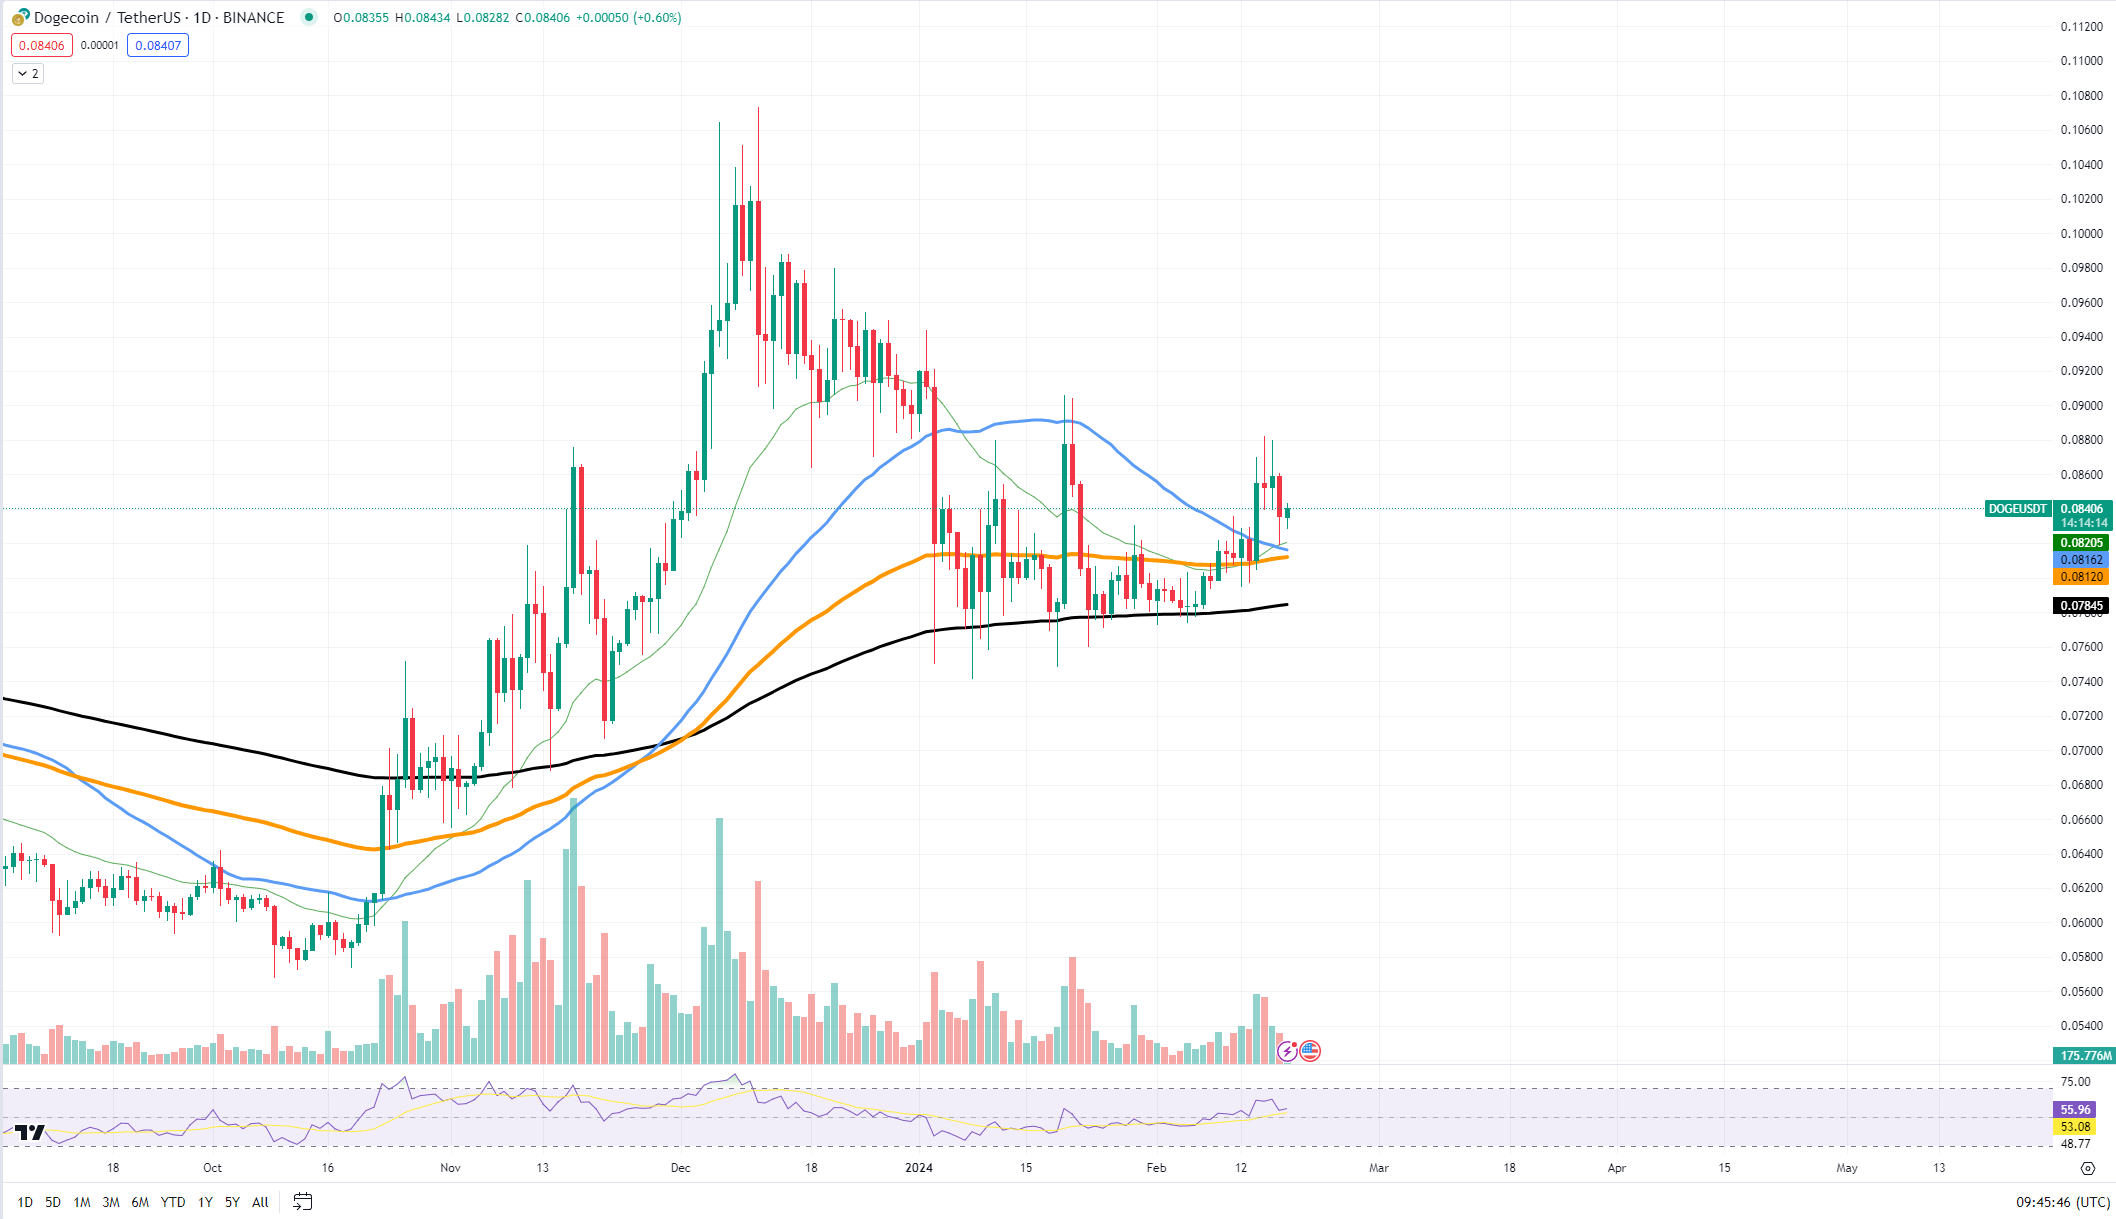
An approaching event on the technical charts is stirring up the sentiment around Dogecoin: the imminent cross of the 50-day and 100-day EMA. While EMA crosses are common technical events that can indicate trend shifts, they are not definitive price patterns and can sometimes lead to misinterpretations in the market.
技術圖表上即將發生的事件正在激起圍繞狗狗幣的情緒:50 日和 100 日均線即將交叉。雖然 EMA 交叉是可以表明趨勢轉變的常見技術事件,但它們並不是確定的價格模式,有時可能會導致市場誤解。
Currently, Dogecoin is flirting with this potential EMA cross, which could introduce volatility into the market. If the 50-day EMA crosses below the 100-day EMA, traditionally known as a "death cross," it might be perceived as a bearish signal, potentially leading to an increase in selling pressure. Conversely, if the 50-day EMA crosses above the 100-day EMA, often referred to as a "golden cross," it could be seen as a bullish indicator.
目前,狗狗幣正在考慮這種潛在的 EMA 交叉,這可能會為市場帶來波動。如果 50 日均線低於 100 日均線(傳統上稱為「死亡交叉」),則可能會被視為看跌訊號,可能導致拋售壓力增加。相反,如果 50 日均線突破 100 日均線(通常稱為“金叉”),則可被視為看漲指標。
 DOGE/USDT Chart by TradingView
DOGE/USDT 圖表(由 TradingView 提供)
Looking at the price chart, Dogecoin is holding above the key support level at $0.080. This level has acted as a strong foundation in recent times, and a sustained hold above it is crucial for maintaining the current trend.
從價格圖表來看,狗狗幣保持在關鍵支撐位 0.080 美元上方。該水平近來已成為堅實的基礎,持續保持在該水平之上對於維持當前趨勢至關重要。
On the upside, resistance is found near $0.0845, where previous attempts to push higher have been rejected. A decisive break above this resistance could pave the way for further growth, potentially leading to a test of the $0.090 psychological barrier.
上檔方面,阻力位於 0.0845 美元附近,先前的推高嘗試已被拒絕。果斷突破該阻力位可能為進一步上漲鋪平道路,並有可能測試 0.090 美元的心理關卡。
Cardano new local high is around
卡爾達諾新局部高點即將到來
Cardano is edging closer to reclaiming its 2023 peak price levels. Currently, ADA is eyeing the $0.65 to $0.70 range, a zone that last year symbolized the pinnacle of its market value. Such an ascent not only boosts profitability for early investors but also enhances Cardano's allure as a promising asset within the crypto ecosystem.
卡爾達諾正在接近恢復 2023 年的峰值價格水準。目前,ADA 的目標是 0.65 美元至 0.70 美元的區間,該區間去年象徵其市值的頂峰。這樣的上升不僅提高了早期投資者的獲利能力,還增強了卡爾達諾作為加密生態系統中一種有前途的資產的吸引力。
The latest price movements of ADA reflect a robust momentum, with the token steadily climbing in value. The price action is decisively bullish, as it is now testing the resistance levels established in the previous year. A breakthrough above this range could signal a new era of confidence and growth for Cardano, potentially leading to an influx of investor interest and capital.
ADA 的最新價格走勢反映了強勁的勢頭,代幣價值穩步攀升。價格走勢絕對是看漲的,因為它現在正在測試去年建立的阻力位。突破這一區間可能標誌著卡爾達諾進入了信心和成長的新時代,可能會導致投資者興趣和資本湧入。
The growth drivers for ADA are multifaceted and may stem from the continuous development of decentralized finance (DeFi) solutions on the Cardano network, as well as a general uptick in market sentiment toward altcoins.
ADA 的成長動力是多方面的,可能源自於卡爾達諾網路上去中心化金融(DeFi)解決方案的不斷發展,以及市場對山寨幣情緒的普遍上升。
Solana's hidden potential
Solana 的隱藏潛力
Solana is currently displaying intriguing chart patterns that suggest hidden potential for growth. An inspection of SOL's price movement against Ethereum reveals what appears to be an inverse double bottom pattern, a formation typically associated with bullish reversals. This pattern, often seen as a signal of the end of a downtrend and the start of an upward trajectory, indicates that Solana might be gearing up for a significant rally.
Solana 目前顯示出有趣的圖表模式,顯示隱藏的成長潛力。對 SOL 相對於以太坊的價格走勢的檢查顯示出似乎是反向雙底模式,這種形態通常與看漲逆轉相關。這種模式通常被視為下降趨勢結束和上升趨勢開始的信號,表明索拉納可能正在為大幅反彈做好準備。
Despite the formation of a local double top, which some may interpret as a bearish signal, the broader interpretation of the chart suggests that this does not necessarily negate the bullish potential of the inverse double bottom. The double top may indeed introduce a level of resistance in the short term, but it does not outweigh the potential indicated by the double bottom.
儘管形成了局部雙頂(有些人可能將其解釋為看跌信號),但對圖表的更廣泛解釋表明,這並不一定會否定反向雙底的看漲潛力。雙頂確實可能在短期內引入一定程度的阻力,但它不會超過雙底所顯示的潛力。
Currently, Solana is trading near a critical juncture where the 50-day moving average converges with a notable support level. This support is crucial for maintaining the bullish outlook and is found around the 0.0038 ETH mark. Should Solana hold above this level, it would confirm the strength of the support and could act as a springboard for further gains.
目前,Solana 交易接近 50 日移動平均線與顯著支撐位收斂的關鍵時刻。這項支撐對於維持看漲前景至關重要,位於 0.0038 ETH 關口附近。如果 Solana 守住這一水平,它將確認支撐的強度,並可能成為進一步上漲的跳板。
On the resistance side, the level to watch closely is at the 0.0040 ETH mark, aligning with the peak of the recent double top. A breakout above this resistance could validate the inverse double bottom pattern and set the stage for a stronger upward movement. The next key resistance would likely be at the 0.0042 ETH level, where previous attempts to advance were thwarted.
在阻力方面,需要密切注意的水平是 0.0040 ETH 關口,與近期雙頂的峰值一致。突破該阻力位可能會驗證反向雙底形態,並為更強勁的上漲奠定基礎。下一個關鍵阻力位可能是 0.0042 ETH 水平,先前的上漲嘗試均受挫。


 BlockchainReporter
 DogeHome
 Optimisus
 Optimisus
 Optimisus
 Thecryptoupdates
 The Crypto Times
 Coincu


