An approaching event on the technical charts is stirring up the sentiment around Dogecoin: the imminent cross of the 50-day and 100-day EMA. While EMA crosses are common technical events that can indicate trend shifts, they are not definitive price patterns and can sometimes lead to misinterpretations in the market.
テクニカルチャート上で近づいているイベント、つまり50日EMAと100日EMAの差し迫ったクロスがドージコインの周囲の感情をかき立てています。 EMA クロスはトレンドの変化を示す一般的なテクニカル イベントですが、決定的な価格パターンではなく、市場で誤解を招く可能性があります。
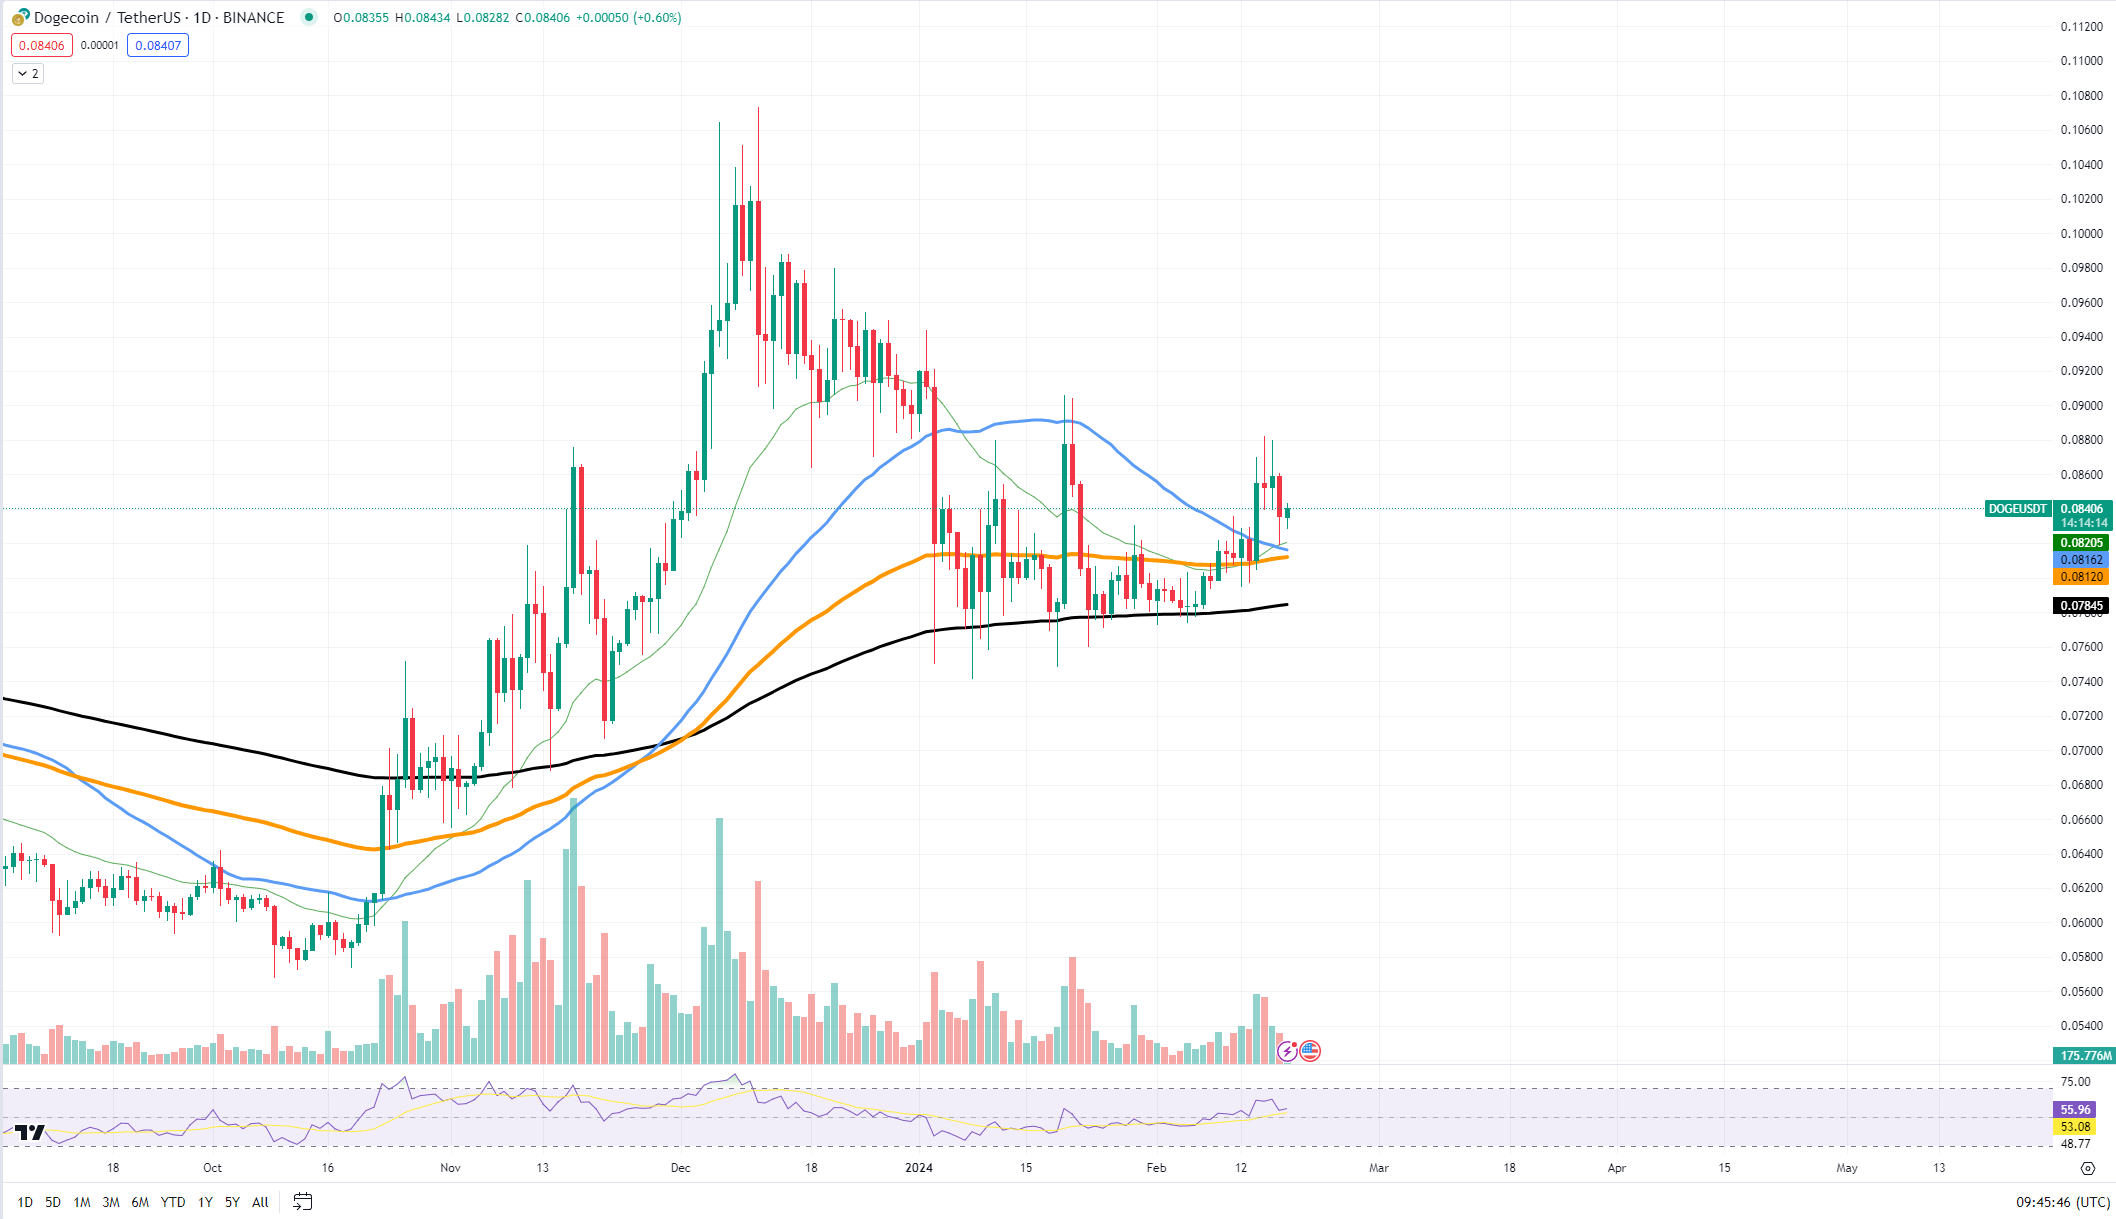
Currently, Dogecoin is flirting with this potential EMA cross, which could introduce volatility into the market. If the 50-day EMA crosses below the 100-day EMA, traditionally known as a "death cross," it might be perceived as a bearish signal, potentially leading to an increase in selling pressure. Conversely, if the 50-day EMA crosses above the 100-day EMA, often referred to as a "golden cross," it could be seen as a bullish indicator.
現在、ドージコインはこの潜在的なEMAクロスを狙っており、市場にボラティリティをもたらす可能性があります。 50日EMAが伝統的に「デスクロス」として知られる100日EMAを下回った場合、弱気シグナルとして認識される可能性があり、潜在的に売り圧力の増加につながる可能性があります。逆に、50 日 EMA が「ゴールデン クロス」と呼ばれる 100 日 EMA を上回った場合、それは強気の指標と見なされる可能性があります。
 DOGE/USDT Chart by TradingView
TradingViewによるDOGE/USDTチャート
Looking at the price chart, Dogecoin is holding above the key support level at $0.080. This level has acted as a strong foundation in recent times, and a sustained hold above it is crucial for maintaining the current trend.
価格チャートを見ると、ドージコインは0.080ドルの重要なサポートレベルを上回って維持されています。このレベルは最近強力な基盤として機能しており、現在のトレンドを維持するにはこのレベルを継続的に上回ることが重要です。
On the upside, resistance is found near $0.0845, where previous attempts to push higher have been rejected. A decisive break above this resistance could pave the way for further growth, potentially leading to a test of the $0.090 psychological barrier.
上値では、これまでの上昇の試みが拒否された0.0845ドル付近に抵抗線が見られる。この抵抗線を決定的に突破できれば、さらなる成長への道が開かれ、0.090ドルの心理的障壁が試される可能性がある。
Cardano new local high is around
カルダノの新たなローカル高値が近づいています
Cardano is edging closer to reclaiming its 2023 peak price levels. Currently, ADA is eyeing the $0.65 to $0.70 range, a zone that last year symbolized the pinnacle of its market value. Such an ascent not only boosts profitability for early investors but also enhances Cardano's allure as a promising asset within the crypto ecosystem.
カルダノは2023年のピーク価格水準の回復に少しずつ近づいている。現在、ADAは0.65ドルから0.70ドルの範囲に注目しているが、このゾーンは昨年市場価値の頂点を象徴していた。このような上昇は、初期投資家の収益性を高めるだけでなく、暗号通貨エコシステム内の有望な資産としてのカルダノの魅力を高めます。
The latest price movements of ADA reflect a robust momentum, with the token steadily climbing in value. The price action is decisively bullish, as it is now testing the resistance levels established in the previous year. A breakthrough above this range could signal a new era of confidence and growth for Cardano, potentially leading to an influx of investor interest and capital.
ADA の最新の価格動向は力強い勢いを反映しており、トークンの価値は着実に上昇しています。現在、前年に確立されたレジスタンスレベルを試しているため、価格動向は決定的に強気です。この範囲を超える突破は、カルダノにとって新たな自信と成長の時代を示す可能性があり、投資家の関心と資本の流入につながる可能性があります。
The growth drivers for ADA are multifaceted and may stem from the continuous development of decentralized finance (DeFi) solutions on the Cardano network, as well as a general uptick in market sentiment toward altcoins.
ADAの成長原動力は多面的であり、カルダノネットワーク上の分散型金融(DeFi)ソリューションの継続的な開発と、アルトコインに対する市場センチメントの全体的な上昇に起因する可能性があります。
Solana's hidden potential
ソラナの秘められた可能性
Solana is currently displaying intriguing chart patterns that suggest hidden potential for growth. An inspection of SOL's price movement against Ethereum reveals what appears to be an inverse double bottom pattern, a formation typically associated with bullish reversals. This pattern, often seen as a signal of the end of a downtrend and the start of an upward trajectory, indicates that Solana might be gearing up for a significant rally.
ソラナは現在、潜在的な成長の可能性を示唆する興味深いチャートパターンを示しています。イーサリアムに対するSOLの価格変動を検査すると、通常強気の反転に関連する形成である逆二重底パターンのように見えるものが明らかになります。このパターンは、下降トレンドの終わりと上昇軌道の始まりのシグナルとして見られることが多く、ソラナが大幅な上昇に向けて準備を整えている可能性があることを示しています。
Despite the formation of a local double top, which some may interpret as a bearish signal, the broader interpretation of the chart suggests that this does not necessarily negate the bullish potential of the inverse double bottom. The double top may indeed introduce a level of resistance in the short term, but it does not outweigh the potential indicated by the double bottom.
局所的なダブルトップの形成にもかかわらず、これを弱気のシグナルと解釈する人もいるかもしれないが、チャートをより広範に解釈すると、これが必ずしも逆ダブルボトムの強気の可能性を打ち消すわけではないことが示唆される。ダブルトップは確かに短期的にはあるレベルの抵抗を引き起こす可能性がありますが、それはダブルボトムによって示される可能性を上回るものではありません。
Currently, Solana is trading near a critical juncture where the 50-day moving average converges with a notable support level. This support is crucial for maintaining the bullish outlook and is found around the 0.0038 ETH mark. Should Solana hold above this level, it would confirm the strength of the support and could act as a springboard for further gains.
現在、ソラナは50日移動平均が注目すべきサポートレベルに収束する重要な岐路付近で取引されている。このサポートは強気の見通しを維持するために重要であり、0.0038 ETHマーク付近にあります。ソラナがこの水準を上回れば、サポートの強さが確認され、さらなる上昇への踏み台として機能する可能性がある。
On the resistance side, the level to watch closely is at the 0.0040 ETH mark, aligning with the peak of the recent double top. A breakout above this resistance could validate the inverse double bottom pattern and set the stage for a stronger upward movement. The next key resistance would likely be at the 0.0042 ETH level, where previous attempts to advance were thwarted.
抵抗面では、注意深く監視すべきレベルは0.0040 ETHマークにあり、最近のダブルトップのピークと一致しています。このレジスタンスを上抜ければ、逆ダブルボトムパターンが検証され、より強い上昇への準備が整う可能性があります。次の主要な抵抗線はおそらく 0.0042 ETH レベルであり、以前の上昇の試みは阻止されました。


 BlockchainReporter
 Optimisus
 TheCoinrise Media
 DogeHome
 Optimisus
 BlockchainReporter
 Optimisus
 Thecoinrepublic.com
 TheCoinrise Media


