- DOGE’s price increased by double digits in the last week.
- Technical indicators hinted at the possibility of a price swing in either direction.
Leading meme coin Dogecoin [DOGE] may experience headwinds this week as volatility markers hinted at the possibility of significant short-term price swings.
DOGE의 가격은 지난 주 두 자릿수 상승했습니다. 기술적 지표는 어느 방향으로든 가격 변동 가능성을 암시했습니다. 선두적인 밈 코인인 Dogecoin [DOGE]은 변동성 지표가 상당한 단기 가격 가능성을 암시함에 따라 이번 주 역풍을 경험할 수 있습니다. 그네.
At press time, DOGE was trading at $0.207. According to CoinMarketCap’s data, its price has increased by 20% in the last week.
보도 당시 DOGE는 $0.207에 거래되었습니다. CoinMarketCap의 데이터에 따르면 지난주 가격이 20% 상승했습니다.
However, with rising volatility in its market, the meme coin may shed some of these gains.
그러나 시장의 변동성이 증가함에 따라 밈 코인은 이러한 이익 중 일부를 잃을 수 있습니다.
Price swings on the horizon
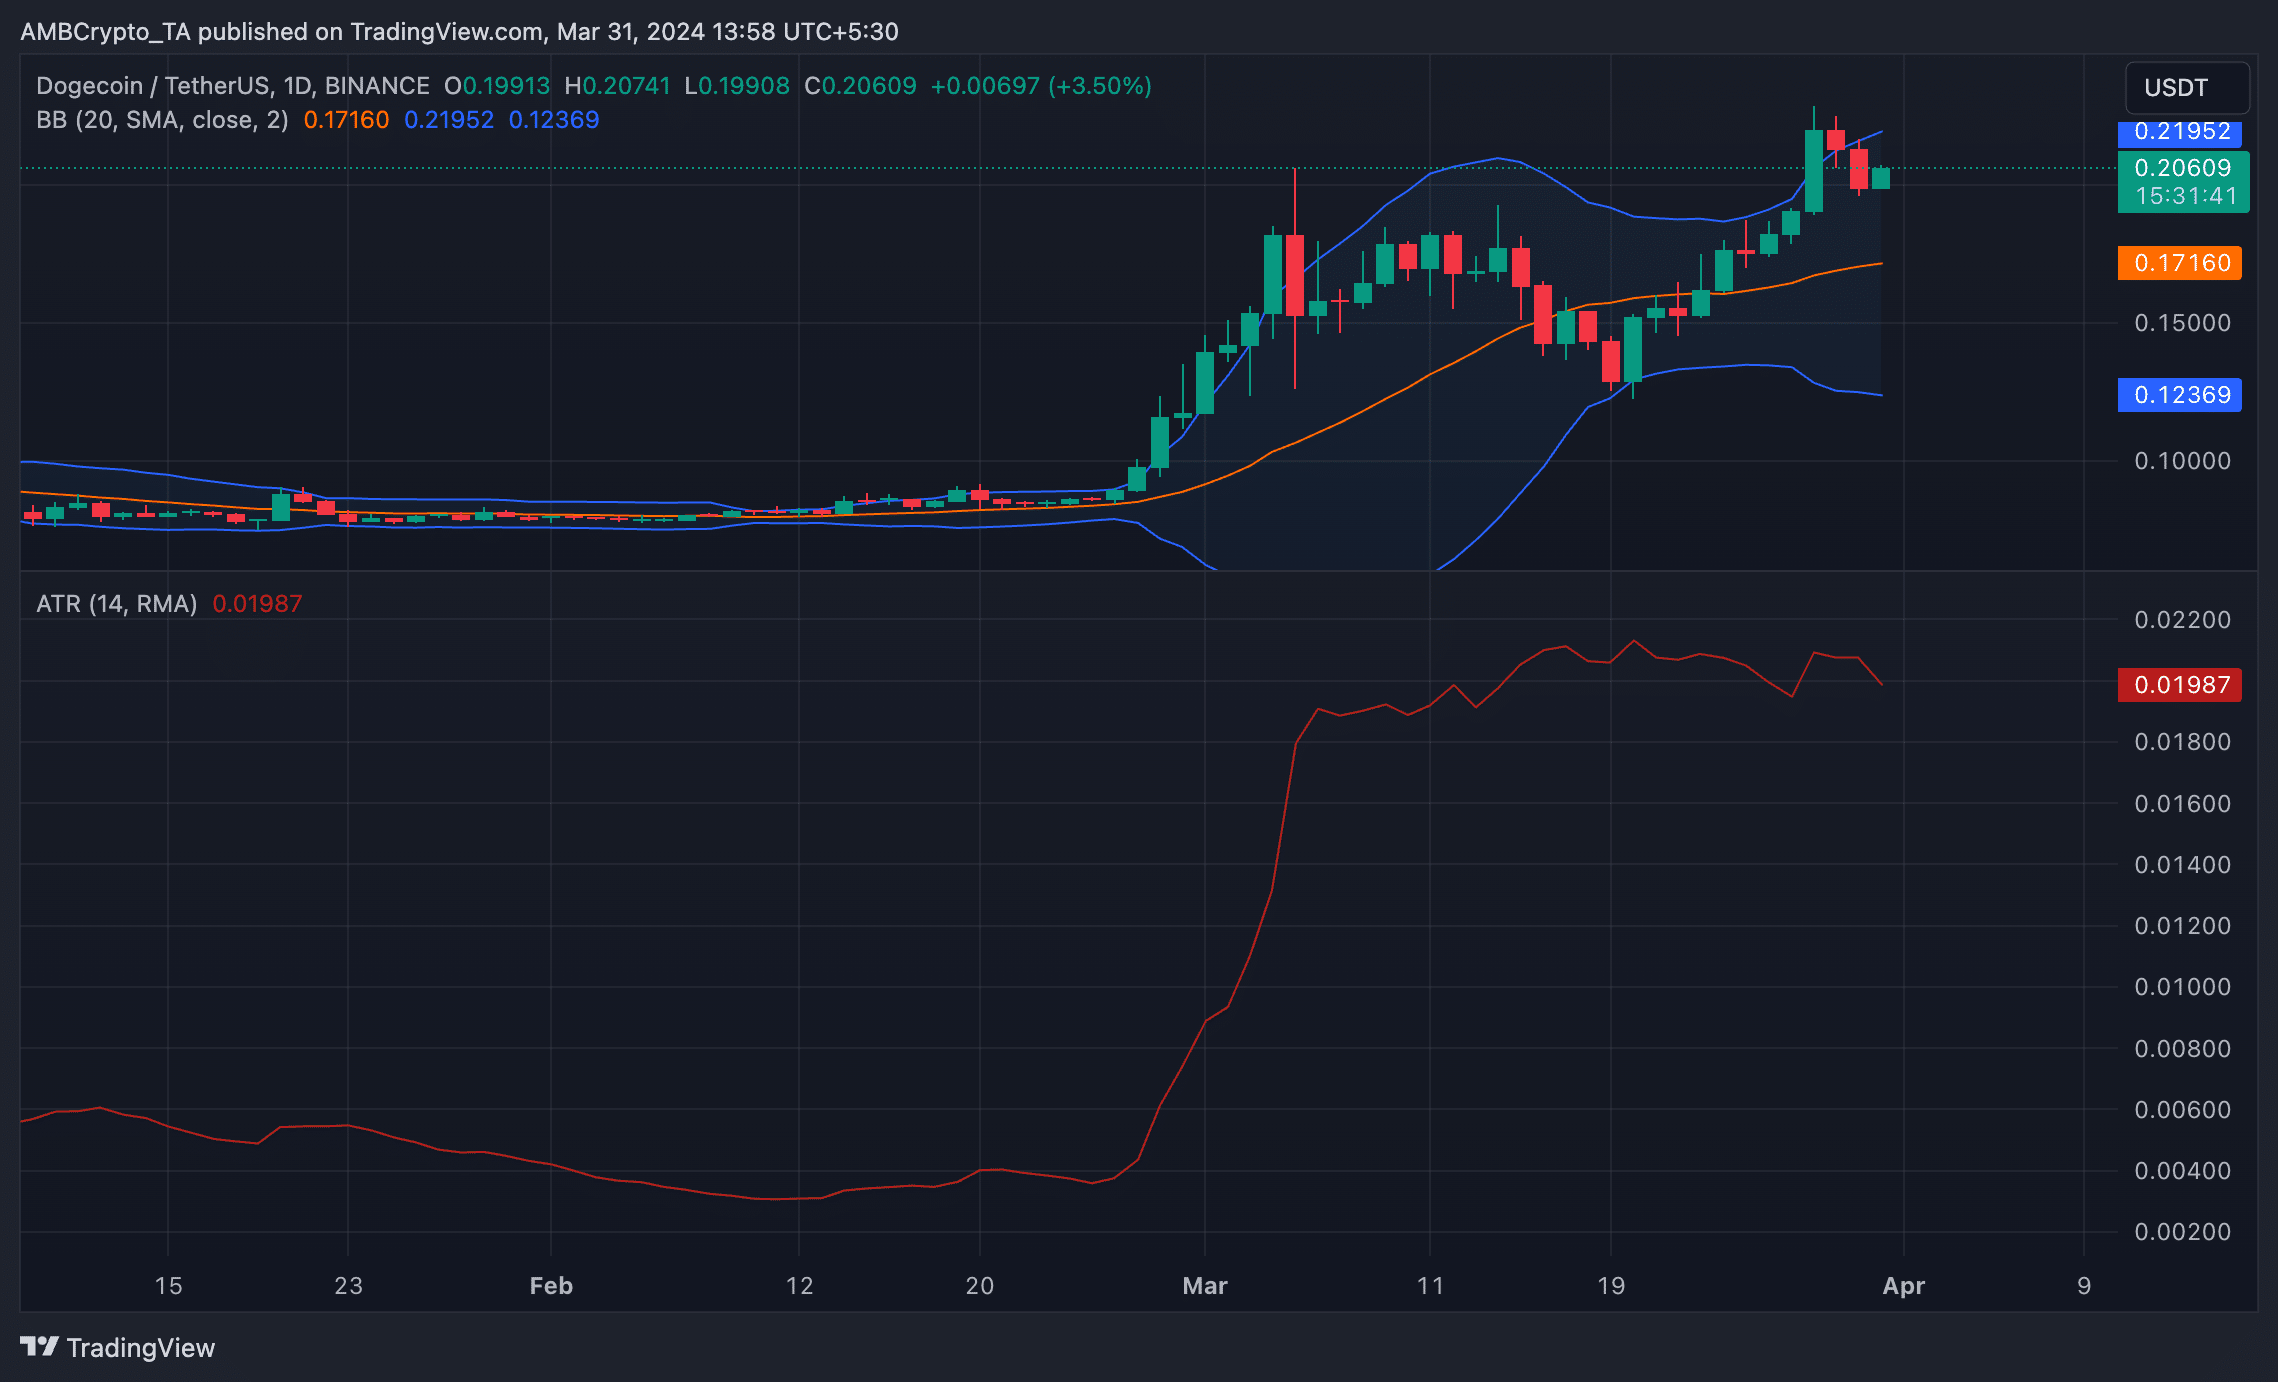
AMBCrypto assessed the coin’s Bollinger Bands (BB) on a one-day chart and found that the gap between the indicator’s upper and lower bands has steadily widened since the 27th of March.
지평선 위의 가격 변동AMBCrypto는 1일 차트에서 코인의 볼린저 밴드(BB)를 평가한 결과 지표의 상단 밴드와 하단 밴드 사이의 격차가 3월 27일 이후 꾸준히 넓어지고 있음을 발견했습니다.
This indicator gauges an asset’s market volatility and potential price movements. When the gap between its lower and upper bands widens, it indicates an increase in volatility.
이 지표는 자산의 시장 변동성과 잠재적 가격 변동을 측정합니다. 하단 밴드와 상단 밴드 사이의 간격이 넓어지면 변동성이 증가한다는 의미입니다.
The gap may widen for several reasons, one of which is increased trading volume. According to Santiment’s data, DOGE’s trading volume climbed to a weekly high of $7 billion on the 28th of March.
여러 가지 이유로 격차가 확대될 수 있으며 그 중 하나는 거래량 증가입니다. Santiment의 데이터에 따르면 DOGE의 거래량은 3월 28일에 주간 최고치인 70억 달러로 증가했습니다.
During periods of band expansion, traders are on the lookout for price breakouts in either direction.
밴드 확장 기간 동안 거래자들은 어느 방향으로든 가격 돌파를 예의주시하고 있습니다.
Further confirming the possibility of a market swing, the value of DOGE’s Average True has risen by 5% in the past three days.
시장 변동 가능성을 더욱 확인시켜 주는 DOGE의 Average True 값은 지난 3일 동안 5% 상승했습니다.
This indicator measures market volatility by calculating the average range between high and low prices over a specified number of periods.
이 지표는 지정된 기간 동안 최고 가격과 최저 가격 사이의 평균 범위를 계산하여 시장 변동성을 측정합니다.
When it rises in this manner, it suggests that the price swings are becoming more significant.
이런 식으로 상승하면 가격 변동이 더욱 중요해지고 있음을 의미합니다.
The bulls remain in control
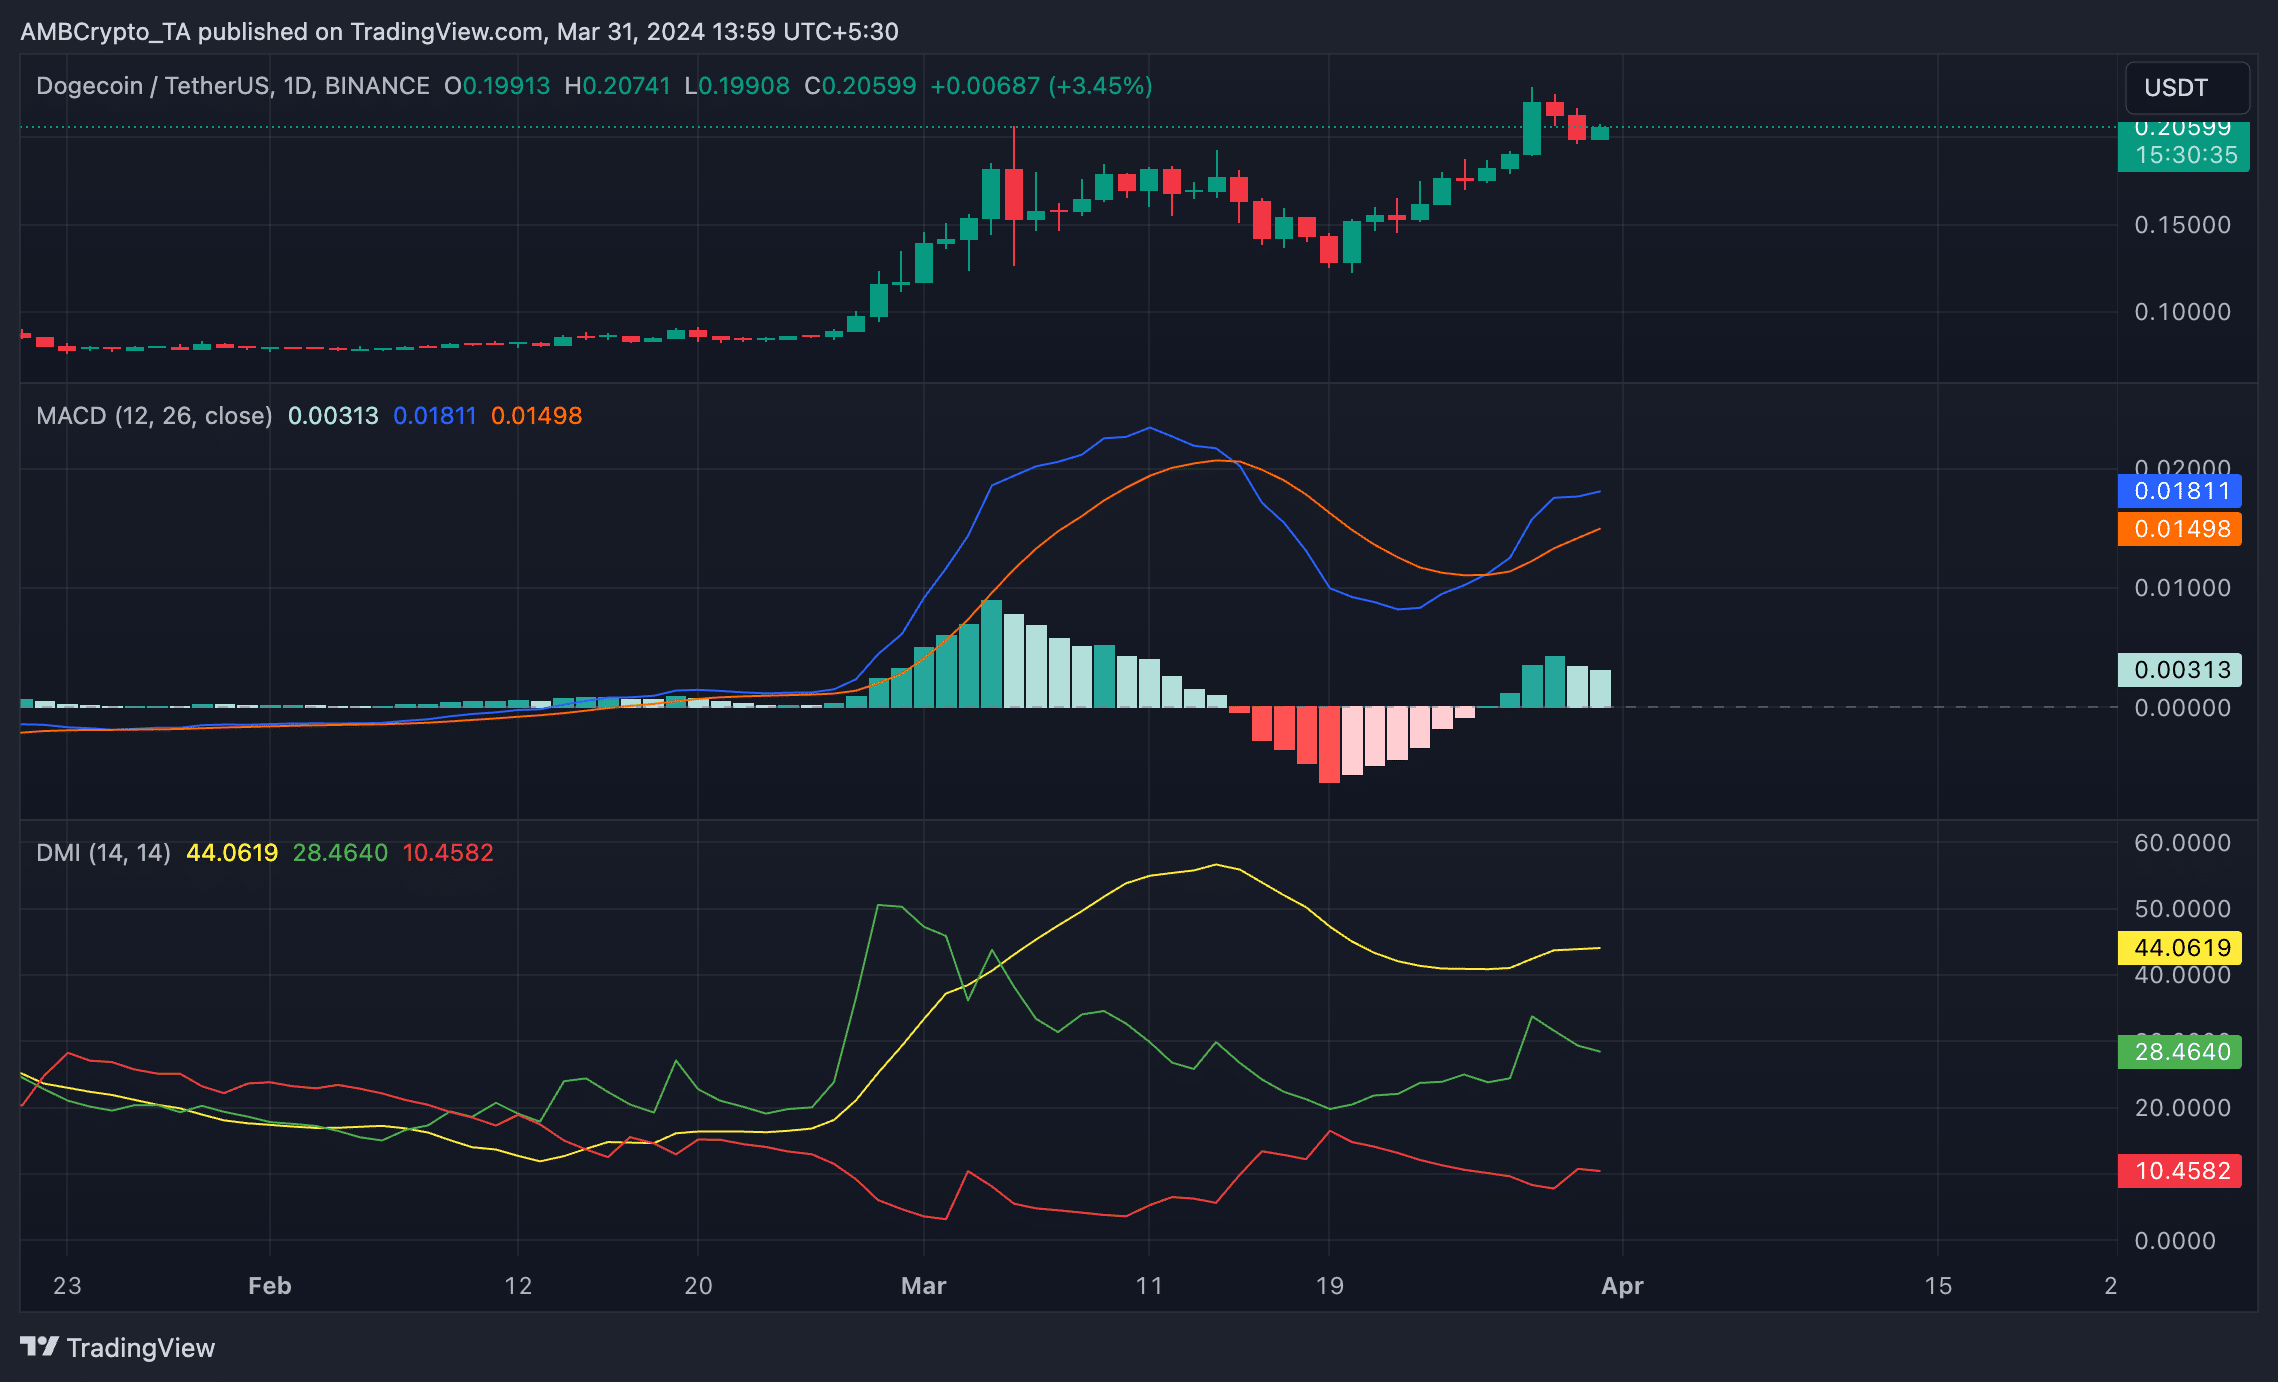
While volatility markers hint at the possibility of price swings in the coming days, DOGE’s Directional Movement Index (DMI) and Moving Average Convergence/Divergence indicators showed that bullish sentiments exceeded bearish activity.
강세는 여전히 통제되고 있습니다. 변동성 지표가 향후 가격 변동 가능성을 암시하는 반면, DOGE의 방향 이동 지수(DMI) 및 이동 평균 수렴/발산 지표는 강세 정서가 약세 활동을 능가하는 것으로 나타났습니다.
Readings from the coin’s Directional Movement Index (DMI) showed the positive directional index above the negative index.
동전의 방향 이동 지수(DMI)를 판독한 결과 음수 지수보다 양수 방향 지수가 높은 것으로 나타났습니다.
When these lines are positioned this way, it means that the strength of the prevailing bullish trend is higher than the strength of any potential downward price movement.
이러한 선이 이런 식으로 배치되면 지배적인 강세 추세의 강도가 잠재적인 가격 하락 움직임의 강도보다 높다는 것을 의미합니다.
Read Dogecoin’s [DOGE] Price Prediction 2024-25
Dogecoin의 [DOGE] 2024-25 가격 예측 읽기
Likewise, DOGE’s MACD line crossed above the signal line on the 26th of March and has since been positioned this way.
마찬가지로 DOGE의 MACD 선은 3월 26일에 신호선을 교차한 이후 이런 방향으로 위치했습니다.
An upward intersection of the MACD line with the signal line is a bullish sign, often indicating a rise in buying pressure.
MACD 선과 신호선의 상향 교차점은 강세 신호로, 종종 매수 압력이 상승함을 나타냅니다.
다음: 이더리움의 최근 '하락' – ETH에 대한 낙관론을 유지해야 합니까? 공유공유트윗


 CoinPedia News
 TheCoinrise Media
 DogeHome
 BH NEWS
 COINTURK NEWS
 BlockchainReporter
 Crypto News Land
 Cryptopolitan_News
 CryptoPotato_News


