- DOGE’s price increased by double digits in the last week.
- Technical indicators hinted at the possibility of a price swing in either direction.
Leading meme coin Dogecoin [DOGE] may experience headwinds this week as volatility markers hinted at the possibility of significant short-term price swings.
DOGEの価格は先週2桁上昇しました。テクニカル指標は、いずれかの方向に価格が変動する可能性を示唆しました。主要なミームコインであるドージコイン[DOGE]は、ボラティリティマーカーが短期的に大幅な価格上昇の可能性を示唆しているため、今週逆風に見舞われる可能性がありますスイング。
At press time, DOGE was trading at $0.207. According to CoinMarketCap’s data, its price has increased by 20% in the last week.
記事執筆時点では、DOGEは0.207ドルで取引されていました。 CoinMarketCapのデータによると、先週その価格は20%上昇しました。
However, with rising volatility in its market, the meme coin may shed some of these gains.
しかし、市場のボラティリティの上昇により、ミームコインはこれらの利益の一部を失う可能性があります。
Price swings on the horizon
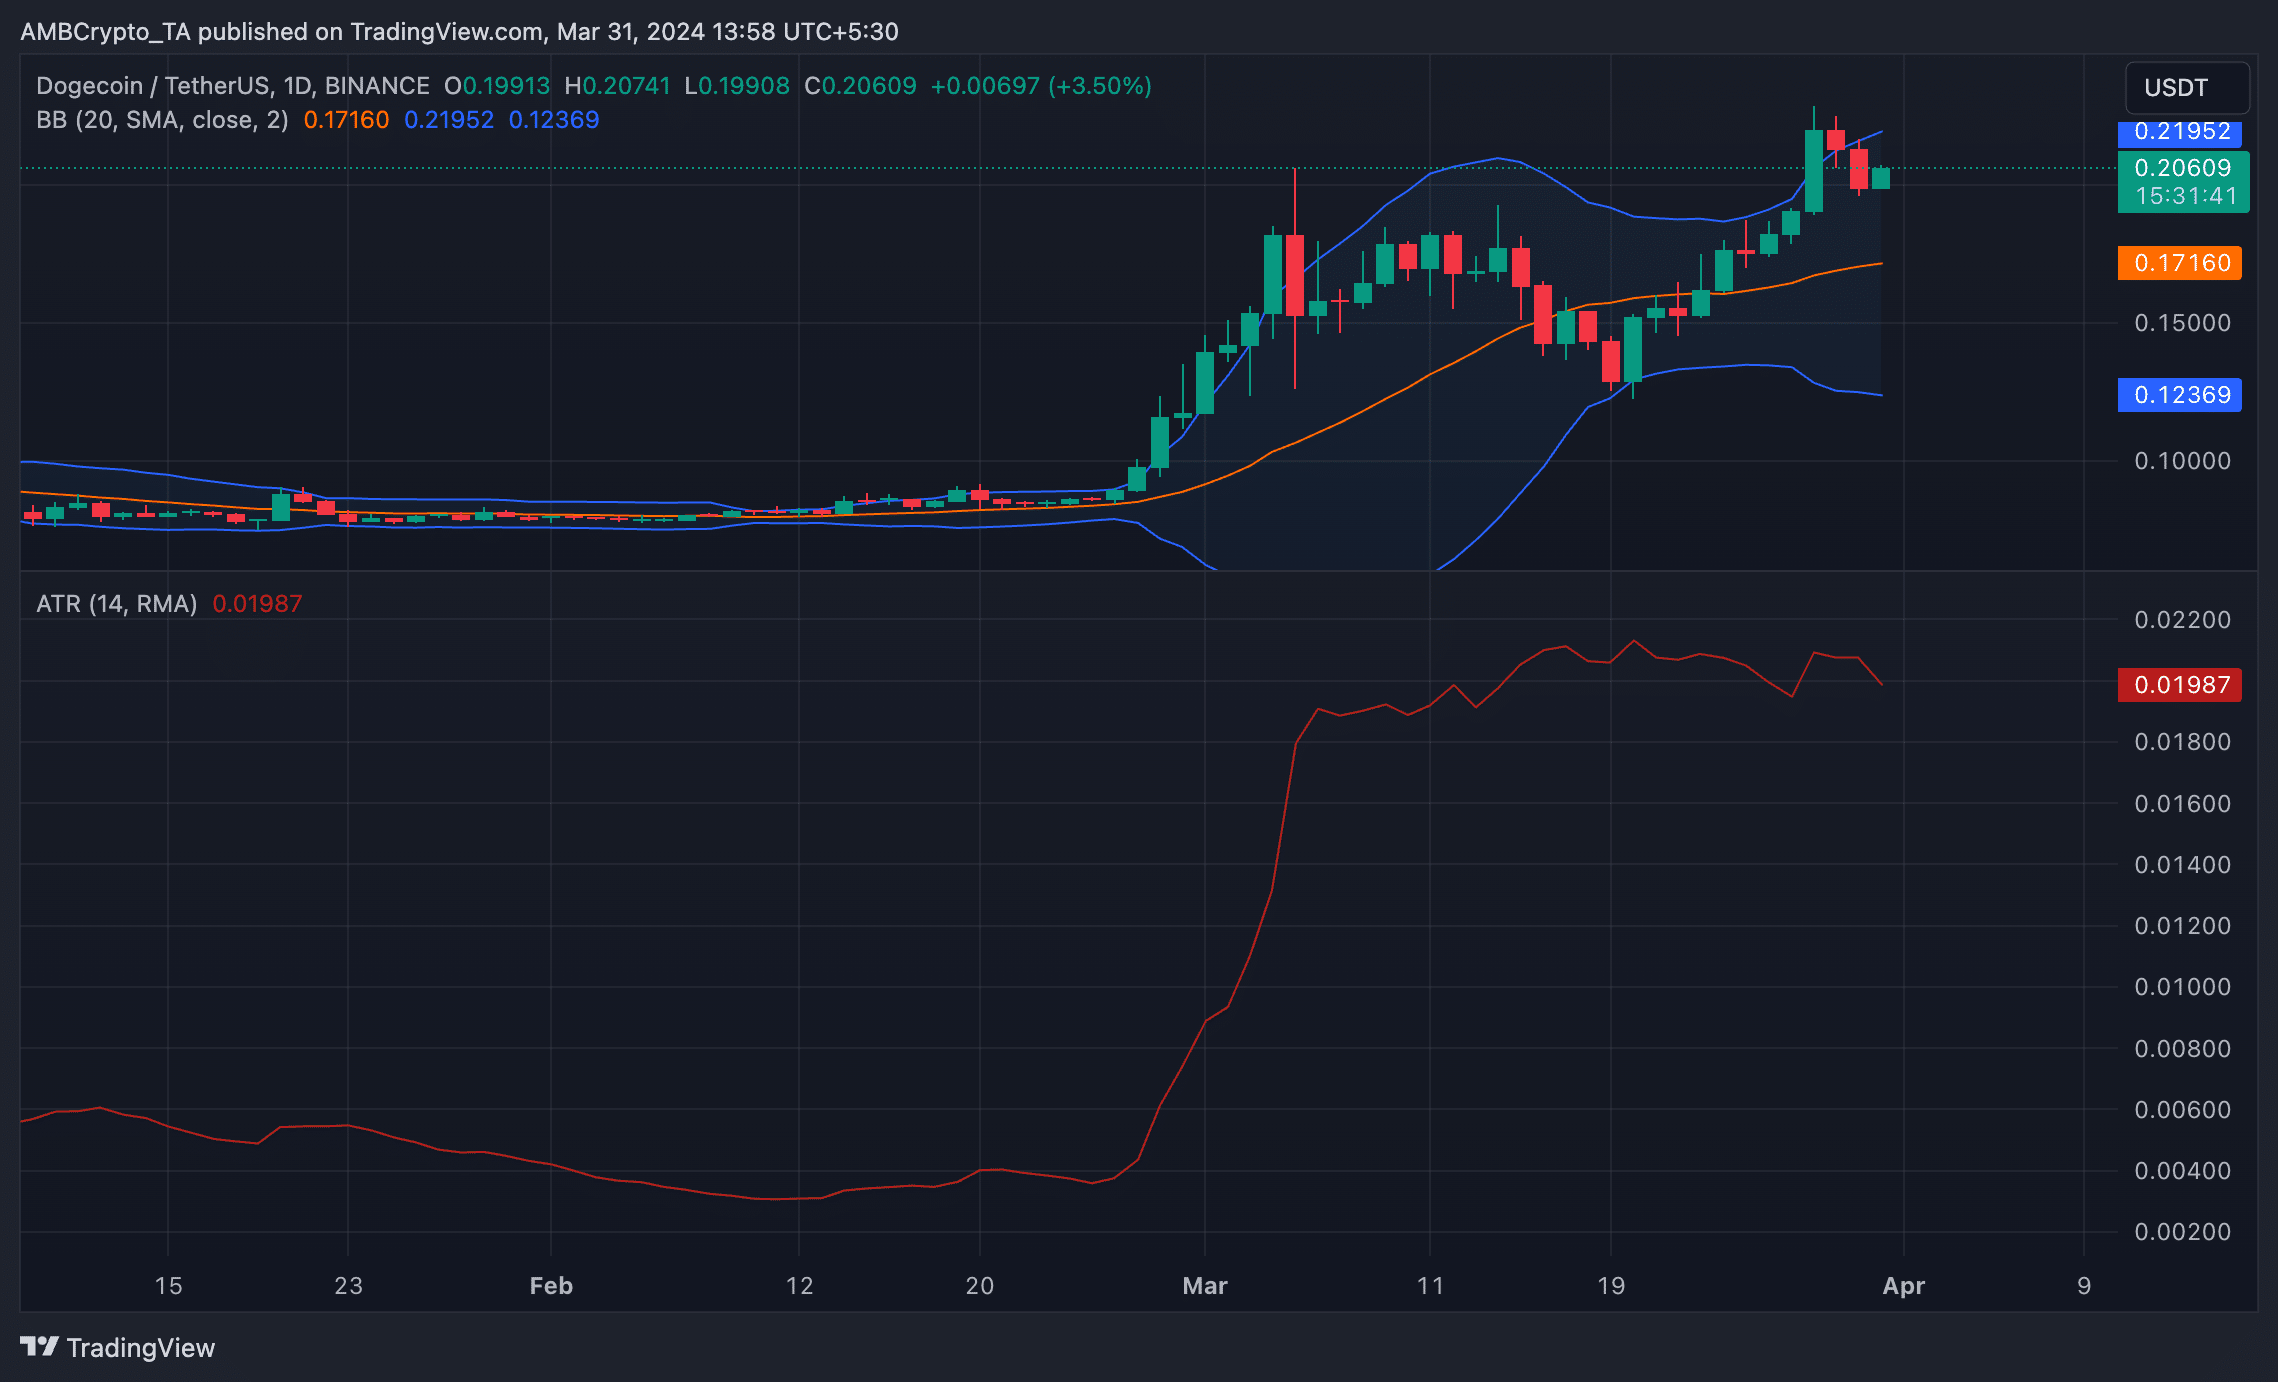
AMBCrypto assessed the coin’s Bollinger Bands (BB) on a one-day chart and found that the gap between the indicator’s upper and lower bands has steadily widened since the 27th of March.
地平線上の価格変動AMBCrypto が 1 日チャートでコインのボリンジャー バンド (BB) を評価したところ、指標の上部バンドと下部バンドの間のギャップが 3 月 27 日以来着実に拡大していることがわかりました。
This indicator gauges an asset’s market volatility and potential price movements. When the gap between its lower and upper bands widens, it indicates an increase in volatility.
この指標は、資産の市場のボラティリティと潜在的な価格変動を測定します。下限バンドと上限バンドの間のギャップが広がると、ボラティリティが増加していることを示します。
The gap may widen for several reasons, one of which is increased trading volume. According to Santiment’s data, DOGE’s trading volume climbed to a weekly high of $7 billion on the 28th of March.
この差はいくつかの理由で拡大する可能性がありますが、その 1 つは取引高の増加です。サンティメントのデータによると、DOGEの取引高は3月28日に週最高の70億ドルにまで上昇した。
During periods of band expansion, traders are on the lookout for price breakouts in either direction.
バンドが拡大する期間中、トレーダーはいずれかの方向の価格ブレイクアウトに注目します。
Further confirming the possibility of a market swing, the value of DOGE’s Average True has risen by 5% in the past three days.
市場変動の可能性をさらに裏付けるものとして、DOGE の Average True の値が過去 3 日間で 5% 上昇しました。
This indicator measures market volatility by calculating the average range between high and low prices over a specified number of periods.
この指標は、指定された期間の高値と安値の間の平均範囲を計算することにより、市場のボラティリティを測定します。
When it rises in this manner, it suggests that the price swings are becoming more significant.
このように上昇すると、価格変動がより大きくなっていることが示唆されます。
The bulls remain in control
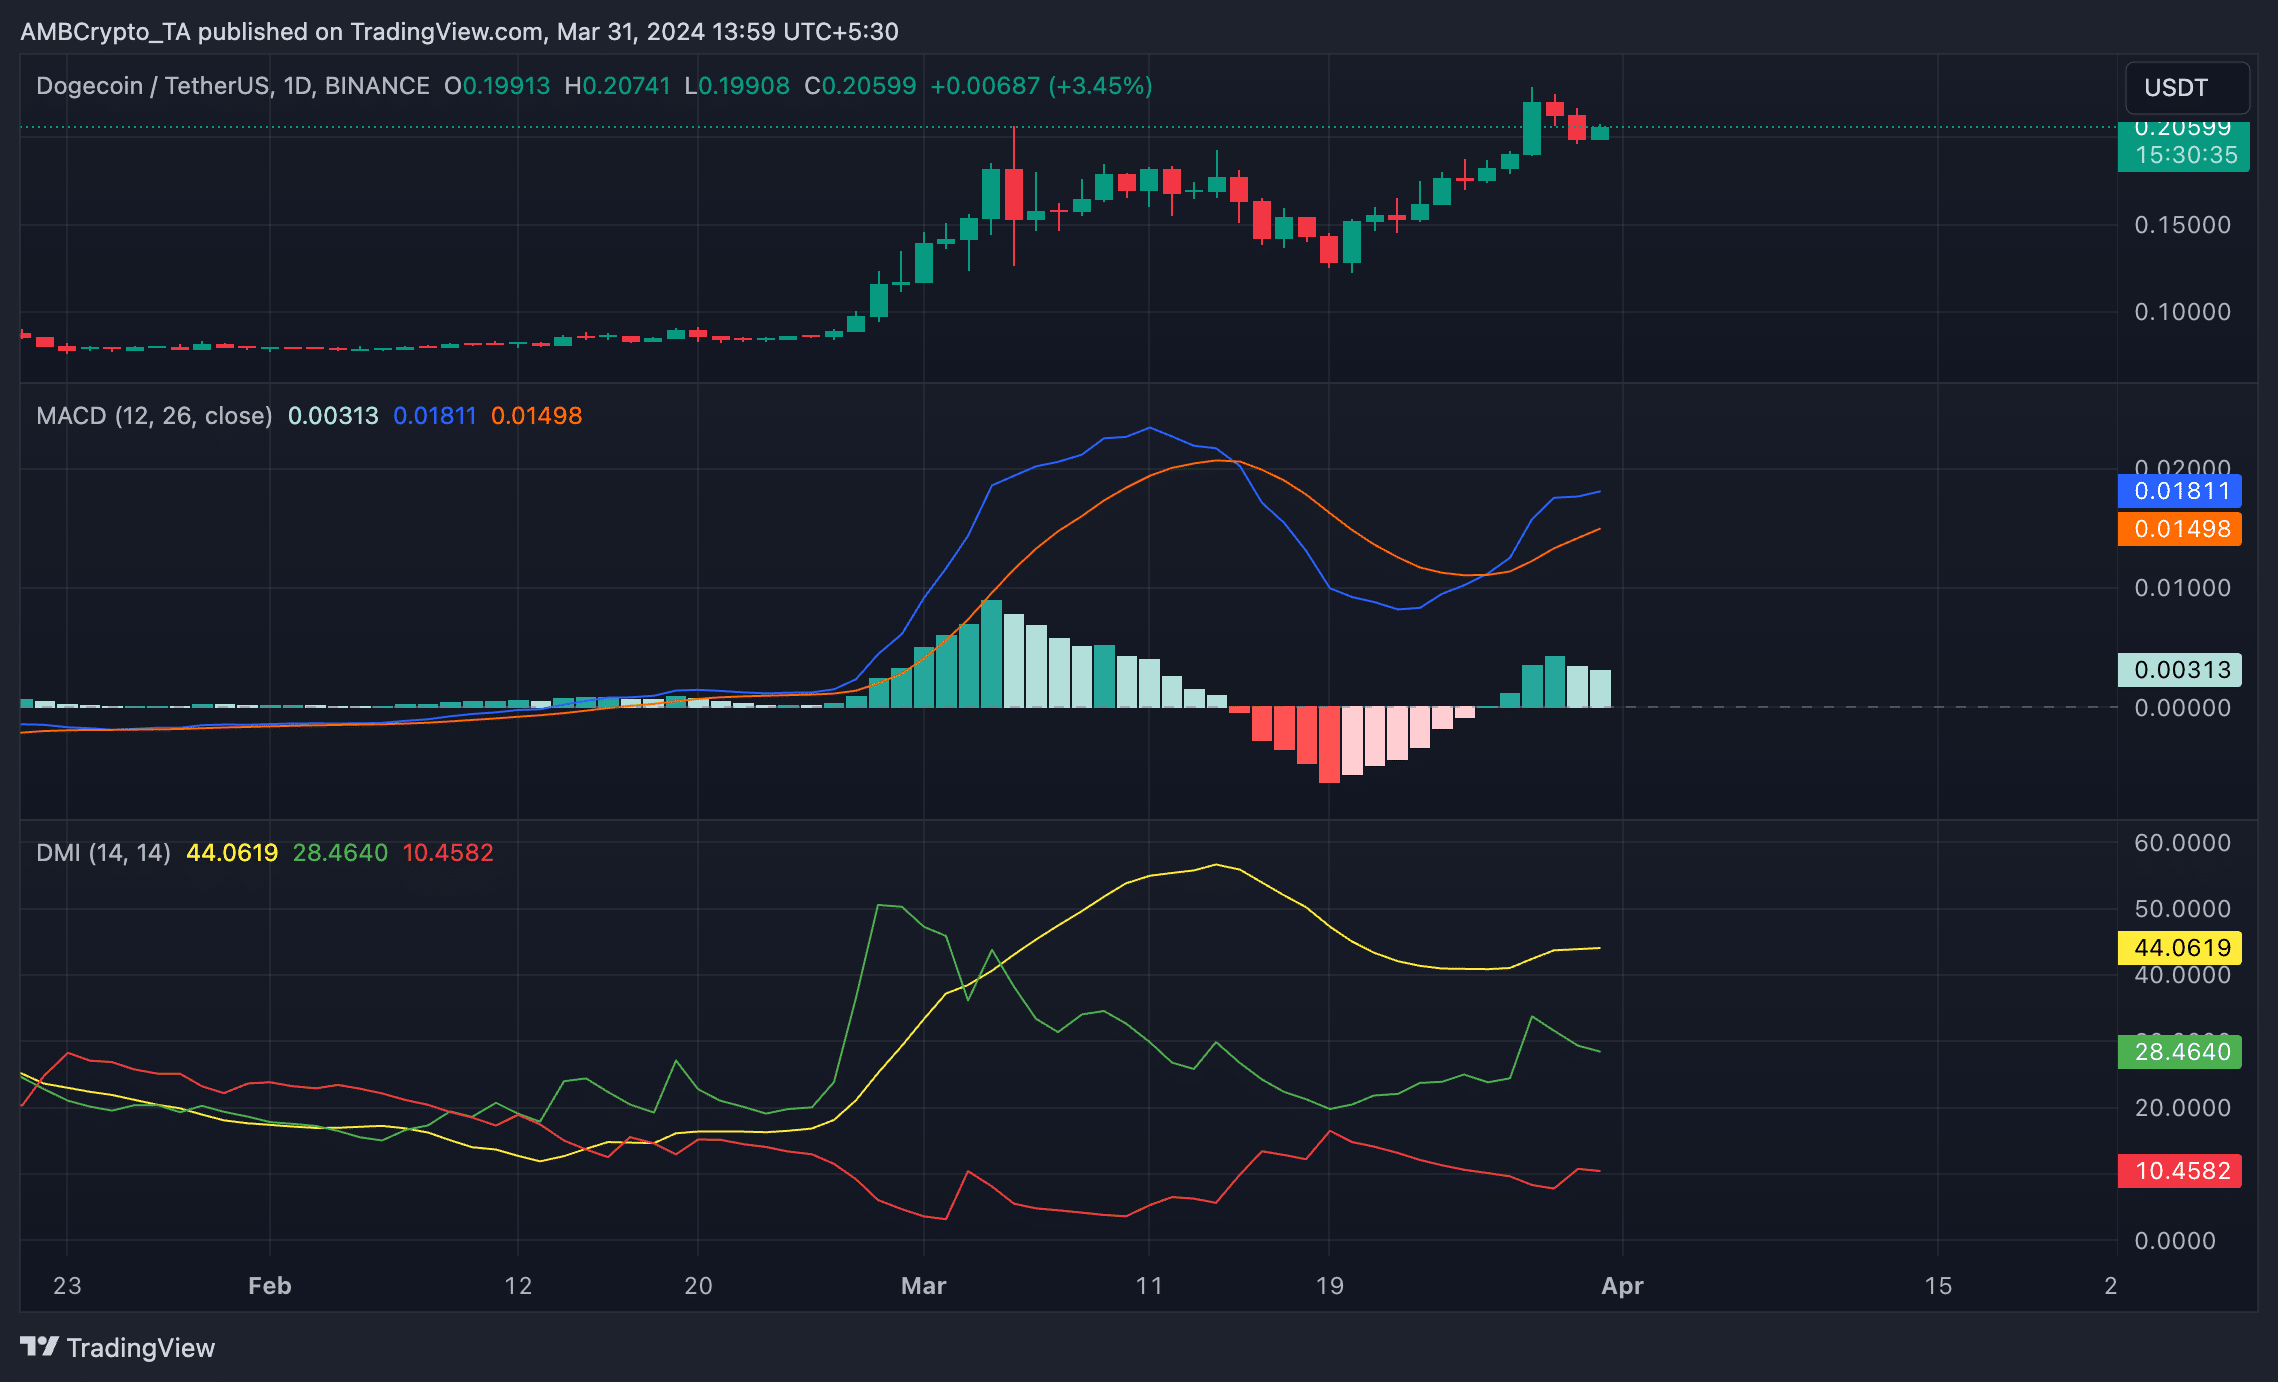
While volatility markers hint at the possibility of price swings in the coming days, DOGE’s Directional Movement Index (DMI) and Moving Average Convergence/Divergence indicators showed that bullish sentiments exceeded bearish activity.
引き続き強気派が主導権を握る ボラティリティ指標は今後数日間の価格変動の可能性を示唆しているが、DOGEの方向性動き指数(DMI)と移動平均の収束/発散指標は、強気のセンチメントが弱気の動きを上回っていることを示した。
Readings from the coin’s Directional Movement Index (DMI) showed the positive directional index above the negative index.
コインの方向性指数 (DMI) の測定値は、マイナスの指数を上回るプラスの方向性指数を示しました。
When these lines are positioned this way, it means that the strength of the prevailing bullish trend is higher than the strength of any potential downward price movement.
これらの線がこのように配置されている場合、一般的な強気トレンドの強さが、潜在的な下降価格の動きの強さよりも高いことを意味します。
Read Dogecoin’s [DOGE] Price Prediction 2024-25
Dogecoin の [DOGE] 価格予測 2024 ~ 25 年を読む
Likewise, DOGE’s MACD line crossed above the signal line on the 26th of March and has since been positioned this way.
同様に、DOGE の MACD ラインは 3 月 26 日にシグナルラインを上抜け、それ以来この位置にあります。
An upward intersection of the MACD line with the signal line is a bullish sign, often indicating a rise in buying pressure.
MACD ラインとシグナルラインが上向きに交差する場合は強気のサインであり、多くの場合、買い圧力の高まりを示します。
次へ: イーサリアムの最近の「下落」 – ETH に対して強気を維持すべきでしょうか?シェアシェアツイート


 BlockchainReporter
 Thecoinrepublic.com
 DogeHome
 CoinPedia News
 TheCoinrise Media
 BH NEWS
 COINTURK NEWS


