- DOGE’s price increased by double digits in the last week.
- Technical indicators hinted at the possibility of a price swing in either direction.
Leading meme coin Dogecoin [DOGE] may experience headwinds this week as volatility markers hinted at the possibility of significant short-term price swings.
DOGE 的价格上周上涨了两位数。技术指标暗示价格可能朝任一方向波动。领先的 meme 代币狗狗币 [DOGE] 本周可能会遇到阻力,因为波动性指标暗示短期价格可能大幅上涨波动。
At press time, DOGE was trading at $0.207. According to CoinMarketCap’s data, its price has increased by 20% in the last week.
截至发稿时,DOGE 的交易价格为 0.207 美元。根据CoinMarketCap的数据,其价格上周上涨了20%。
However, with rising volatility in its market, the meme coin may shed some of these gains.
然而,随着市场波动性的加剧,模因币可能会失去部分收益。
Price swings on the horizon
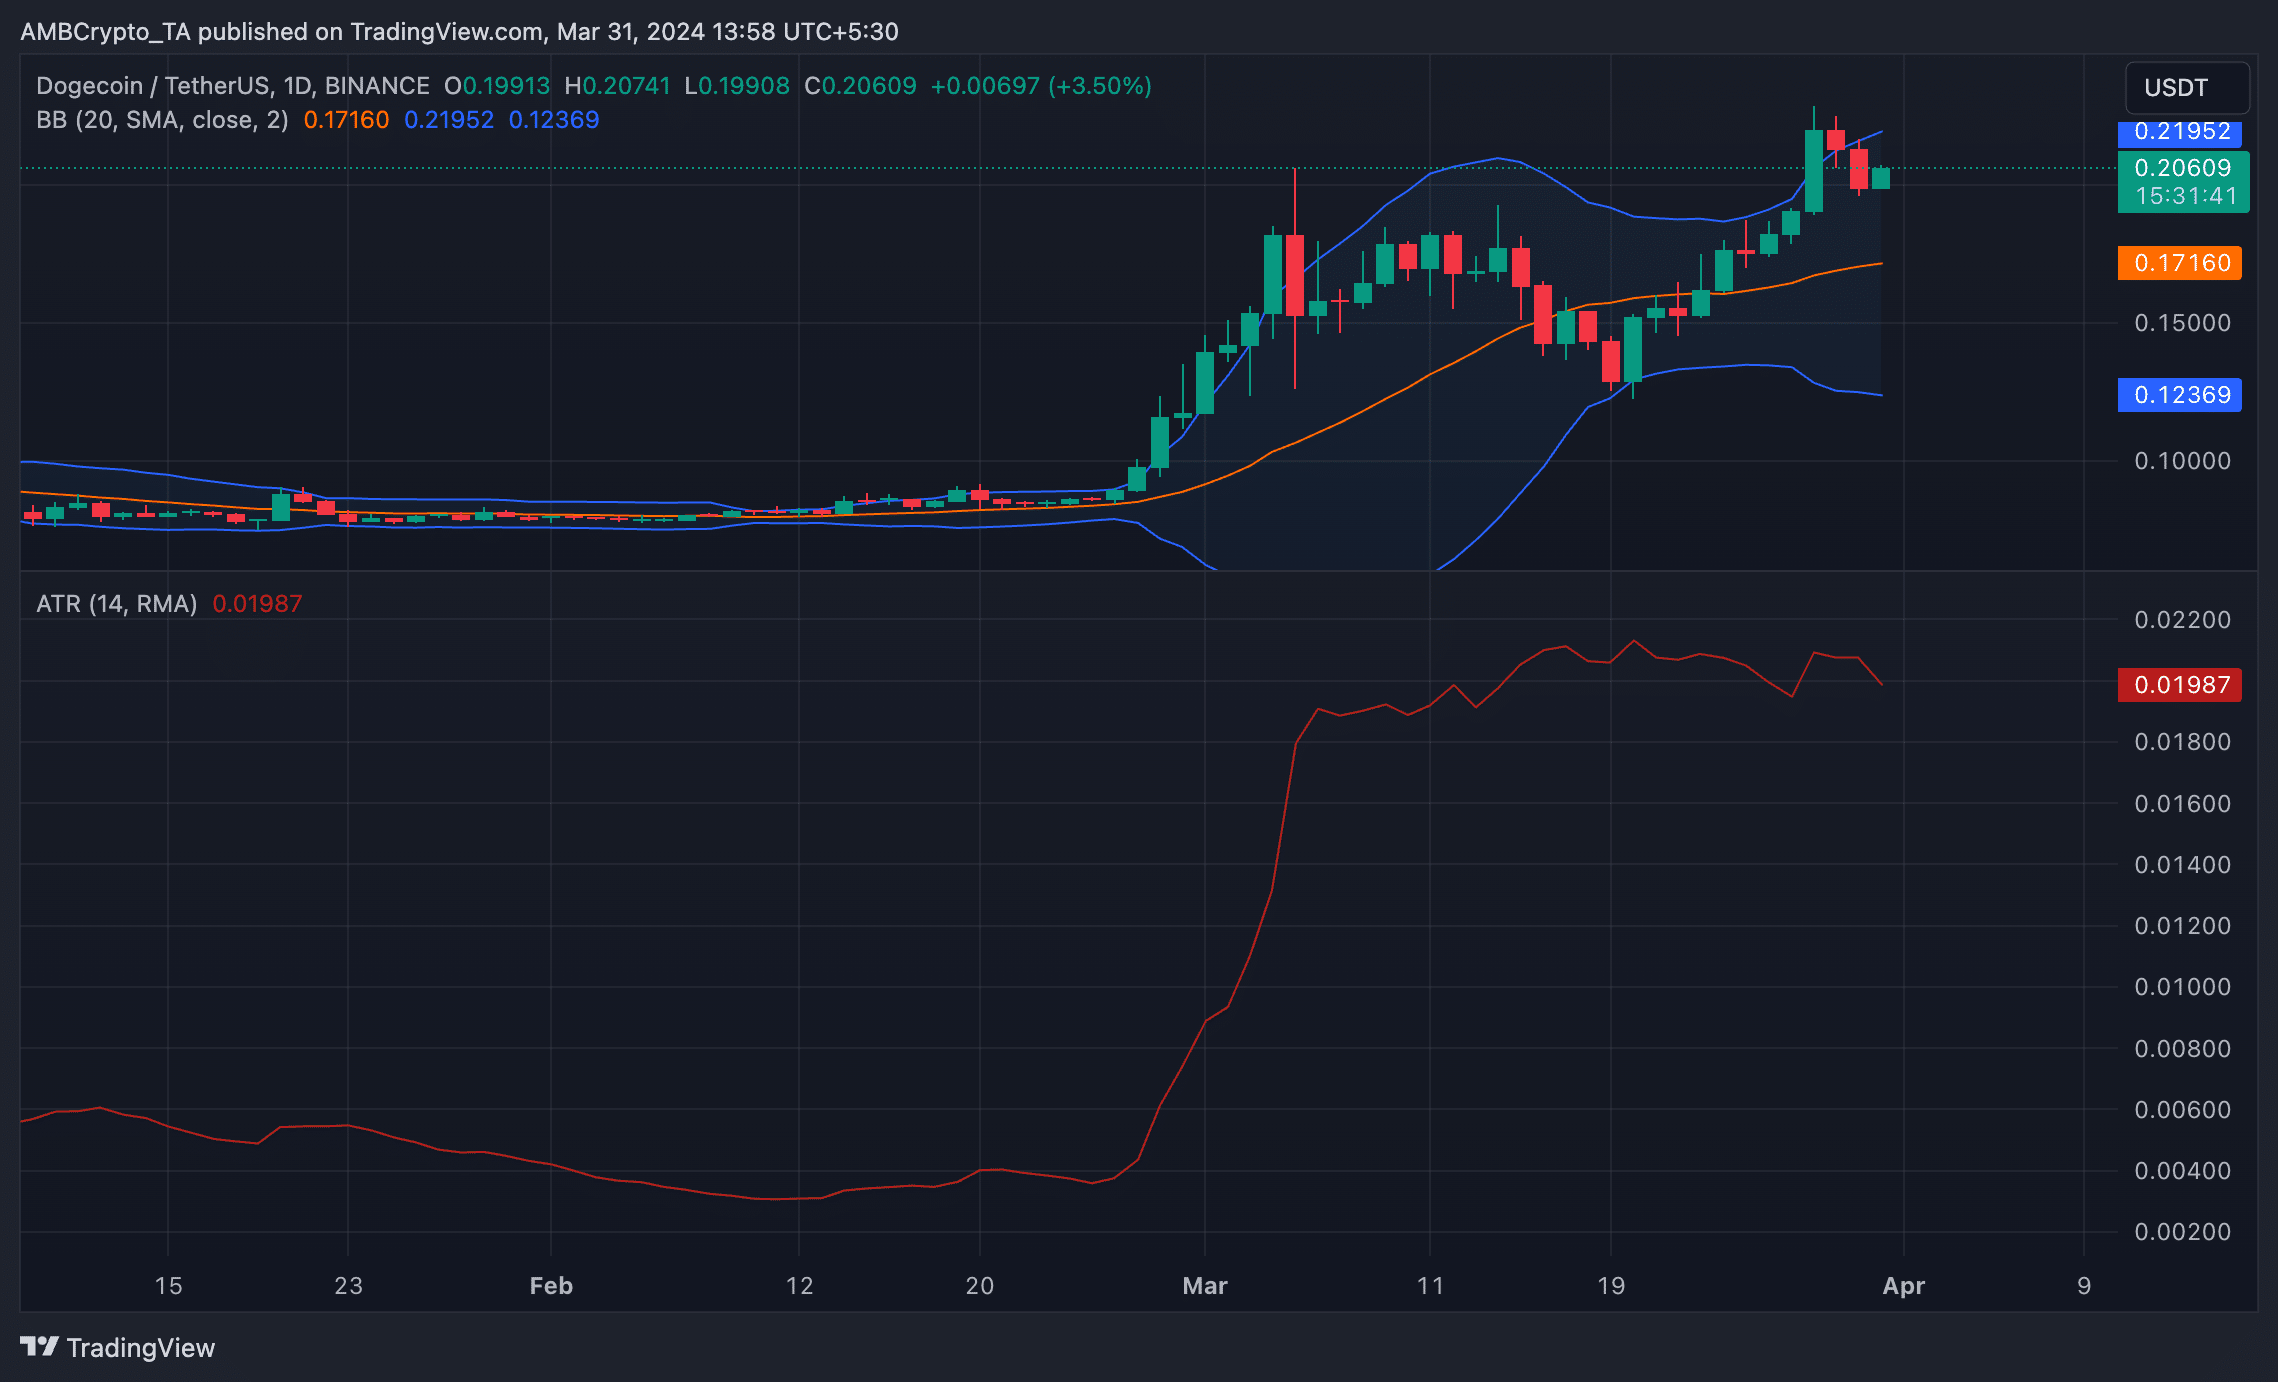
AMBCrypto assessed the coin’s Bollinger Bands (BB) on a one-day chart and found that the gap between the indicator’s upper and lower bands has steadily widened since the 27th of March.
价格波动即将到来 AMBCrypto 在一日图表上评估了该货币的布林带 (BB),发现该指标的上下带之间的差距自 3 月 27 日以来稳步扩大。
This indicator gauges an asset’s market volatility and potential price movements. When the gap between its lower and upper bands widens, it indicates an increase in volatility.
该指标衡量资产的市场波动性和潜在价格变动。当其下轨和上轨之间的差距扩大时,表明波动性增加。
The gap may widen for several reasons, one of which is increased trading volume. According to Santiment’s data, DOGE’s trading volume climbed to a weekly high of $7 billion on the 28th of March.
差距可能会因多种原因而扩大,其中之一是交易量增加。根据 Santiment 的数据,DOGE 的交易量在 3 月 28 日攀升至 70 亿美元的周高点。
During periods of band expansion, traders are on the lookout for price breakouts in either direction.
在波段扩张期间,交易者会留意任一方向的价格突破。
Further confirming the possibility of a market swing, the value of DOGE’s Average True has risen by 5% in the past three days.
DOGE的Average True价值在过去三天上涨了5%,进一步证实了市场波动的可能性。
This indicator measures market volatility by calculating the average range between high and low prices over a specified number of periods.
该指标通过计算指定时期内高价和低价之间的平均范围来衡量市场波动性。
When it rises in this manner, it suggests that the price swings are becoming more significant.
当它以这种方式上涨时,表明价格波动变得更加显着。
The bulls remain in control
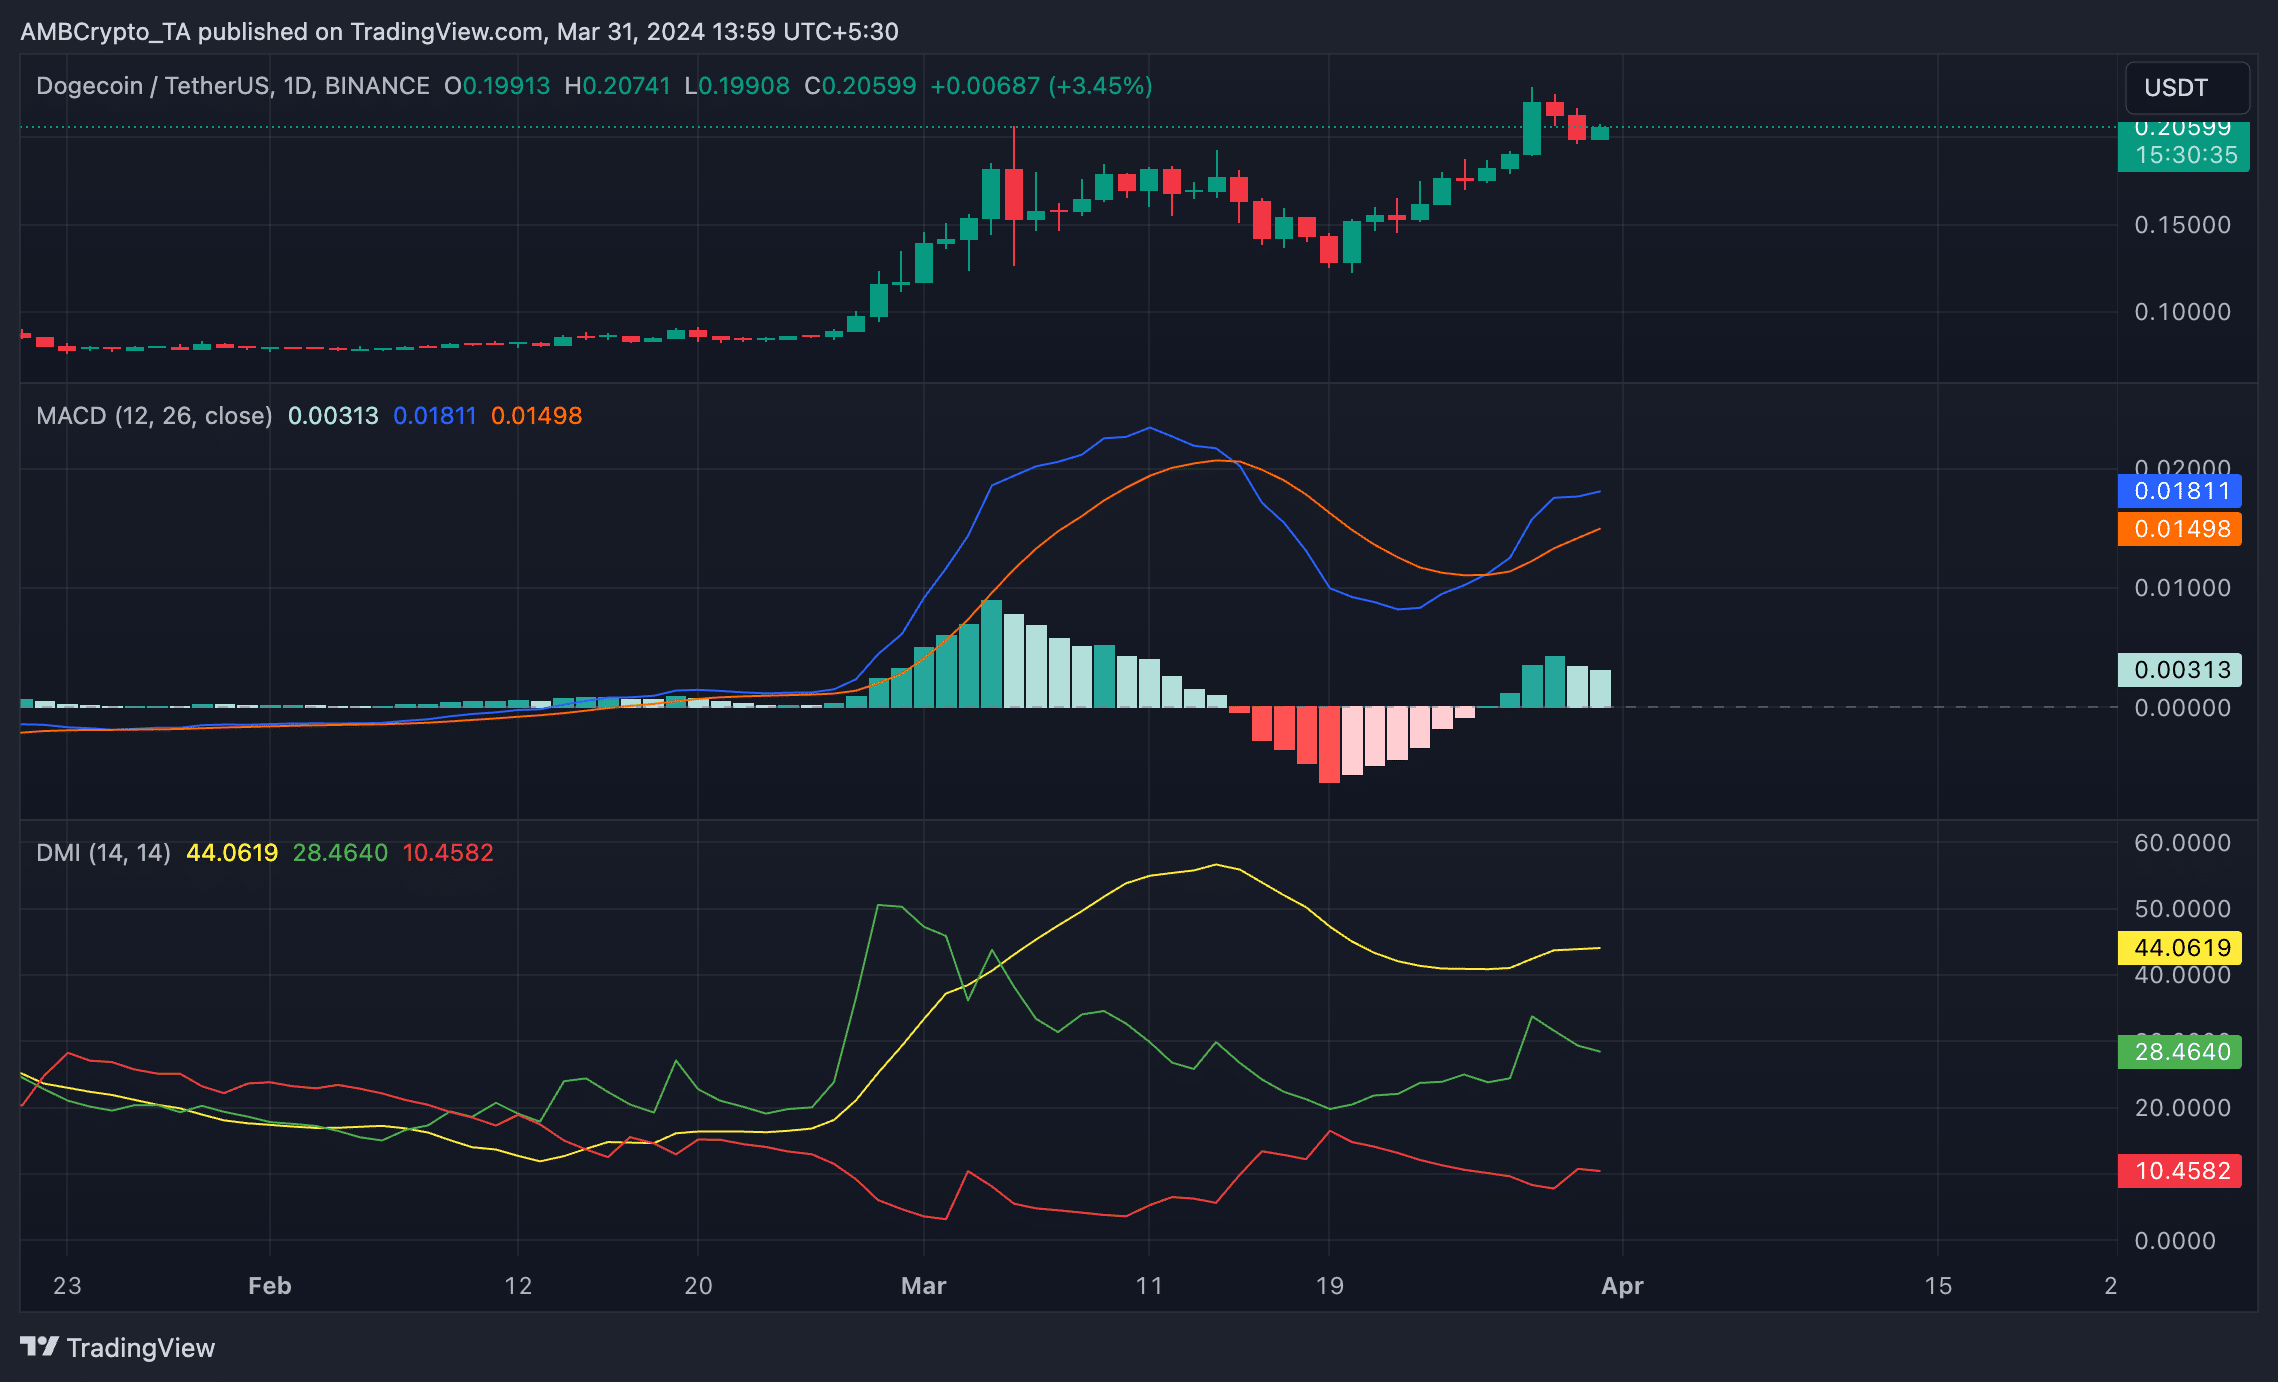
While volatility markers hint at the possibility of price swings in the coming days, DOGE’s Directional Movement Index (DMI) and Moving Average Convergence/Divergence indicators showed that bullish sentiments exceeded bearish activity.
多头仍处于控制之中虽然波动性指标暗示未来几天价格波动的可能性,但DOGE的方向运动指数(DMI)和移动平均收敛/发散指标显示看涨情绪超过看跌活动。
Readings from the coin’s Directional Movement Index (DMI) showed the positive directional index above the negative index.
代币方向运动指数(DMI)的读数显示正向指数高于负向指数。
When these lines are positioned this way, it means that the strength of the prevailing bullish trend is higher than the strength of any potential downward price movement.
当这些线以这种方式定位时,意味着当前看涨趋势的强度高于任何潜在价格下跌走势的强度。
Read Dogecoin’s [DOGE] Price Prediction 2024-25
阅读狗狗币的 [DOGE] 2024-25 价格预测
Likewise, DOGE’s MACD line crossed above the signal line on the 26th of March and has since been positioned this way.
同样,DOGE 的 MACD 线在 3 月 26 日穿过信号线,此后一直如此定位。
An upward intersection of the MACD line with the signal line is a bullish sign, often indicating a rise in buying pressure.
MACD 线与信号线向上交叉是看涨信号,通常表明购买压力上升。
下一篇:以太坊最近的“下跌”——你应该继续看好以太坊吗?分享分享推文


 DogeHome
 TheCoinrise Media
 Crypto Front News
 BlockchainReporter
 Thecoinrepublic.com
 CoinPedia News
 TheCoinrise Media


