

Dogecoin (DOGE) experienced a significant price drop, falling over 70% after reaching $0.48 in December 2024. Interestingly, despite this decline, large Dogecoin holders have been accumulating, suggesting confidence in a potential price rebound.
Dogecoin (Doge)은 2024 년 12 월에 0.48 달러에 도달 한 후 70% 이상 하락한 가격 하락을 경험했습니다. 흥미롭게도,이 감소에도 불구하고 대형 Dogecoin 소지자들은 축적되어 잠재적 인 가격 반등에 대한 자신감을 나타냅니다.
On-Chain Data Hints at a Dogecoin Price Rebound
On-Chain Data는 Dogecoin 가격 반등으로 힌트입니다
On-chain data from Santiment reveals that wallets holding at least 1 million DOGE have increased by 1.24% since early February, even amidst falling prices. Concurrently, active addresses have reached a four-month high, indicating increased network activity.
Santiment의 온쇄 데이터에 따르면 최소 백만 명 이상의 Doge를 보유한 지갑은 2 월 초 이후 1.24% 증가했으며, 가격 하락 가운데서도 증가했습니다. 동시에, 활성 주소는 4 개월 최고치에 도달하여 네트워크 활동이 증가했습니다.
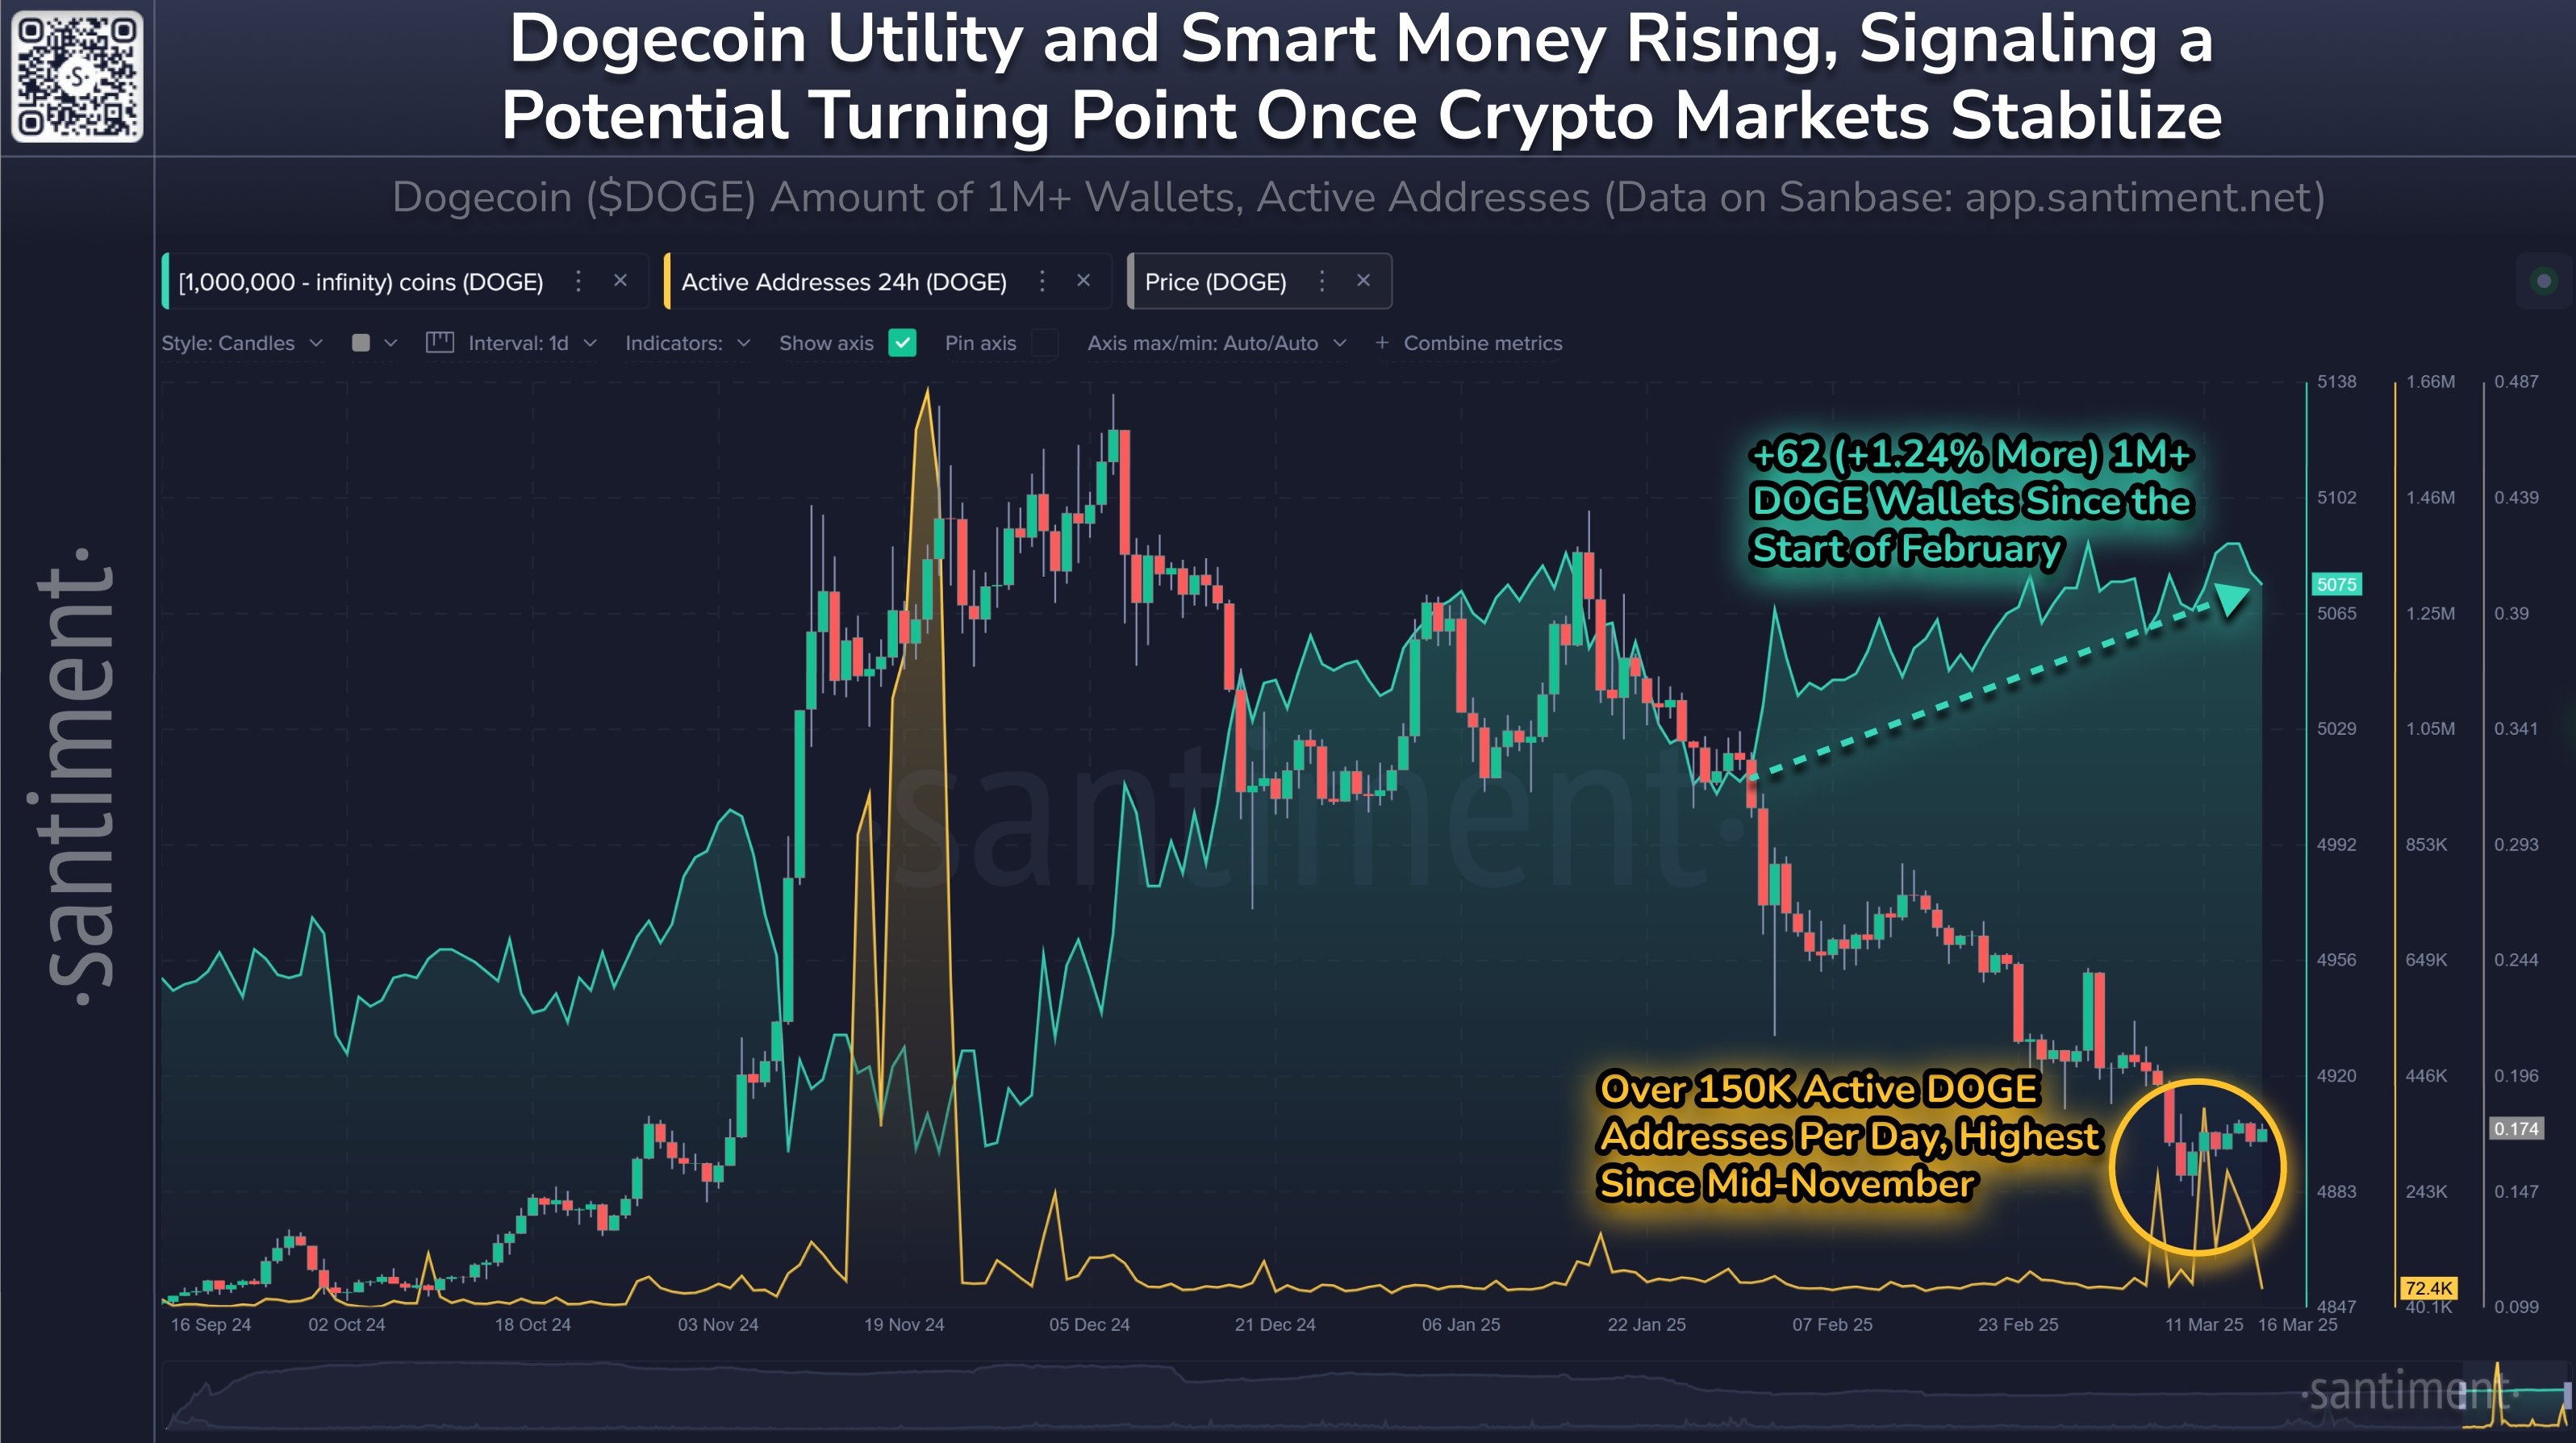
Dogecoin addresses holding at least a million DOGE vs. price. Source: Santiment
Dogecoin은 최소 백만 명 대 가격을 보유하고 있습니다. 출처 : Santiment
This accumulation by large holders during a price decline often signals a belief in undervaluation and a strategic positioning for a future price increase. The rise in active addresses points to greater network engagement, potentially reflecting growing retail interest. If this increased user activity is driven by genuine adoption rather than speculation or panic selling, it could provide the on-chain support needed for a price recovery. A similar pattern preceded DOGE's substantial price rally in November.
가격 하락 중 큰 소지자에 의한 이러한 축적은 종종 과잉 평가에 대한 믿음과 미래의 가격 인상을위한 전략적 포지셔닝을 나타냅니다. 활발한 주소의 증가는 더 큰 네트워크 참여를 지적하며, 잠재적으로 소매 관심사가 증가하고 있습니다. 이 증가 된 사용자 활동이 추측이나 공황 판매보다는 진정한 채택에 의해 주도된다면, 가격 회복에 필요한 온쇄 지원을 제공 할 수 있습니다. 비슷한 패턴은 11 월에 Doge의 상당한 가격 랠리에 앞서있었습니다.
Oversold Conditions Suggest Potential for a 30% Rally
과매도 조건은 30% 랠리의 잠재력을 시사합니다
Dogecoin is currently testing key support levels, including a multi-year ascending trendline and the 200-week exponential moving average (EMA) around $0.13. Historically, these levels have triggered strong bullish reversals.
Dogecoin은 현재 다년간 오름차순 트렌드 라인과 200 주 동안 EMA (Exponential Moving Average)를 포함하여 주요 지원 수준을 테스트하고 있습니다. 역사적 으로이 수준은 강력한 강세 반전을 유발했습니다.
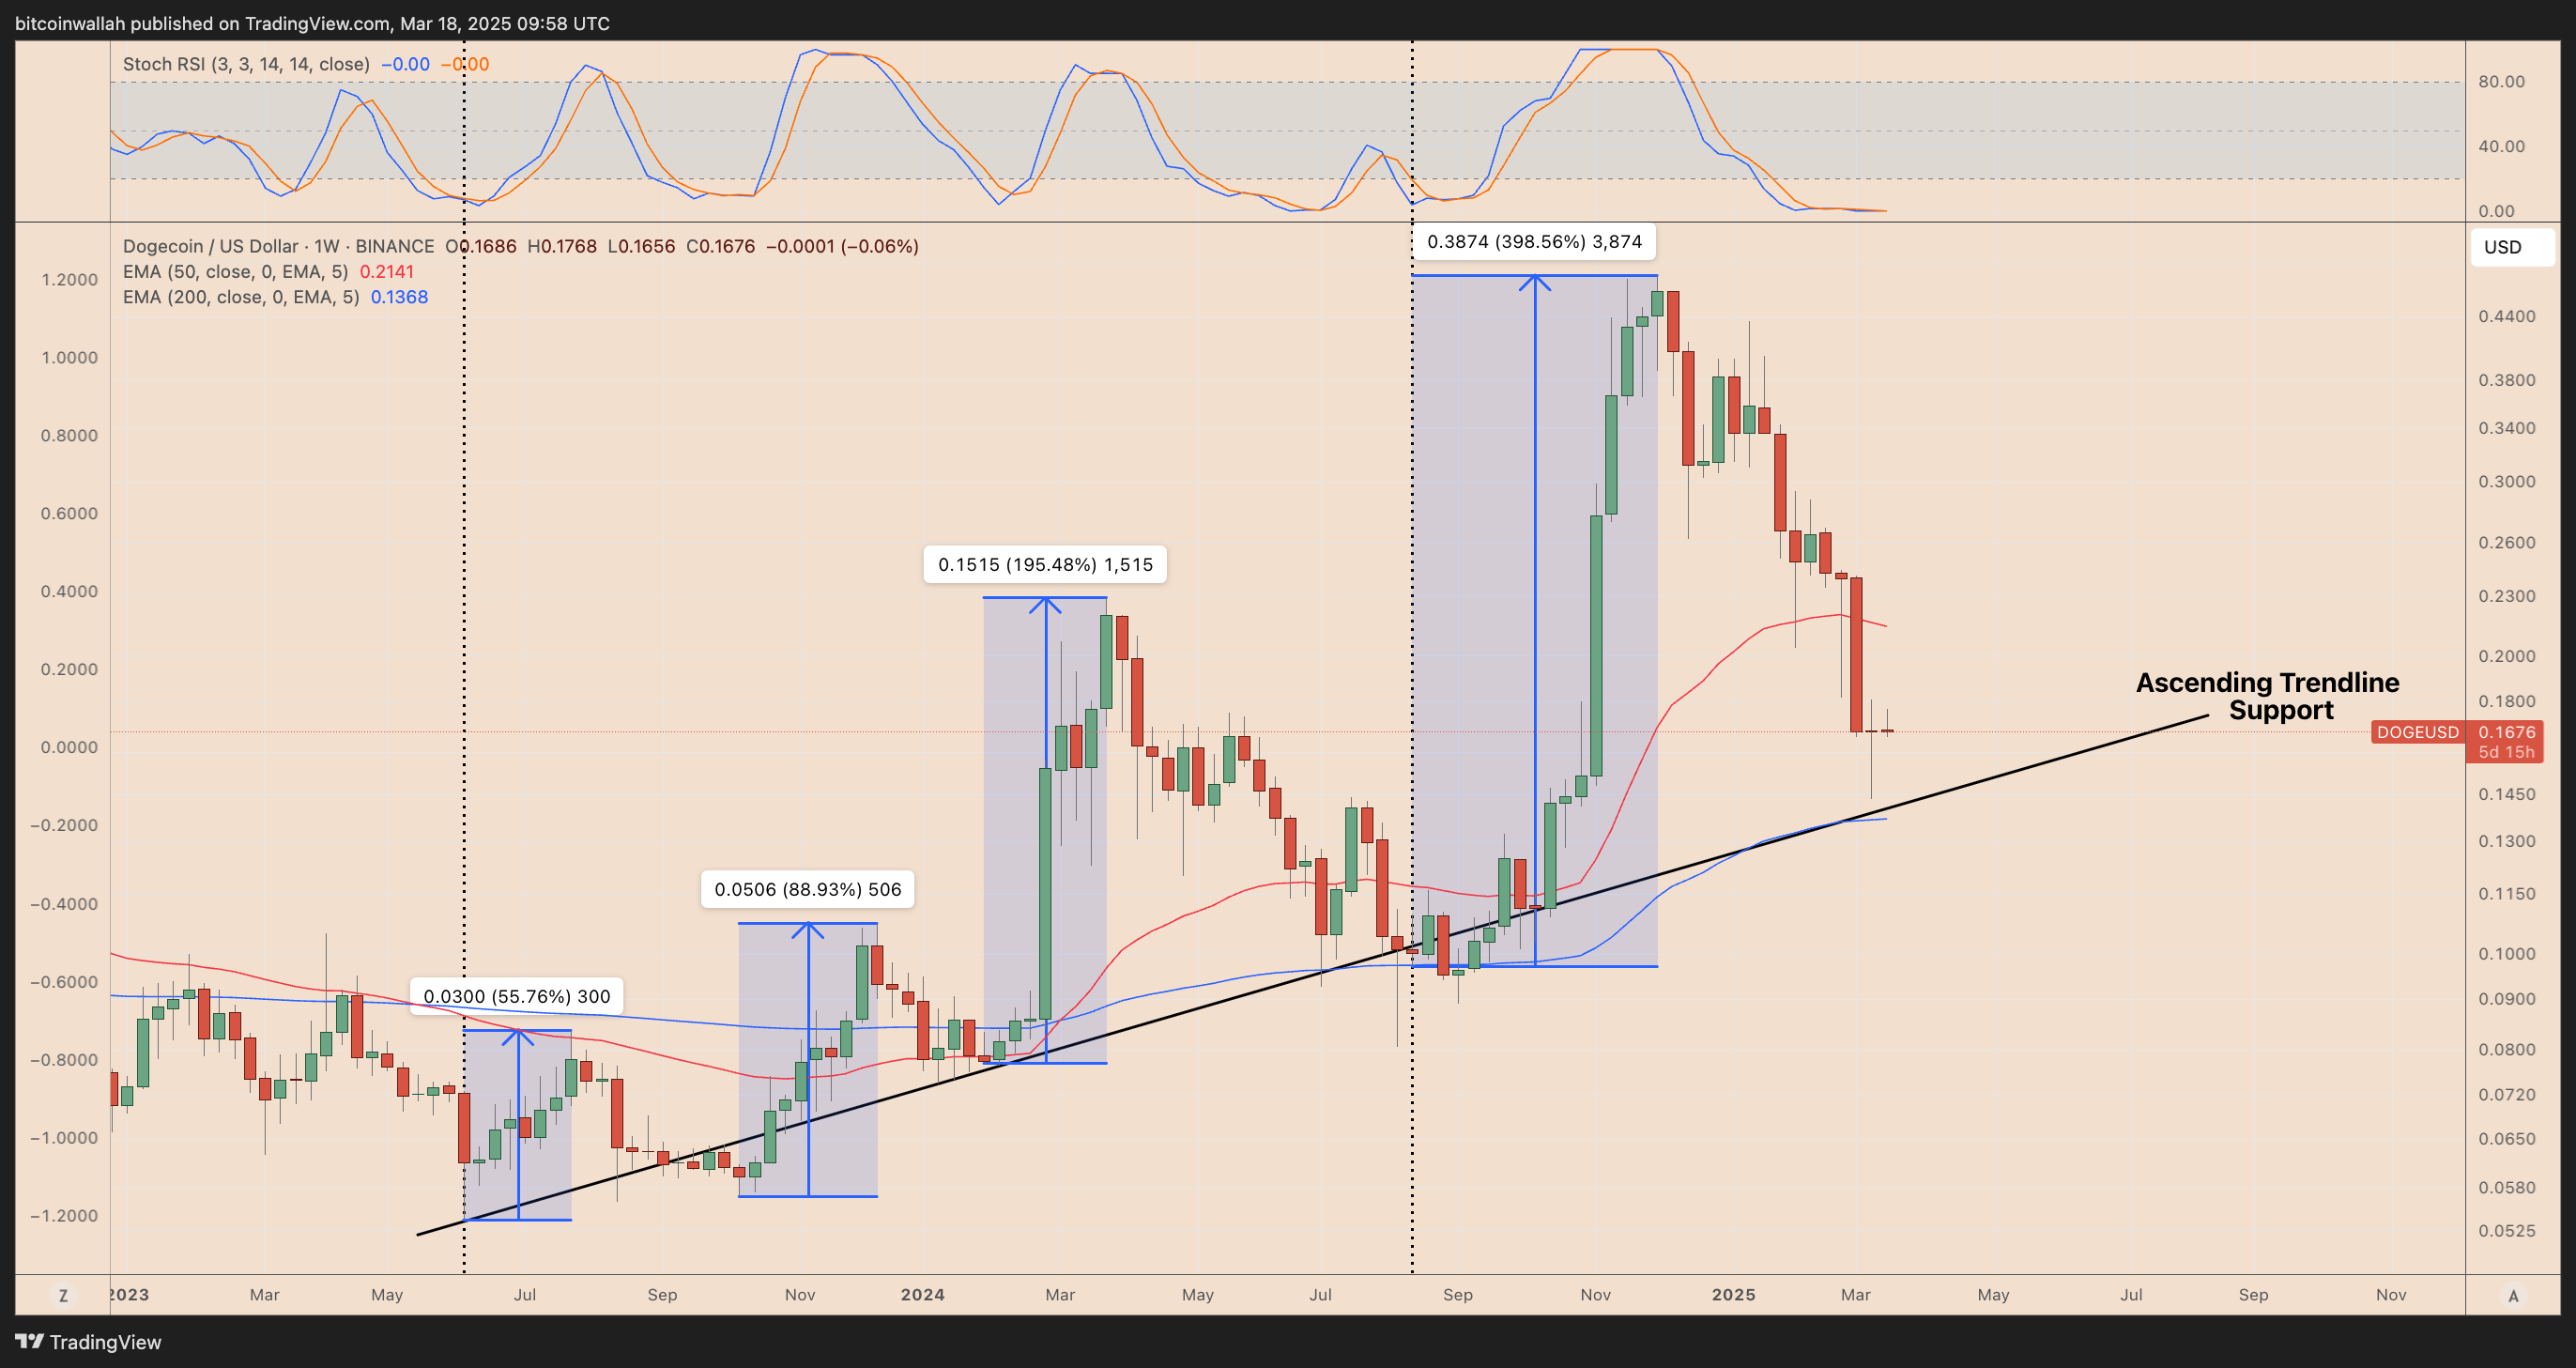
DOGE/USD weekly price chart. Source: TradingView
Doge/USD 주간 가격 차트. 출처 : TradingView
Furthermore, the Stochastic RSI, a momentum indicator, shows a bullish crossover in the oversold region (below 0.30). This often signals weakening selling pressure. In previous instances, this low-level crossover in DOGE has preceded significant price recoveries, including a 400% rally in 2024 and an 88% gain in 2023.
또한, 모멘텀 지표 인 확률 론적 RSI는 과산 영역 (0.30 미만)에서 낙관적 인 크로스 오버를 보여준다. 이것은 종종 판매 압력 약화를 신호합니다. 이전의 경우, Doge 의이 저수준 크로스 오버는 2024 년 400% 랠리와 2023 년 88%의 상승을 포함하여 상당한 가격 회복에 앞서있었습니다.
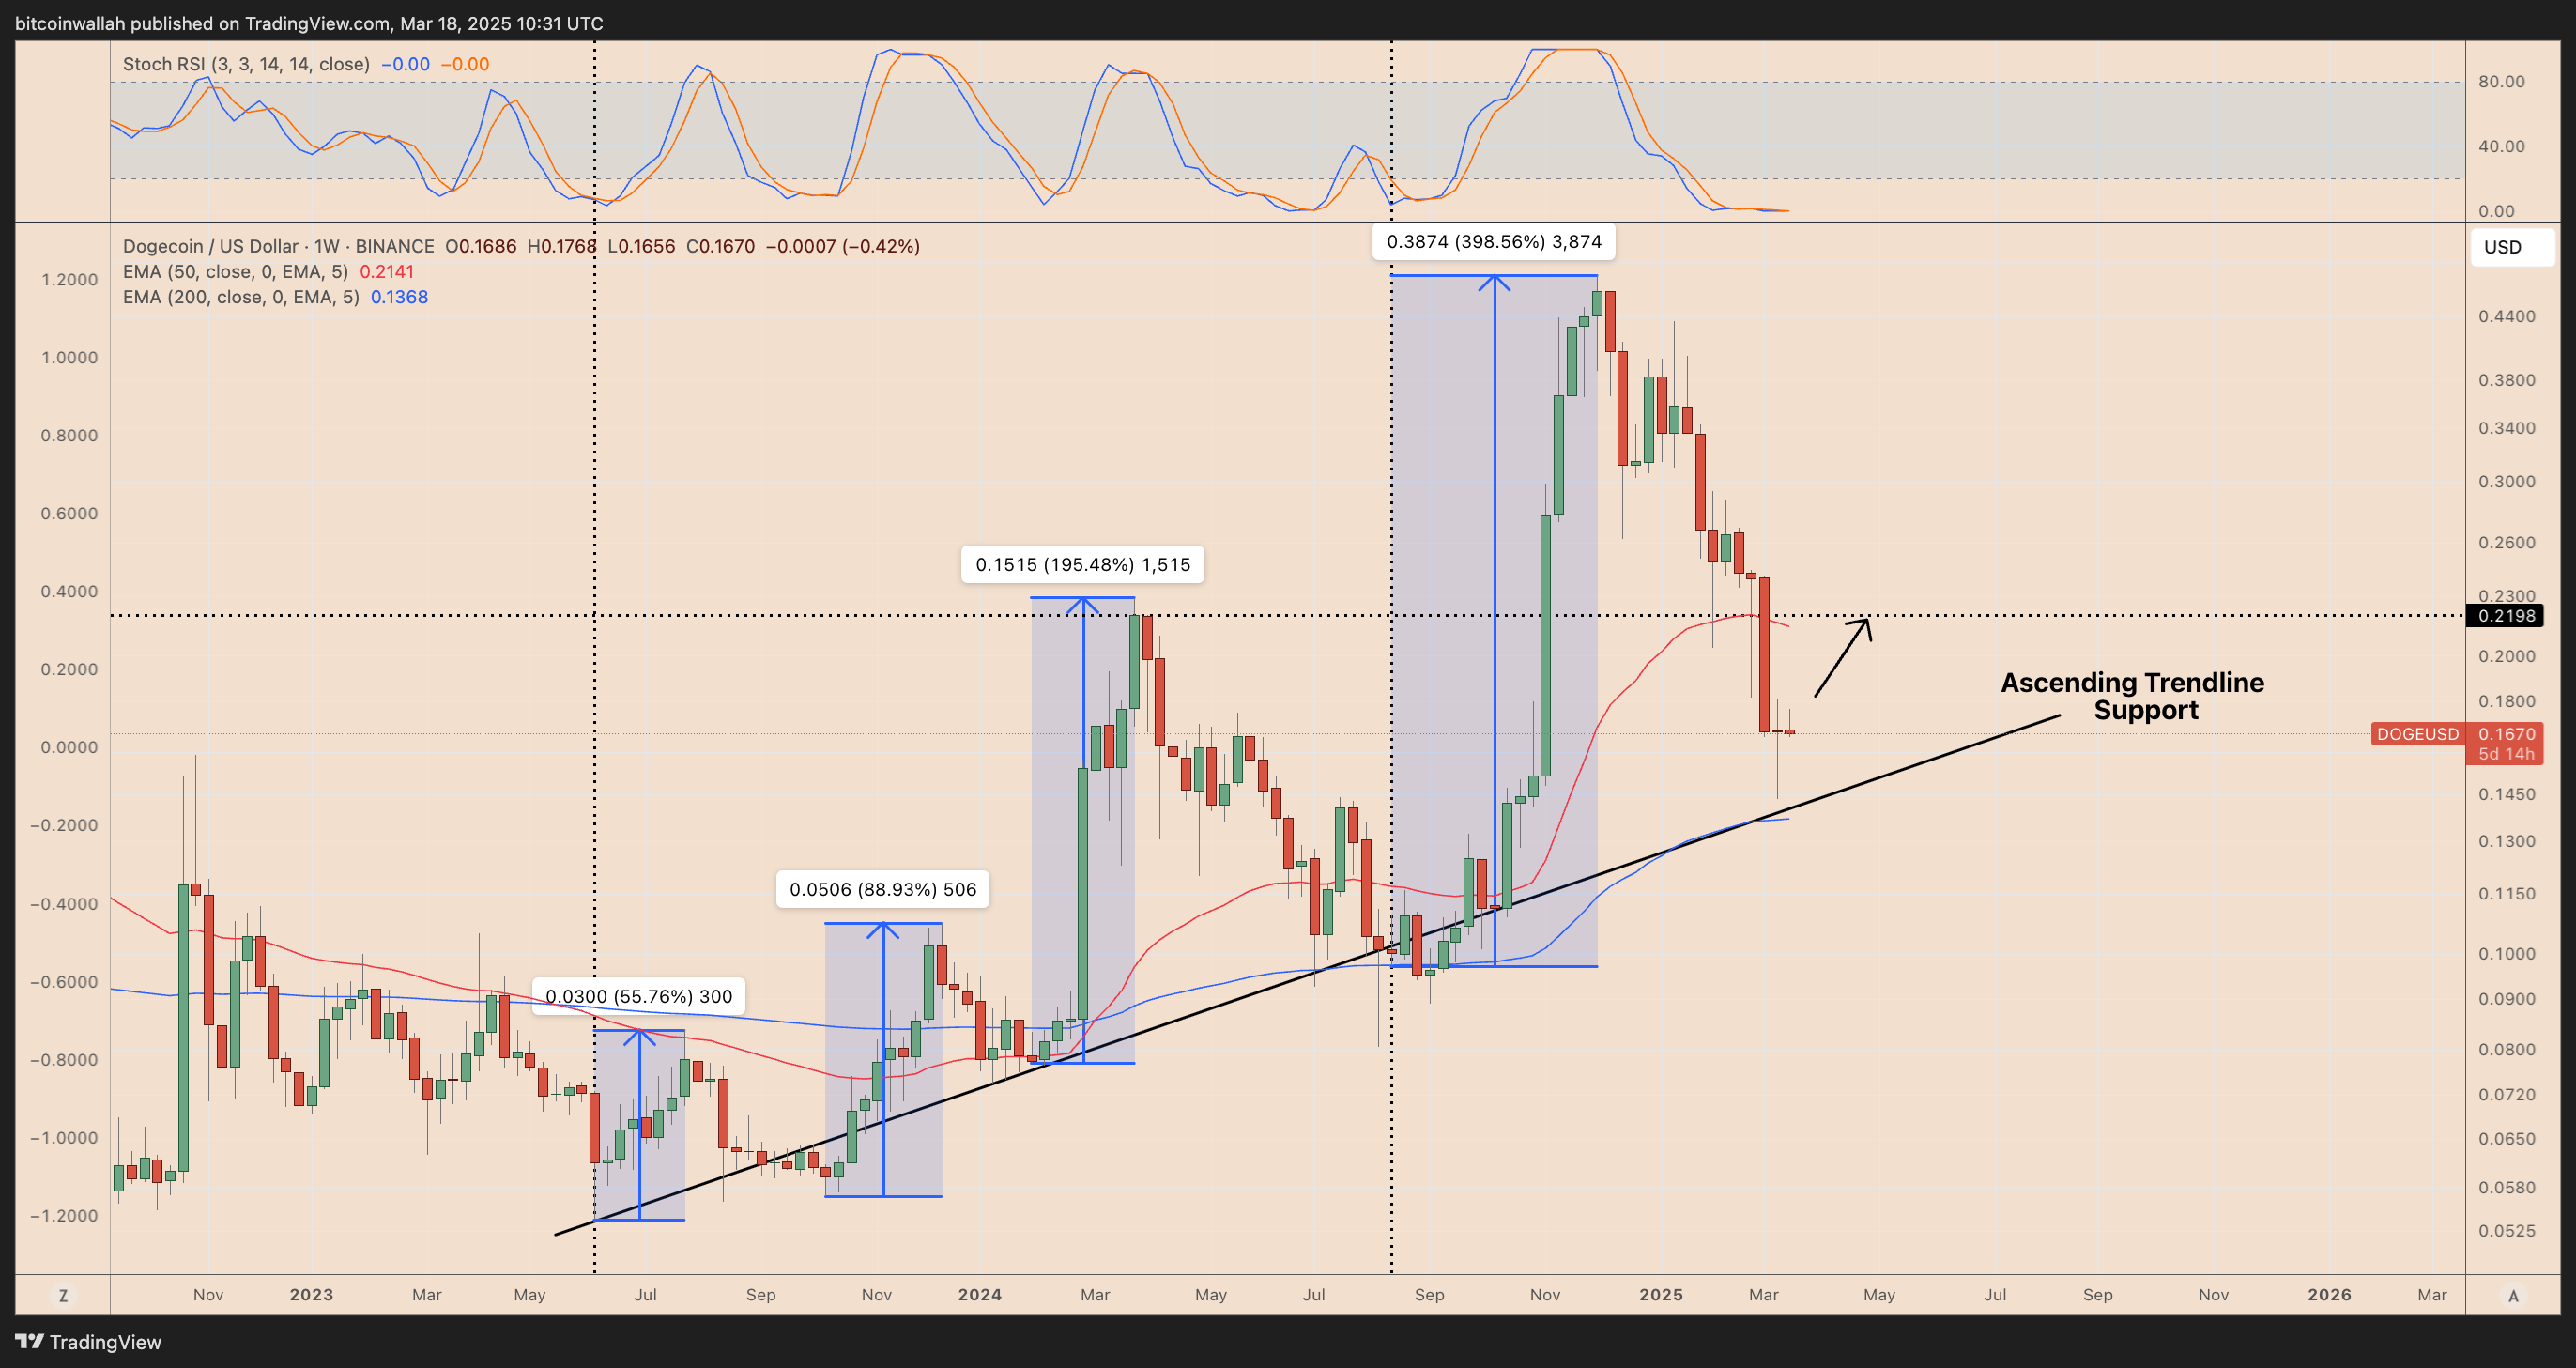
DOGE/USD weekly price chart. Source: TradingView
Doge/USD 주간 가격 차트. 출처 : TradingView
The primary resistance level is around $0.22, coinciding with the 50-week EMA and the March-April 2024 resistance area. However, failure to hold the current support levels could invalidate this bullish outlook, potentially leading to a further correction towards $0.12, a support level observed in March-May 2024.
1 차 저항 수준은 약 $ 0.22이며 50 주 EMA 및 2024 년 3 월 -4 월 저항 지역과 일치합니다. 그러나 현재 지원 수준을 유지하지 못하면이 강세의 전망이 무효화되어 2024 년 3 월 5 일에 관찰 된 지원 수준 인 $ 0.12에 대한 추가 수정이 발생할 수 있습니다.
Disclaimer: This article does not provide investment advice. All investment and trading decisions involve risk, and readers should conduct their own thorough research before making any investment choices.
면책 조항 :이 기사는 투자 조언을 제공하지 않습니다. 모든 투자 및 거래 결정에는 위험이 포함되며 독자는 투자 선택을하기 전에 자신의 철저한 연구를 수행해야합니다.
 CoinsProbe
 CoinPedia News
 DogeHome
 Crypto Daily™
 Crypto Daily™
 CoinPedia News
 Crypto Daily™
 The Bitcoin Daily


