

Dogecoin (DOGE) experienced a significant price drop, falling over 70% after reaching $0.48 in December 2024. Interestingly, despite this decline, large Dogecoin holders have been accumulating, suggesting confidence in a potential price rebound.
Dogecoin(Doge)は、2024年12月に0.48ドルに達した後、70%を超える大幅な価格下落を経験しました。興味深いことに、この減少にもかかわらず、大規模なDogecoin保有者は蓄積しており、潜在的な価格のリバウンドに対する信頼を示唆しています。
On-Chain Data Hints at a Dogecoin Price Rebound
オンチェーンデータは、Dogecoin Priceのリバウンドを示唆しています
On-chain data from Santiment reveals that wallets holding at least 1 million DOGE have increased by 1.24% since early February, even amidst falling prices. Concurrently, active addresses have reached a four-month high, indicating increased network activity.
Santimentからのチェーンデータは、価格の下落の中であっても、2月上旬から少なくとも100万のDogeを保持しているウォレットが1.24%増加したことを明らかにしています。 同時に、アクティブアドレスは4か月の高さに達し、ネットワークアクティビティの増加を示しています。
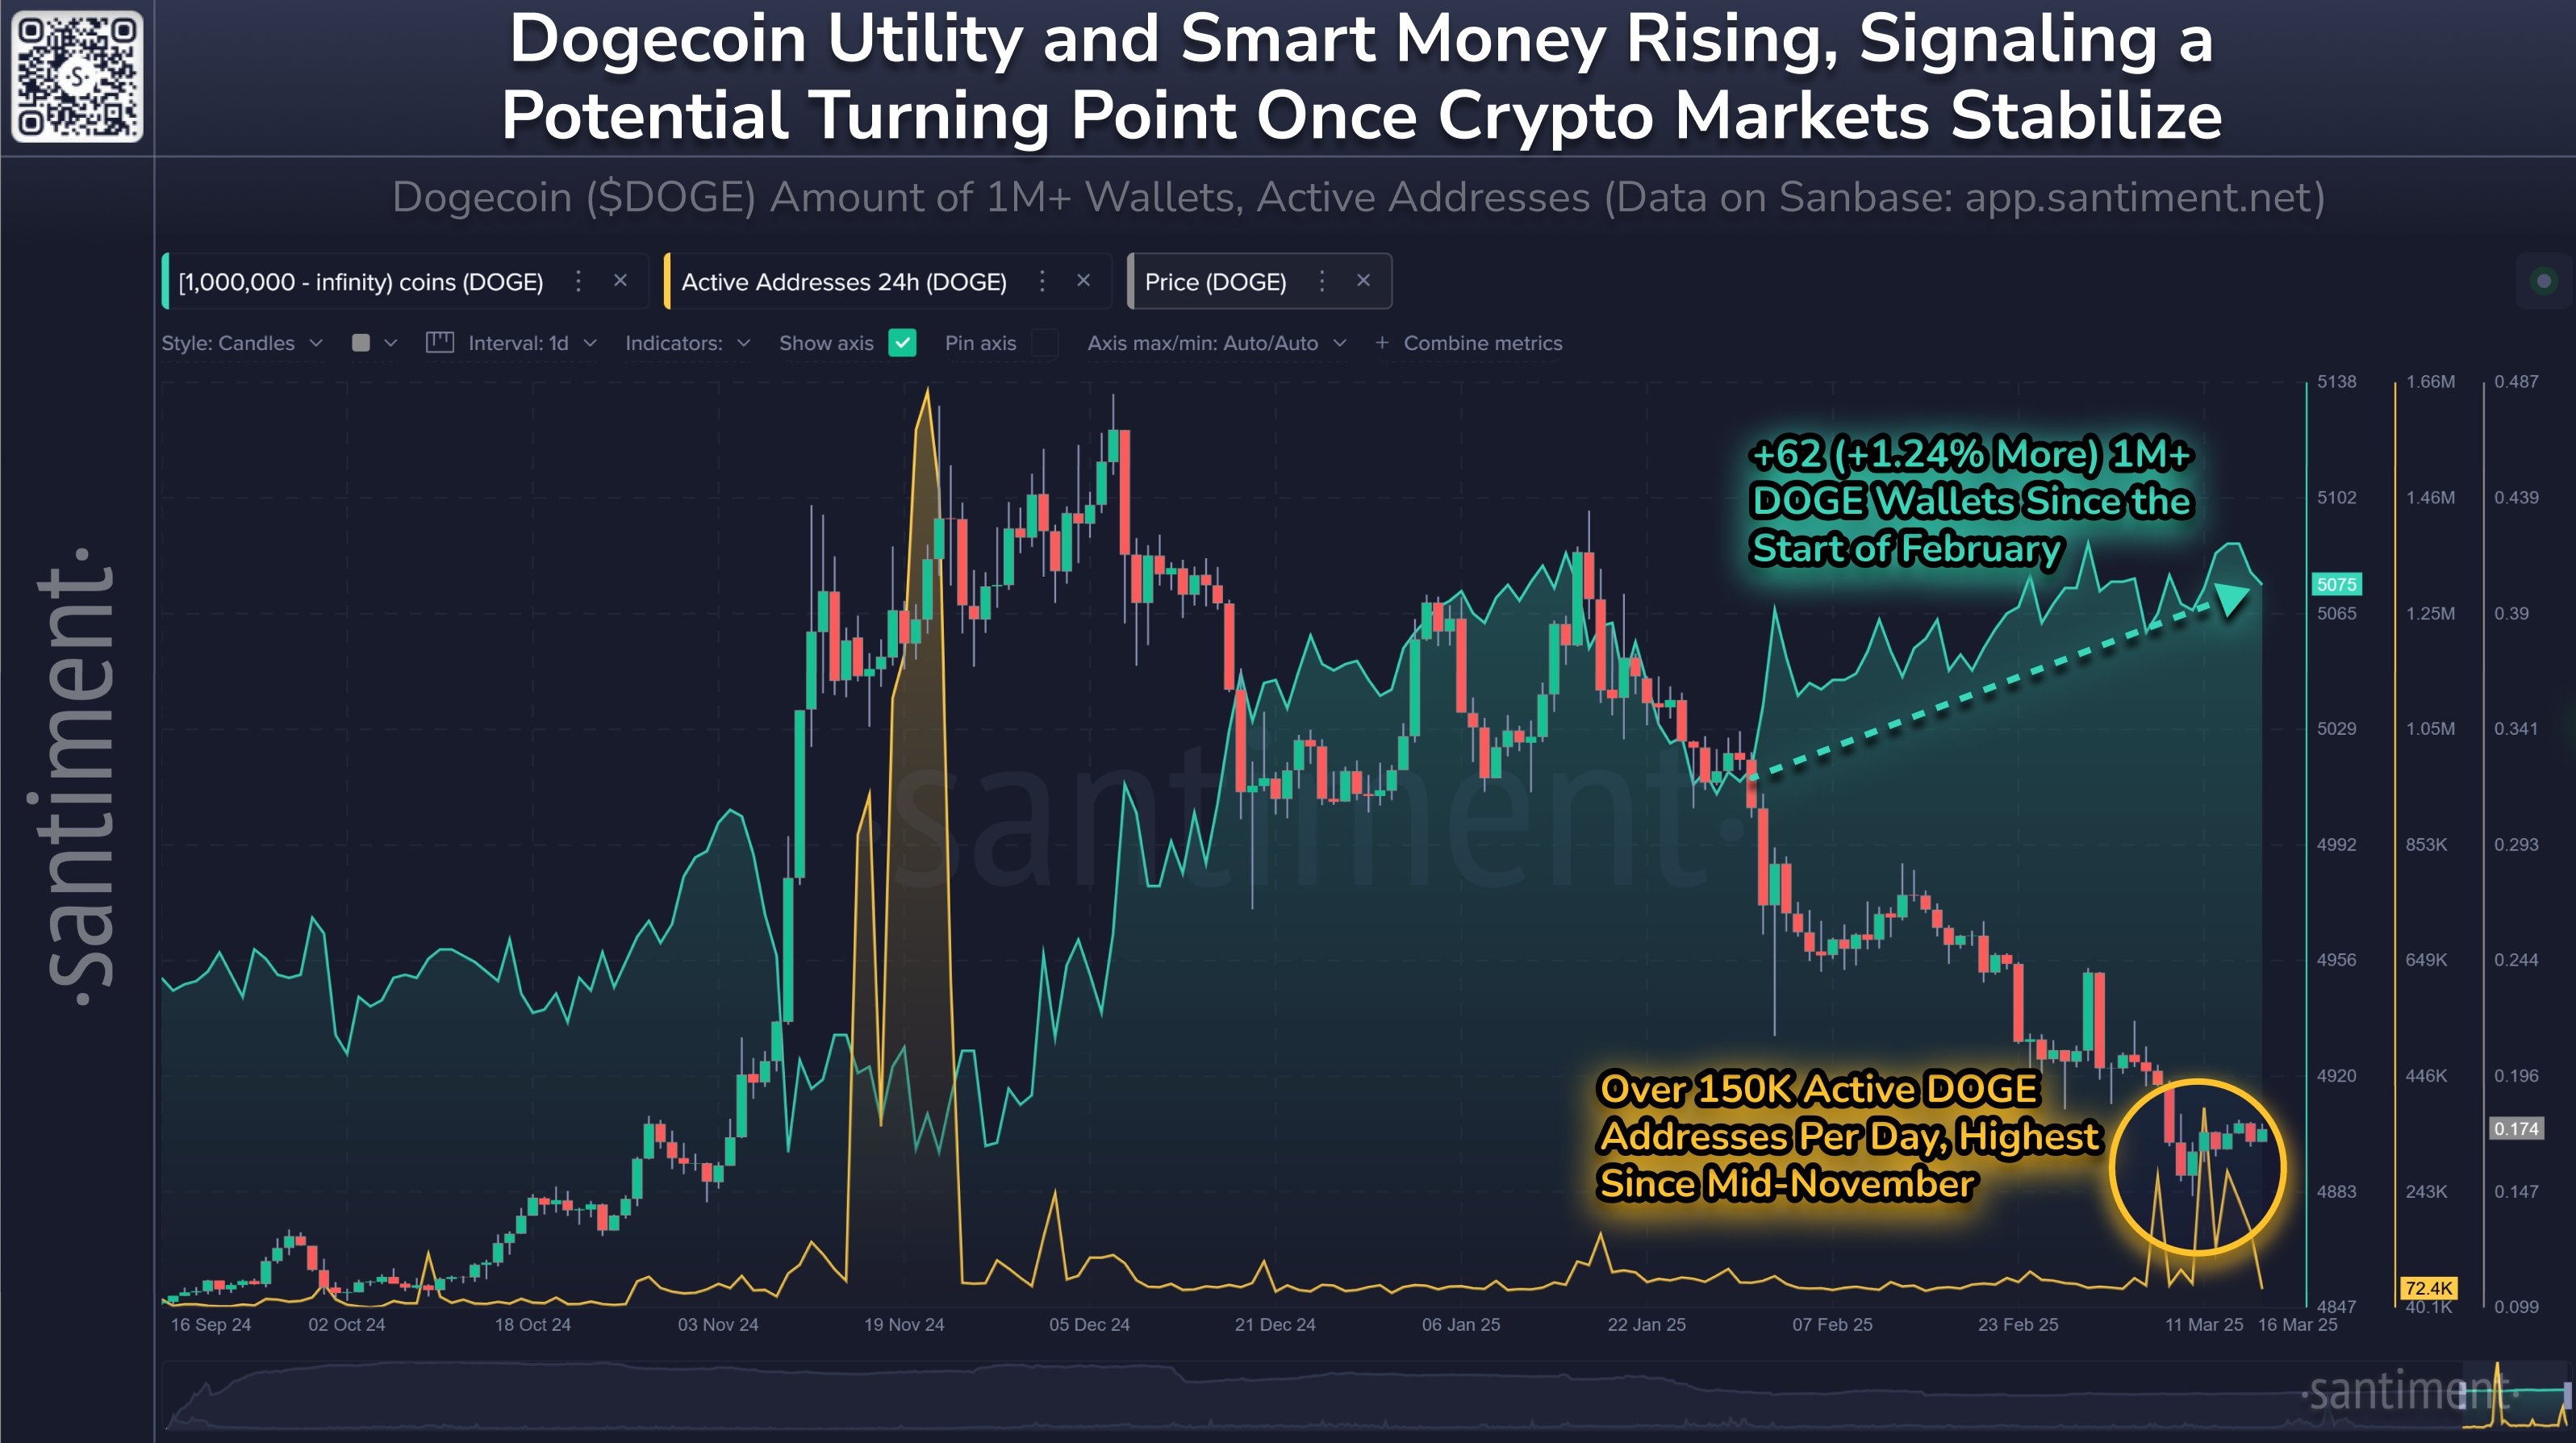
Dogecoin addresses holding at least a million DOGE vs. price. Source: Santiment
Dogecoinは、少なくとも100万人のDoge対価格を保持しています。出典:Santiment
This accumulation by large holders during a price decline often signals a belief in undervaluation and a strategic positioning for a future price increase. The rise in active addresses points to greater network engagement, potentially reflecting growing retail interest. If this increased user activity is driven by genuine adoption rather than speculation or panic selling, it could provide the on-chain support needed for a price recovery. A similar pattern preceded DOGE's substantial price rally in November.
価格下落中の大規模な保有者によるこの蓄積は、しばしば過小評価の信念と将来の価格上昇に対する戦略的な位置を示しています。 アクティブアドレスの増加は、小売の増加を反映している可能性があることを潜在的に反映していることを示しています。 この増加したユーザーアクティビティが、投機やパニックの販売ではなく、本物の採用によって駆動される場合、価格回復に必要なオンチェーンサポートを提供する可能性があります。 同様のパターンが、11月のDogeのかなりの価格集会に先行しました。
Oversold Conditions Suggest Potential for a 30% Rally
売られすぎた状態は、30%の集会の可能性を示唆しています
Dogecoin is currently testing key support levels, including a multi-year ascending trendline and the 200-week exponential moving average (EMA) around $0.13. Historically, these levels have triggered strong bullish reversals.
DogeCoinは現在、複数年の上昇トレンドラインや200週間の指数移動平均(EMA)が0.13ドル前後の主要なサポートレベルをテストしています。 歴史的に、これらのレベルは強い強気の逆転を引き起こしました。
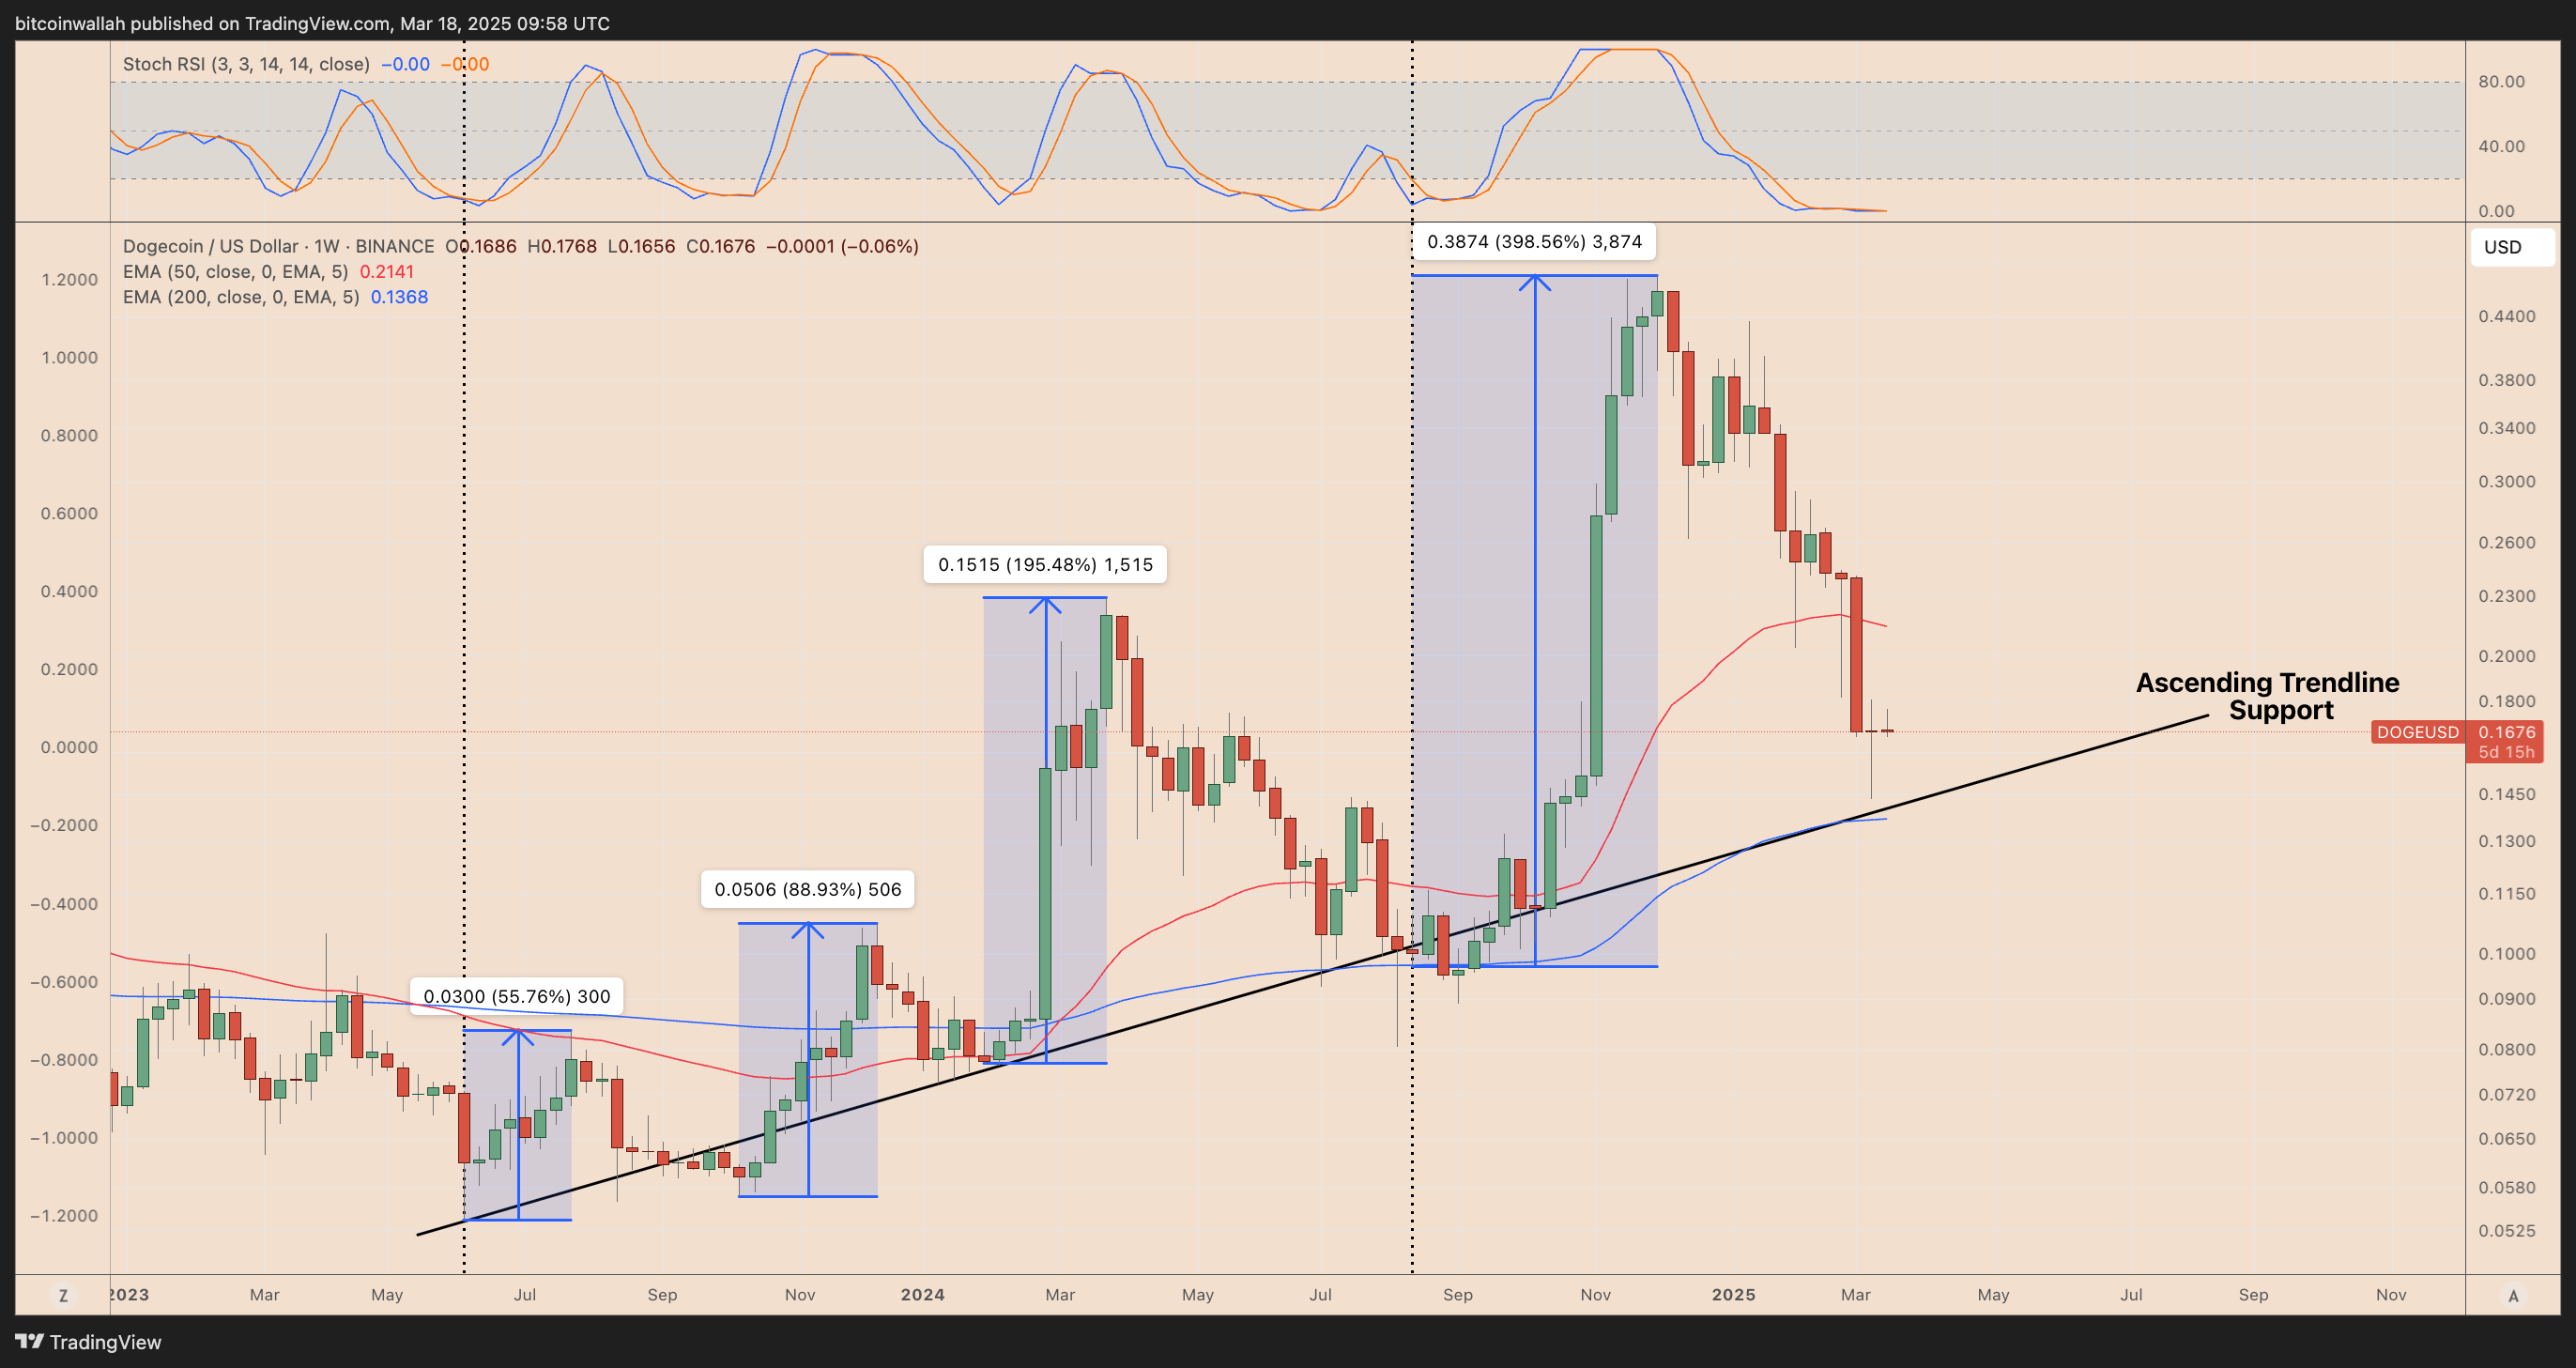
DOGE/USD weekly price chart. Source: TradingView
Doge/USD毎週の価格チャート。出典:TradingView
Furthermore, the Stochastic RSI, a momentum indicator, shows a bullish crossover in the oversold region (below 0.30). This often signals weakening selling pressure. In previous instances, this low-level crossover in DOGE has preceded significant price recoveries, including a 400% rally in 2024 and an 88% gain in 2023.
さらに、運動量指標である確率的RSIは、売られた地域で強気のクロスオーバーを示しています(0.30未満)。 これは、多くの場合、販売圧力を弱めることを示しています。 以前の例では、Dogeのこの低レベルのクロスオーバーは、2024年の400%の集会や2023年の88%の増加を含む、大幅な価格回復に先行しています。
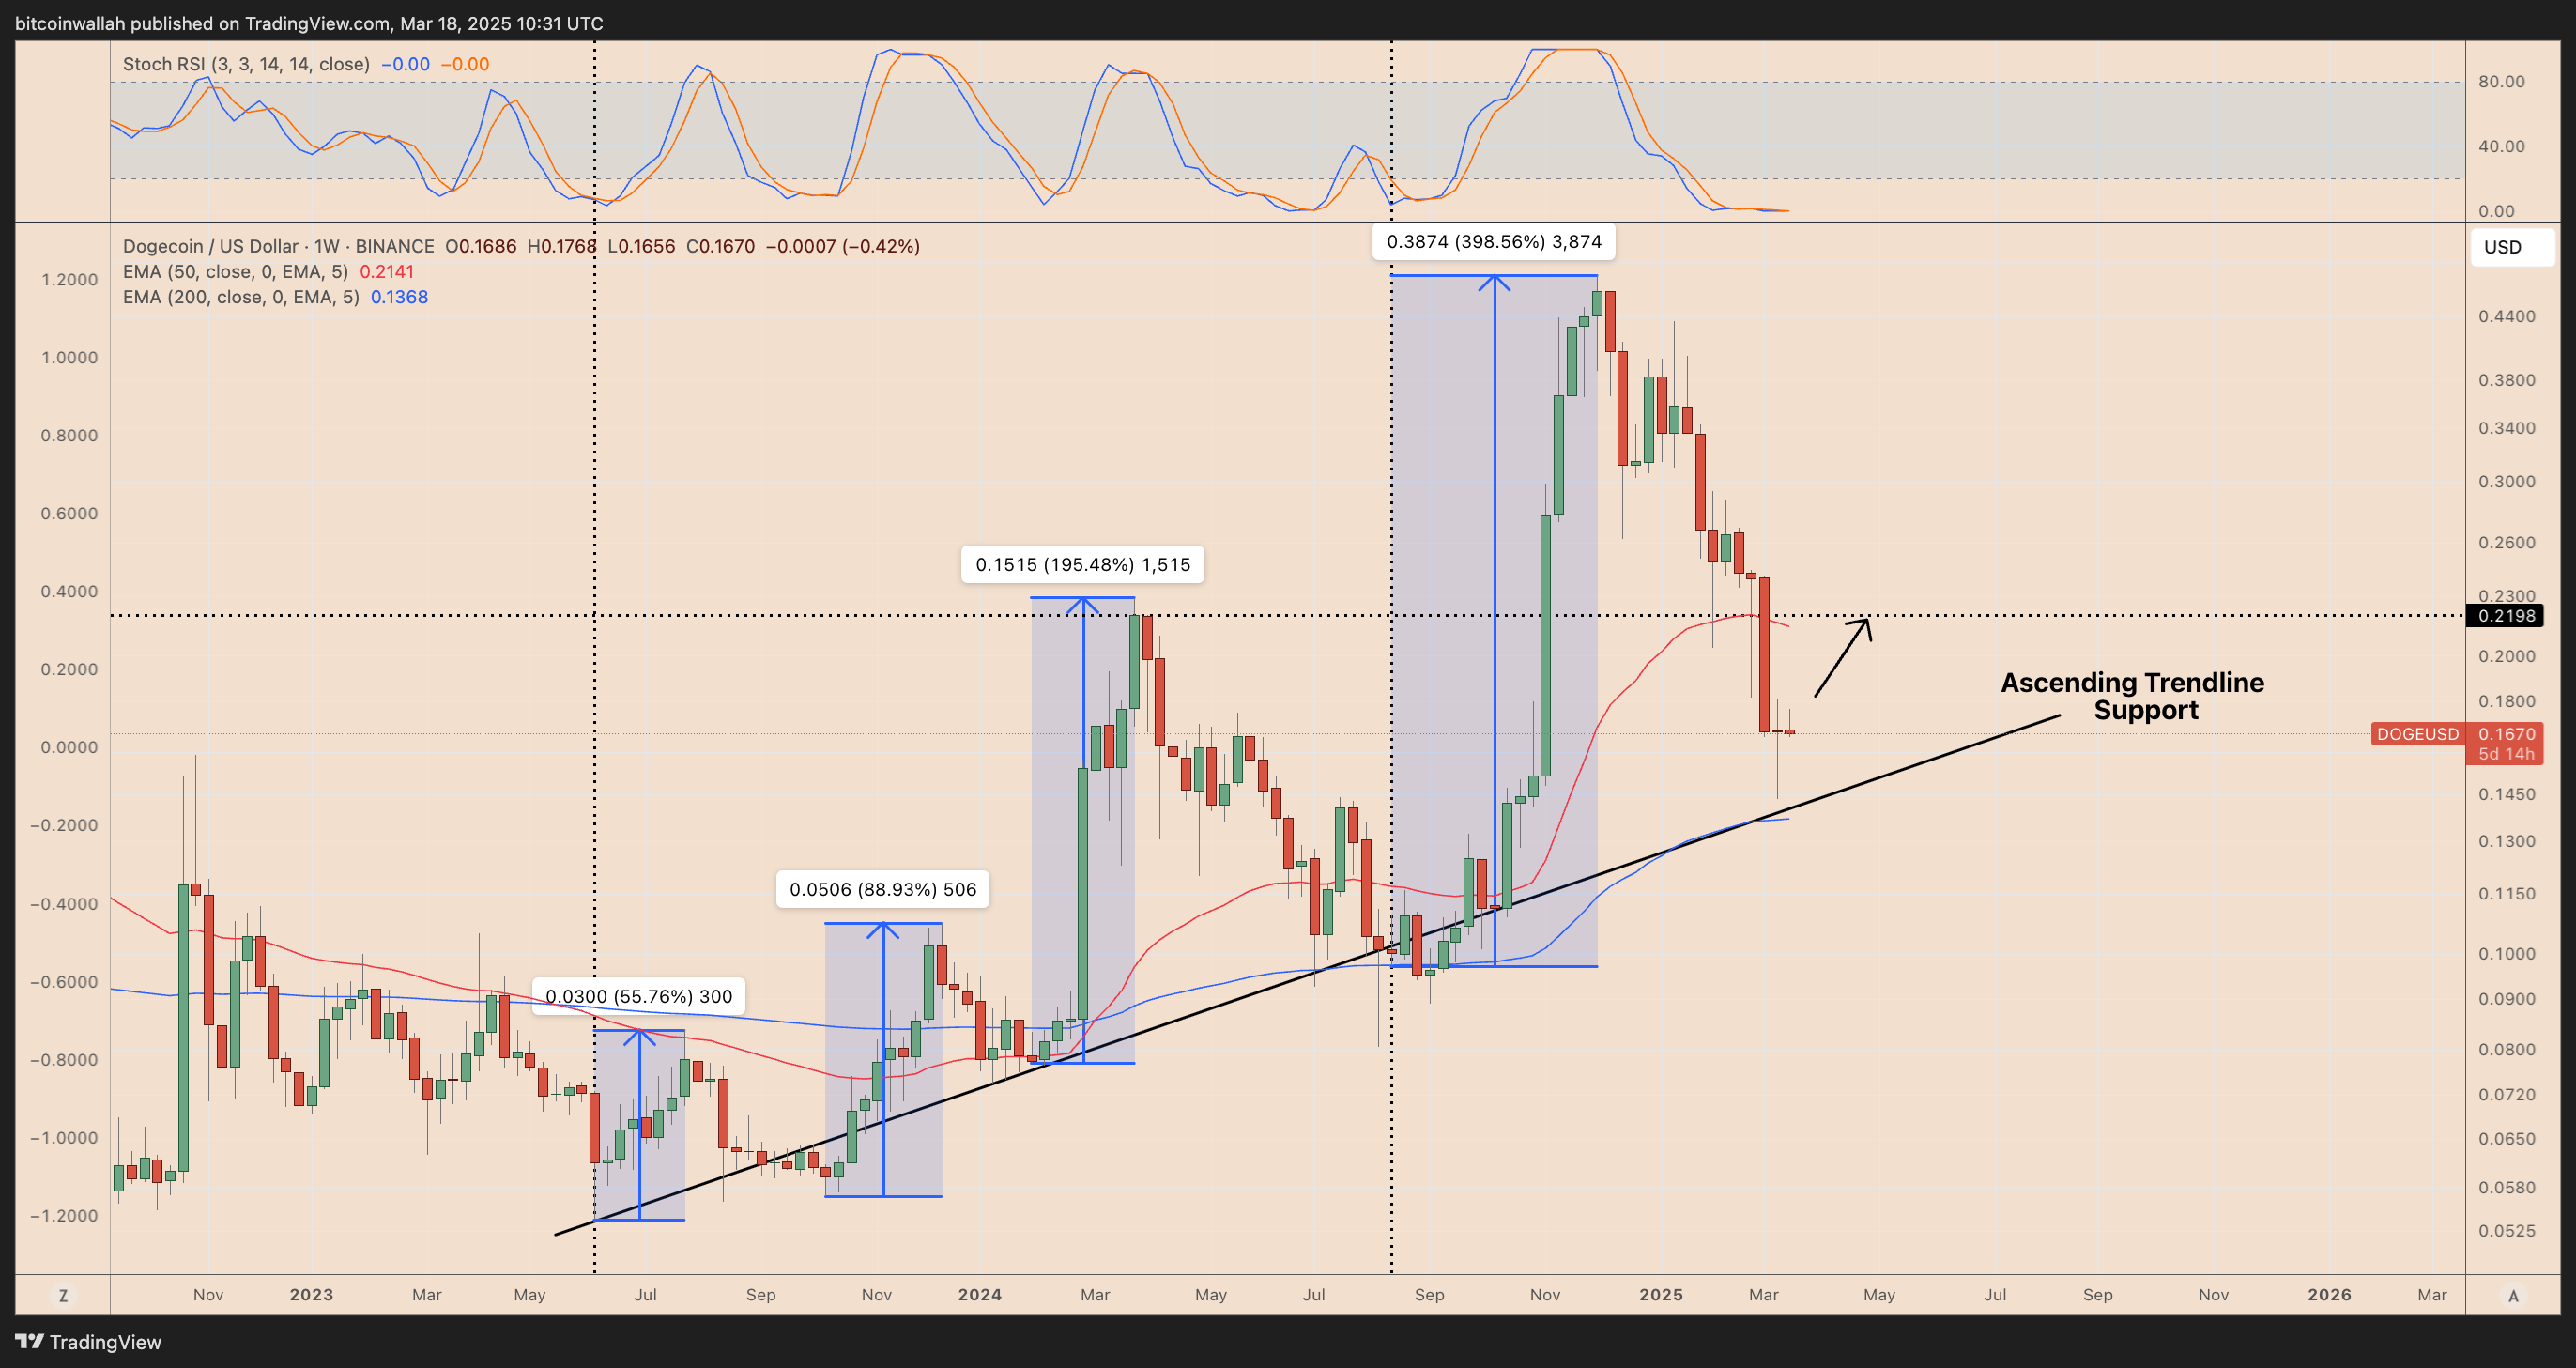
DOGE/USD weekly price chart. Source: TradingView
Doge/USD毎週の価格チャート。出典:TradingView
The primary resistance level is around $0.22, coinciding with the 50-week EMA and the March-April 2024 resistance area. However, failure to hold the current support levels could invalidate this bullish outlook, potentially leading to a further correction towards $0.12, a support level observed in March-May 2024.
主な抵抗レベルは約0.22ドルで、50週間のEMAと2024年4月と4月のレジスタンスエリアと一致しています。 ただし、現在のサポートレベルを保持できないと、この強気の見通しを無効にする可能性があり、2024年3月に観察されたサポートレベルである0.12ドルへのさらなる修正につながる可能性があります。
Disclaimer: This article does not provide investment advice. All investment and trading decisions involve risk, and readers should conduct their own thorough research before making any investment choices.
免責事項:この記事は投資アドバイスを提供していません。 すべての投資と取引の決定にはリスクが含まれ、読者は投資を選択する前に独自の徹底的な調査を行う必要があります。
 DogeHome
 Crypto Daily™
 Cryptopolitan
 BlockchainReporter
 CoinsProbe
 CryptoPotato_News
 CoinsProbe
 IT Times


