

Dogecoin (DOGE) experienced a significant price drop, falling over 70% after reaching $0.48 in December 2024. Interestingly, despite this decline, large Dogecoin holders have been accumulating, suggesting confidence in a potential price rebound.
Dogecoin(Doge)的价格大幅下降,在2024年12月达到0.48美元后下降了70%以上。有趣的是,尽管有这种下降,但大型Dogecoin持有人仍在积累,表明对潜在的价格篮板有信心。
On-Chain Data Hints at a Dogecoin Price Rebound
链上数据暗示Dogecoin价格反弹
On-chain data from Santiment reveals that wallets holding at least 1 million DOGE have increased by 1.24% since early February, even amidst falling prices. Concurrently, active addresses have reached a four-month high, indicating increased network activity.
Santiment的链链数据表明,自2月初以来,至少有100万个门槛的钱包增长了1.24%,甚至价格下降。 同时,主动地址达到了四个月的高度,表明网络活动增加。
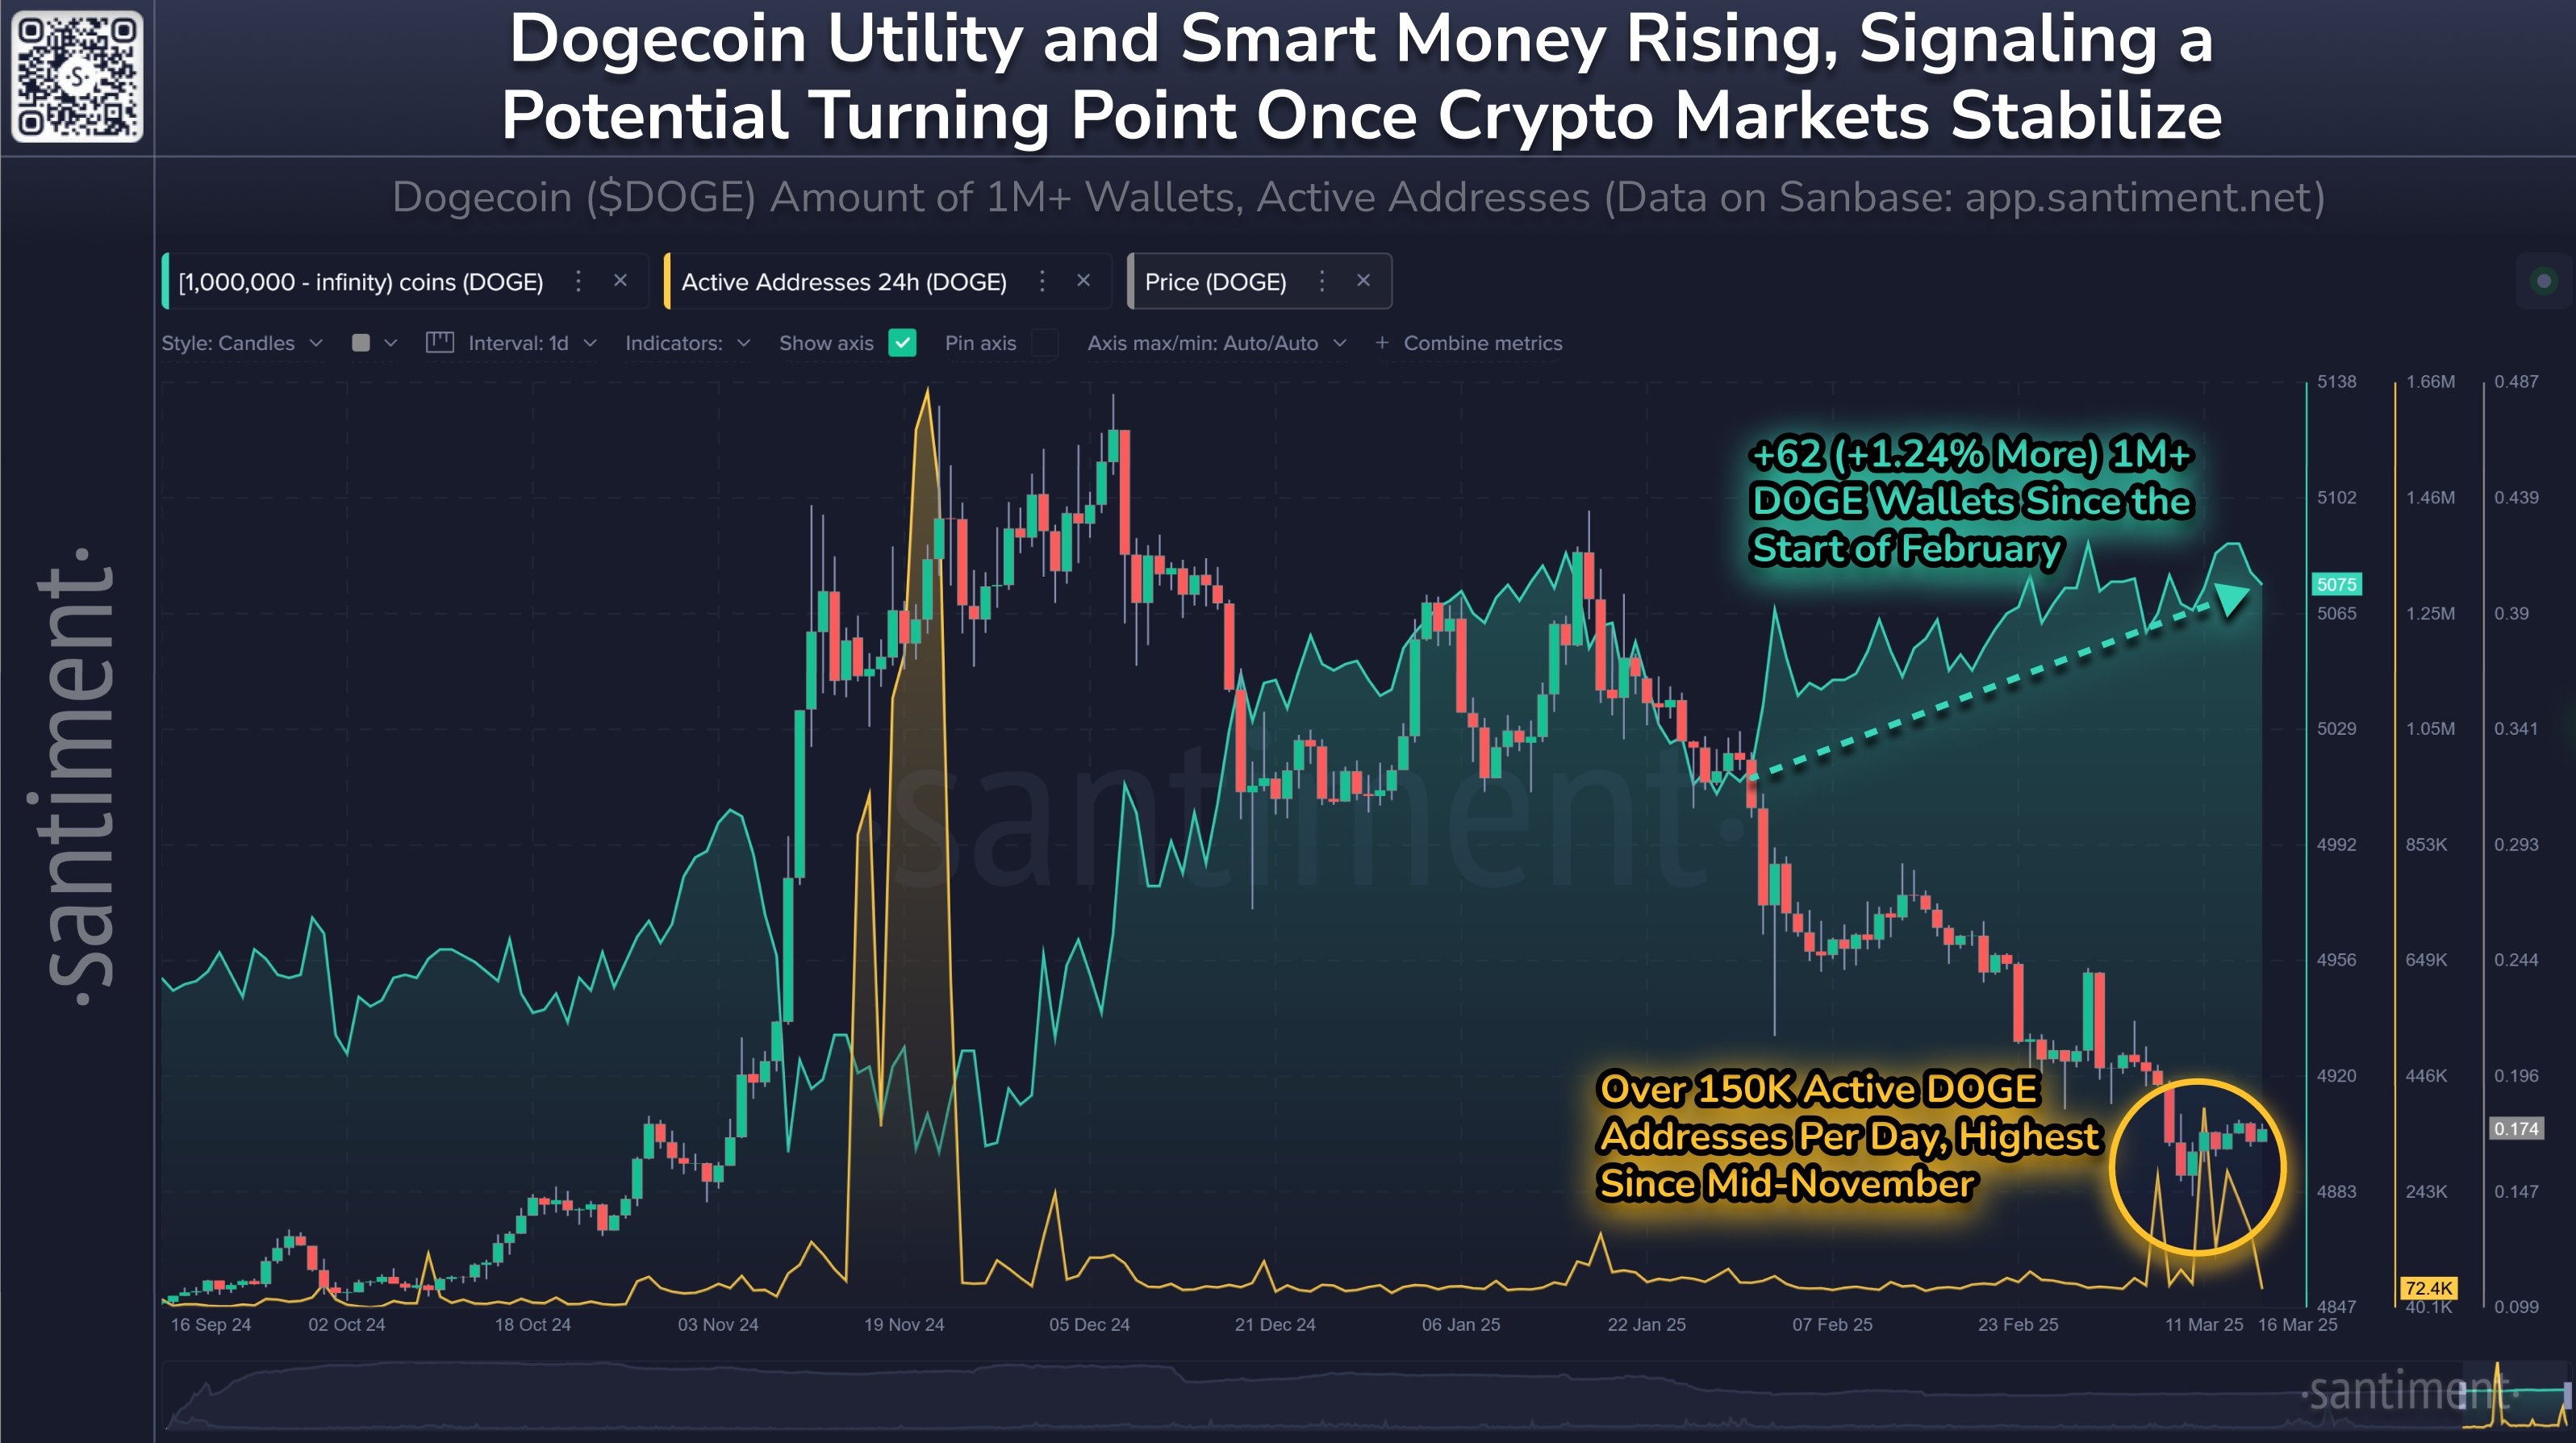
Dogecoin addresses holding at least a million DOGE vs. price. Source: Santiment
Dogecoin解决至少一百万个门槛与价格的地址。资料来源:santiment
This accumulation by large holders during a price decline often signals a belief in undervaluation and a strategic positioning for a future price increase. The rise in active addresses points to greater network engagement, potentially reflecting growing retail interest. If this increased user activity is driven by genuine adoption rather than speculation or panic selling, it could provide the on-chain support needed for a price recovery. A similar pattern preceded DOGE's substantial price rally in November.
大型持有人在价格下跌期间的积累通常表示信念低估和对未来价格上涨的战略定位。 主动地址的上升指向了更大的网络参与,可能反映出零售不断增长的利益。 如果这种增加的用户活动是由真正的采用而不是投机或恐慌销售驱动的,则可以提供价格回收所需的链子支持。 类似的模式是在11月Doge的实质性价格集会之前。
Oversold Conditions Suggest Potential for a 30% Rally
超售条件表明可能有30%的集会
Dogecoin is currently testing key support levels, including a multi-year ascending trendline and the 200-week exponential moving average (EMA) around $0.13. Historically, these levels have triggered strong bullish reversals.
Dogecoin目前正在测试关键支持水平,包括多年的上升趋势线和200周的指数移动平均线(EMA)约为0.13美元。 从历史上看,这些水平引发了强烈的看涨逆转。
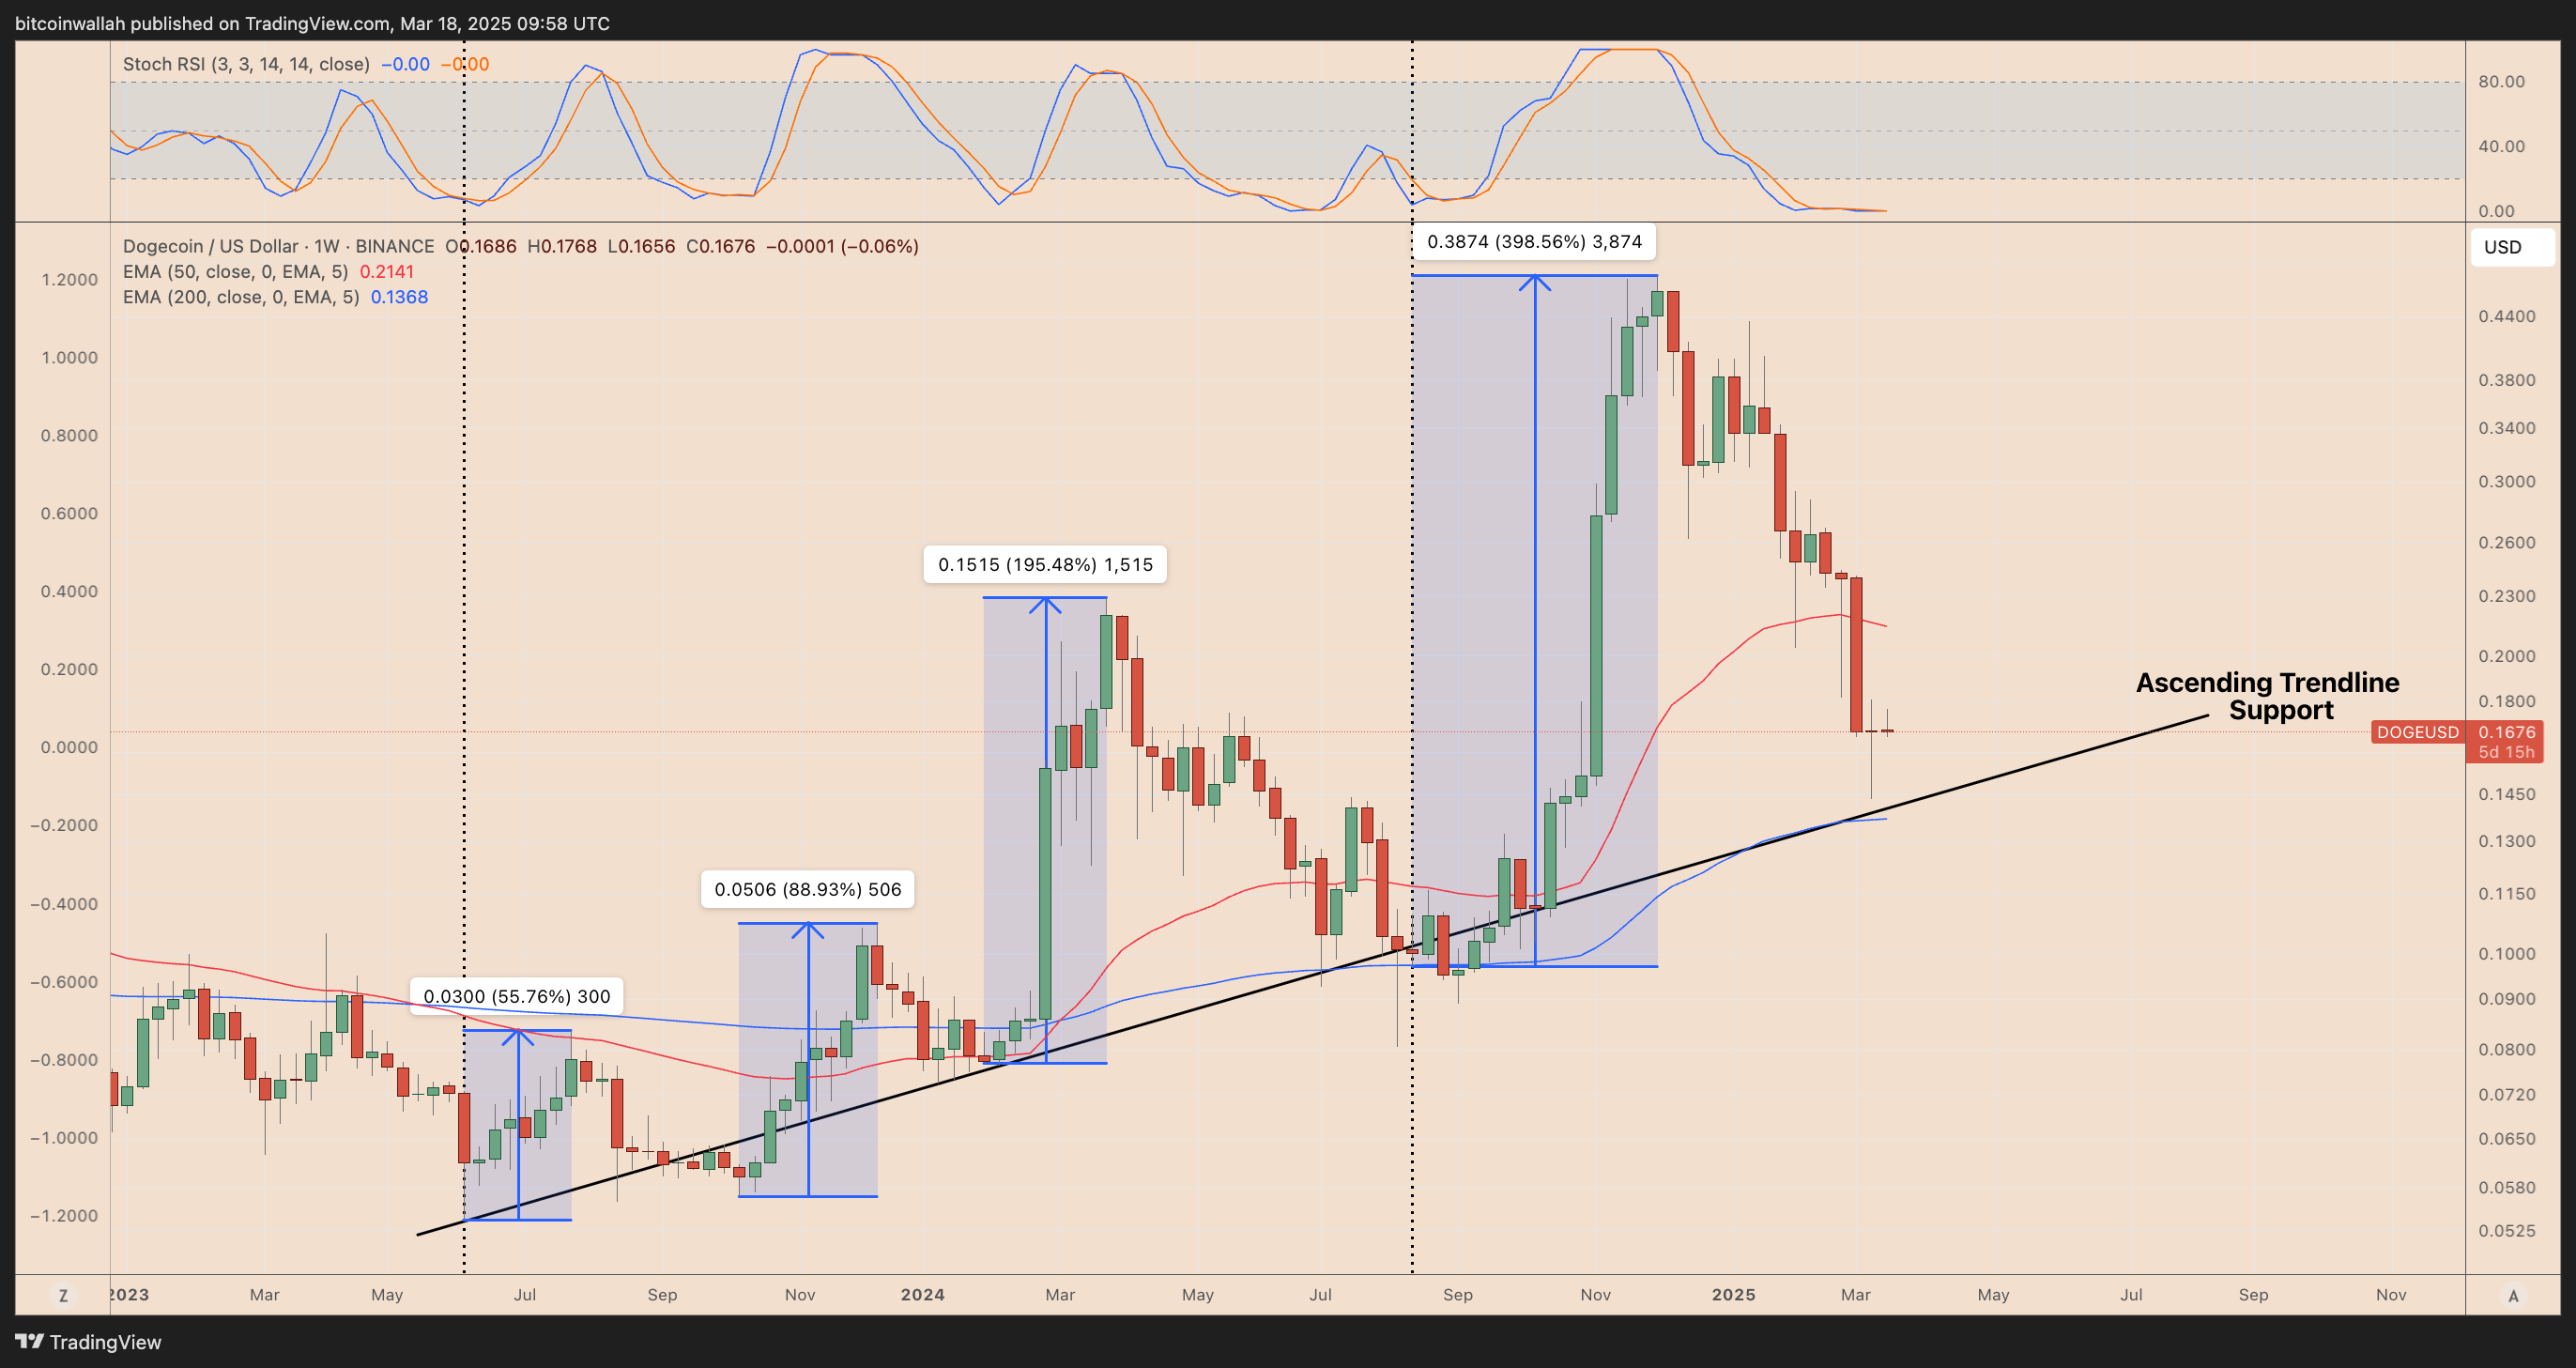
DOGE/USD weekly price chart. Source: TradingView
DOGE/USD每周价格图表。资料来源:TradingView
Furthermore, the Stochastic RSI, a momentum indicator, shows a bullish crossover in the oversold region (below 0.30). This often signals weakening selling pressure. In previous instances, this low-level crossover in DOGE has preceded significant price recoveries, including a 400% rally in 2024 and an 88% gain in 2023.
此外,随机RSI是一个动量指标,显示了超售区的看涨跨界(低于0.30)。 这通常标志着减弱销售压力。 在以前的情况下,在总督里的这种低级跨界已经进行了大量的价格回收率,包括2024年的400%集会和2023年的88%收益。
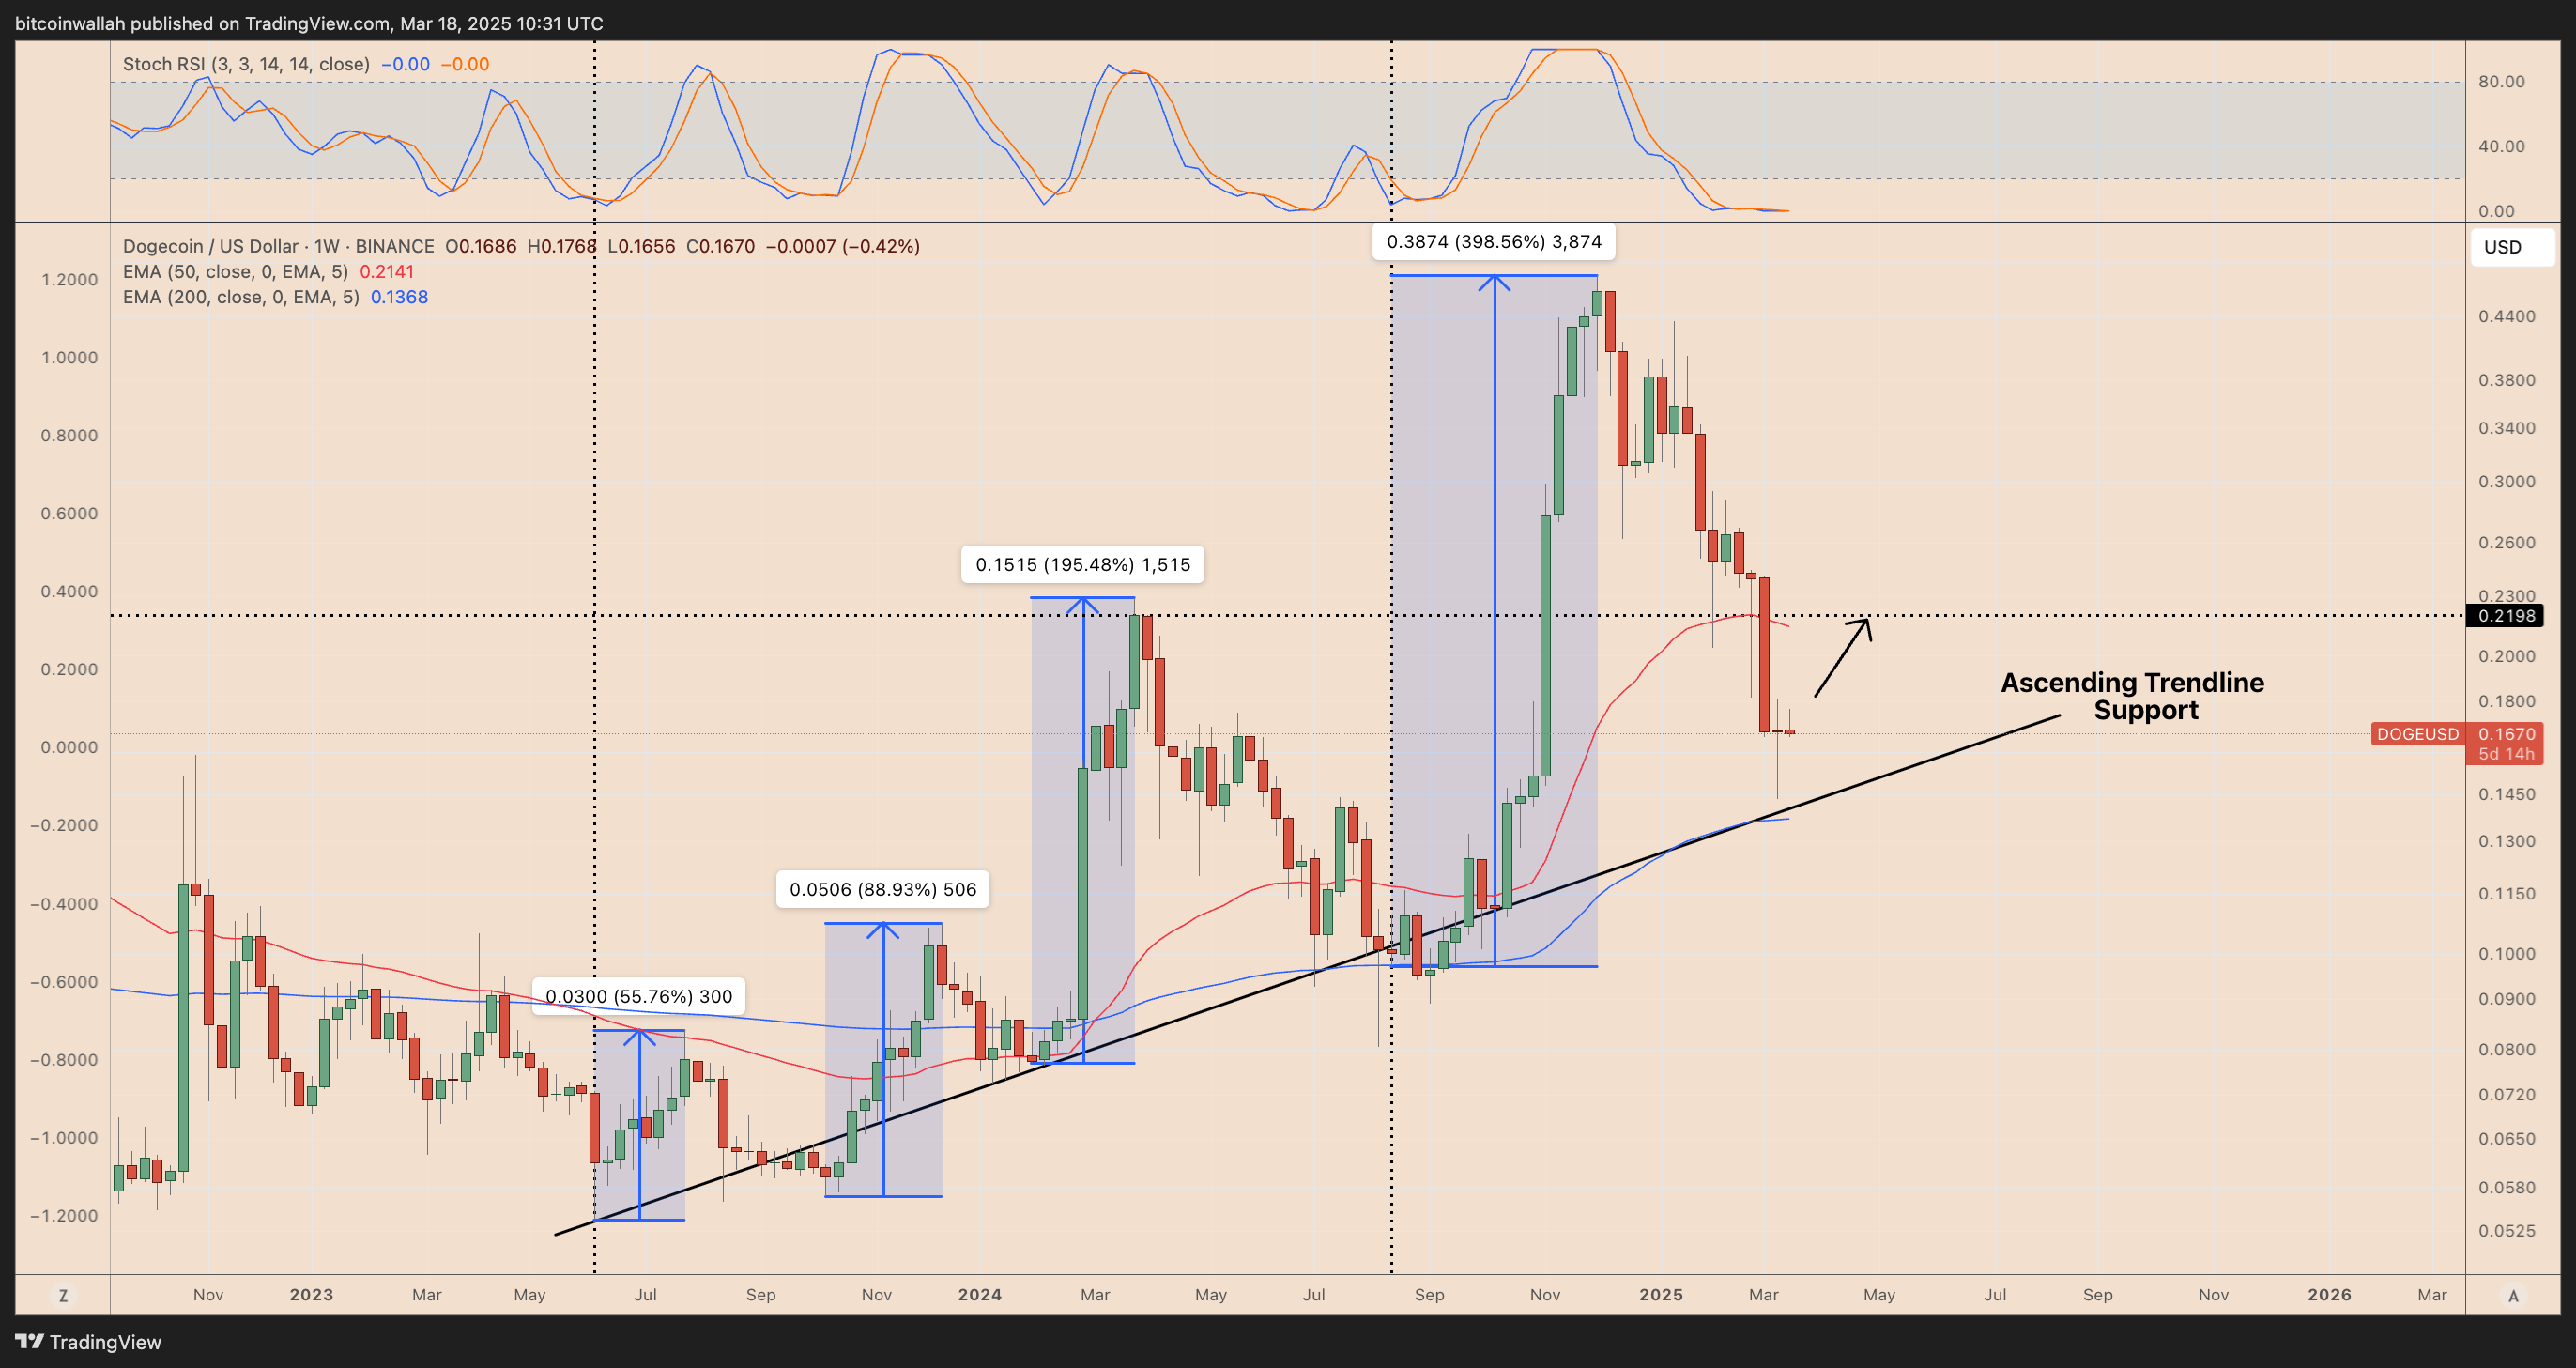
DOGE/USD weekly price chart. Source: TradingView
DOGE/USD每周价格图表。资料来源:TradingView
The primary resistance level is around $0.22, coinciding with the 50-week EMA and the March-April 2024 resistance area. However, failure to hold the current support levels could invalidate this bullish outlook, potentially leading to a further correction towards $0.12, a support level observed in March-May 2024.
主要阻力水平约为0.22美元,与50周的EMA和2024年3月至4月的电阻区相吻合。 但是,未能保持当前的支持水平可能使这种看涨的前景无效,这可能导致进一步的纠正到0.12美元,这是2024年3月至5月的支持水平。
Disclaimer: This article does not provide investment advice. All investment and trading decisions involve risk, and readers should conduct their own thorough research before making any investment choices.
免责声明:本文不提供投资建议。 所有投资和交易决策都涉及风险,读者应在做出任何投资选择之前进行自己的彻底研究。
 CoinsProbe
 CoinPedia News
 DogeHome
 Crypto Daily™
 Crypto Daily™
 CoinPedia News
 Crypto Daily™
 The Bitcoin Daily


