Dogecoin (DOGE) has made an impressive increase of 28.8%, climbing from $0.075 to a recent peak of $0.091 during the past two weeks. This price surge has been supported by the positive investor sentiment, which is fueled by Dogecoin’s recent association with various space programs. During this ascent, DOGE price broke above the resistance trend line of a long-standing triangle formation, indicating a potential trend reversal.
Dogecoin(DOGE)은 지난 2주 동안 0.075달러에서 최근 최고치인 0.091달러로 상승하여 28.8%의 인상적인 증가세를 보였습니다. 이러한 가격 급등은 Dogecoin의 최근 다양한 우주 프로그램과의 연관성에 힘입어 긍정적인 투자 심리에 의해 뒷받침되었습니다. 이 상승 기간 동안 DOGE 가격은 오랫동안 지속된 삼각형 형성의 저항 추세선을 넘어섰으며 이는 잠재적인 추세 반전을 나타냅니다.
Dogecoin Price Analysis
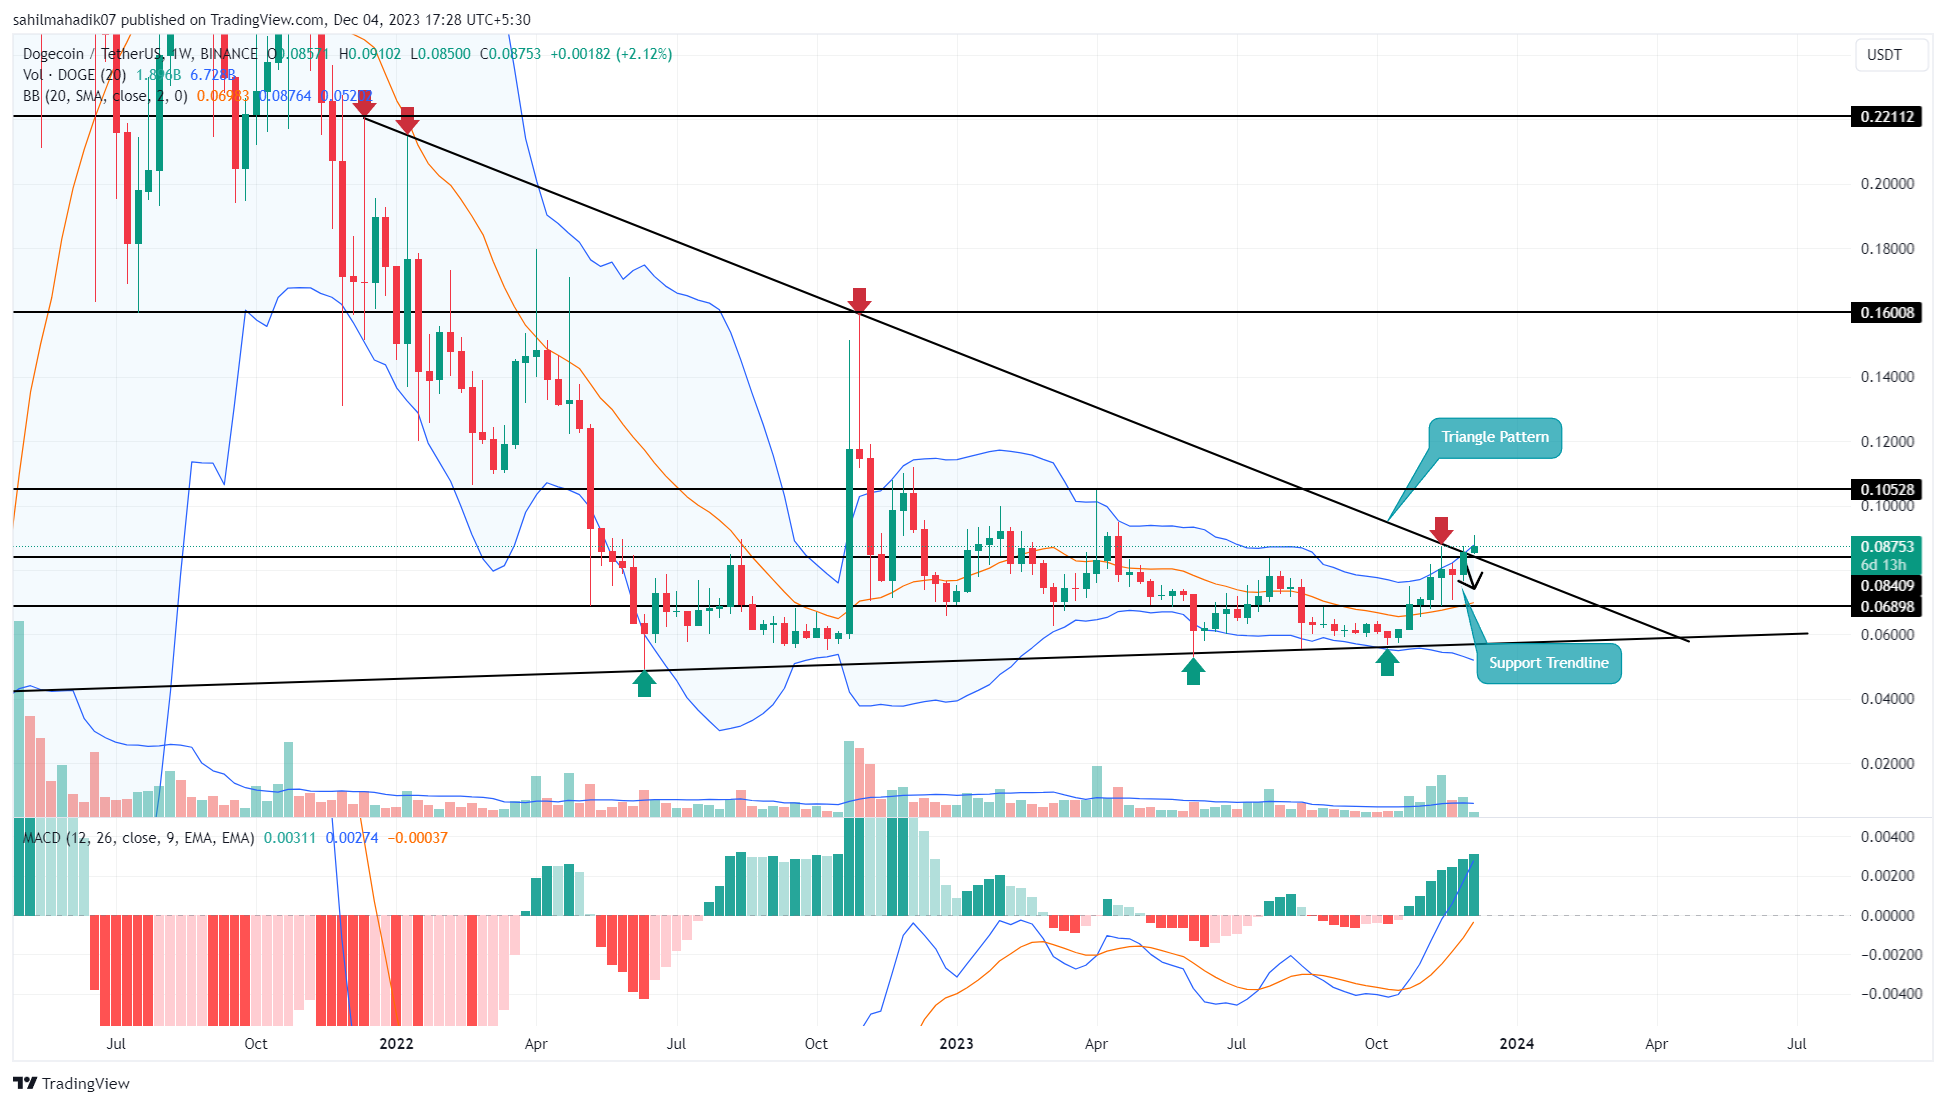
For over two years, Dogecoin’s price has been trapped between the converging trend lines of a symmetrical triangle formation. This chart pattern has put the altcoin into a prolonged consolidation phase following a significant downtrend from May 2021 to May 2022.
2년 넘게 Dogecoin의 가격은 대칭 삼각형 형태의 수렴 추세선 사이에 갇혀 있었습니다. 이 차트 패턴은 2021년 5월부터 2022년 5월까지 상당한 하락세를 보인 후 알트코인을 장기적인 통합 단계에 놓이게 했습니다.

Indeed, as the cryptocurrency market has gradually entered a recovery mode, DOGE price has experienced a strong rally since mid-October. The price surged from $0.0572 to $0.089, registering a growth of 55% in just two months.
Particularly on December 2nd, buyers caused a significant change in market sentiment by pushing the price above the upper boundary of the triangle formation on the chart. According to the logic of the formation, each high swing that tests the upper trend line can serve as a target for the triangle formation, potentially leading to a significant increase of 78.84% in the trajectory of DOGE price towards $0.22. However, there are resistance levels at $0.105 and then $0.132 in this expected rally.
Dogecoin and Bitcoin Price Performance
Dogecoin과 비트코인 가격 성과
Compared to Bitcoin, both cryptocurrencies have seen significant recovery in their prices in the past two weeks. While Bitcoin’s price has consistently risen, Dogecoin’s price trajectory occasionally experiences pullbacks. Therefore, DOGE investors need to resist against these corrections and see them as buying opportunities.
The upward movement at the upper boundary of the Bollinger Band (BB) indicator in the daily timeframe price chart reflects the aggressive stance of buyers in the altcoin. Furthermore, the bullish crossover between the Moving Average Convergence Divergence (MACD) indicator and its signal line suggests an ongoing recovery in DOGE without any deterioration.
Continue Reading: https://en.coin-turk.com/dogecoin-price-analysis/계속 읽기: https://en.coin-turk.com/dogecoin-price-analytic


 BlockchainReporter
 DogeHome
 U_Today
 U_Today
 Optimisus
 Crypto Front News
 Cointribune
 CoinPedia News


