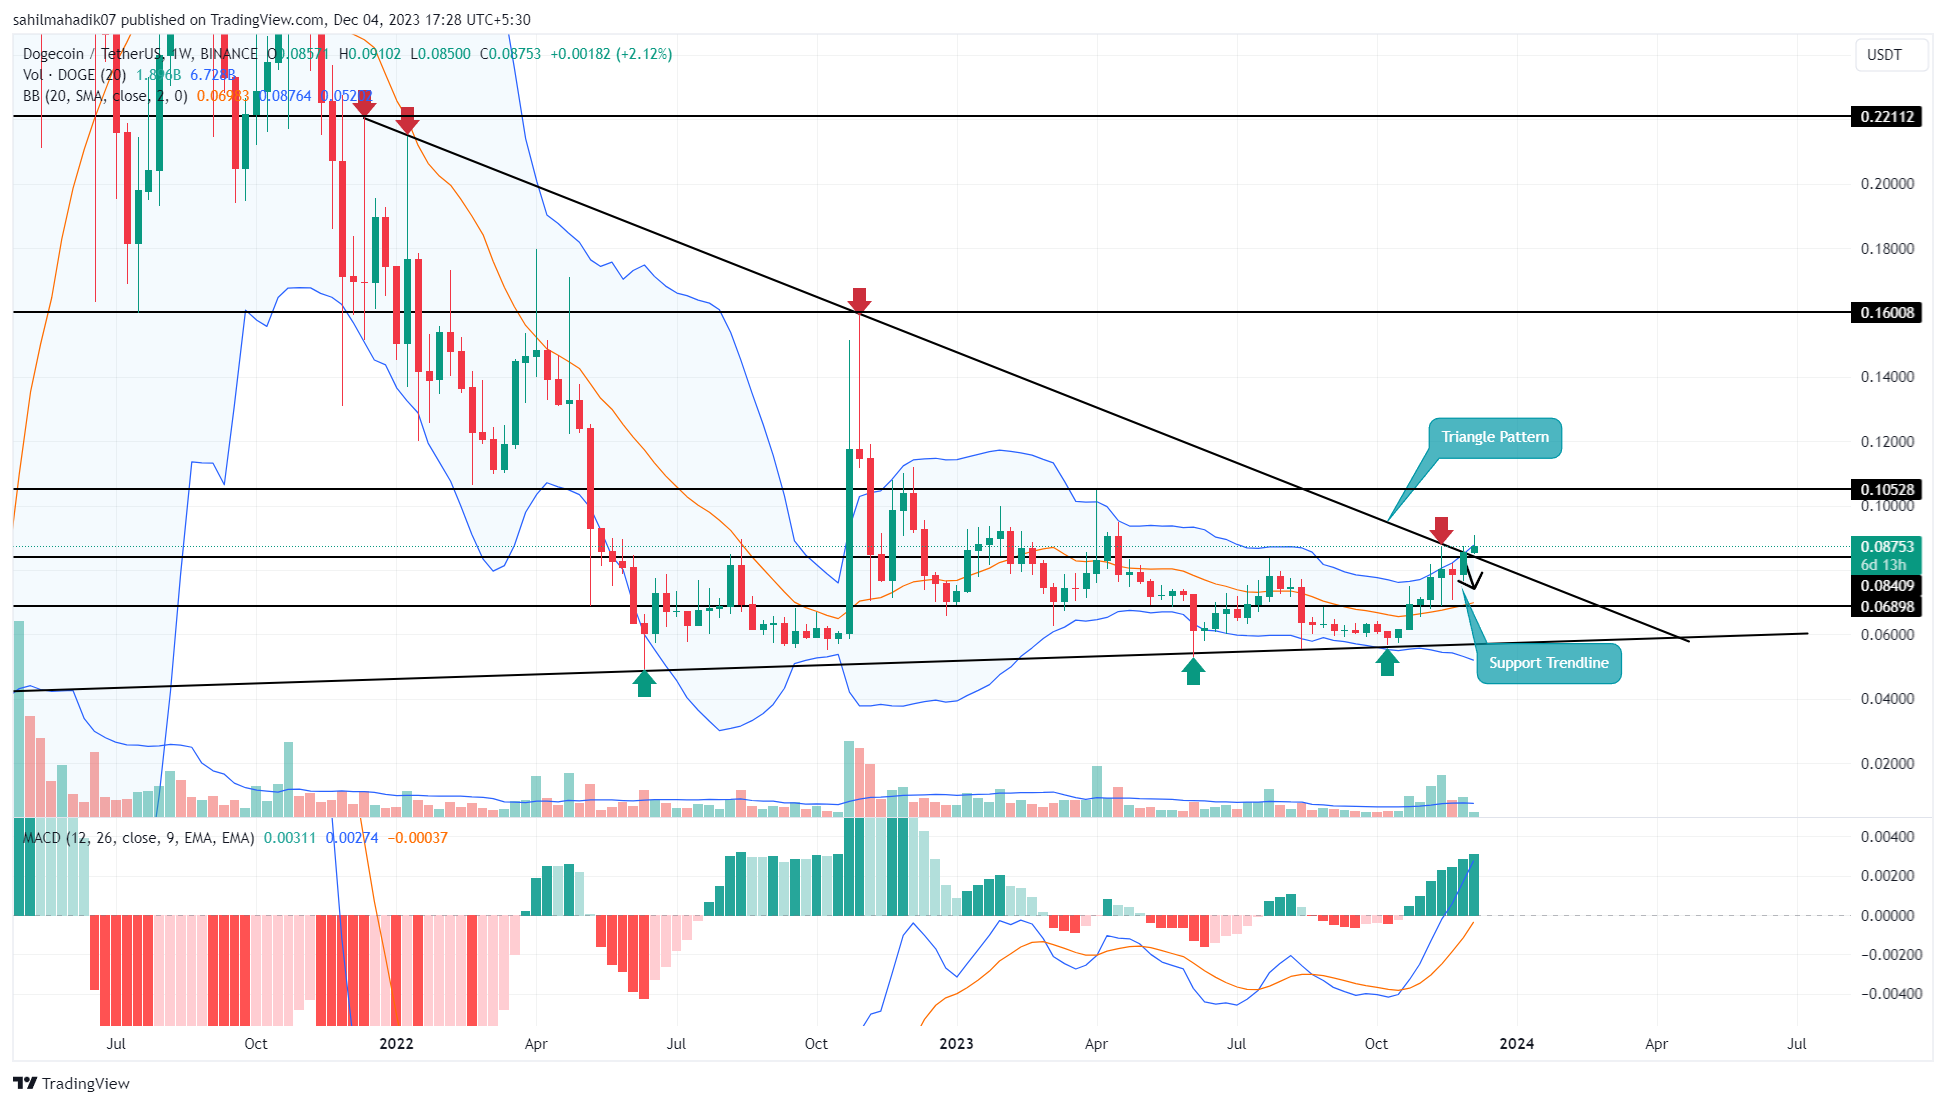
Dogecoin (DOGE) has made an impressive increase of 28.8%, climbing from $0.075 to a recent peak of $0.091 during the past two weeks. This price surge has been supported by the positive investor sentiment, which is fueled by Dogecoin’s recent association with various space programs. During this ascent, DOGE price broke above the resistance trend line of a long-standing triangle formation, indicating a potential trend reversal.
过去两周,狗狗币 (DOGE) 的涨幅令人印象深刻,上涨了 28.8%,从 0.075 美元攀升至最近的峰值 0.091 美元。狗狗币最近与各种太空计划的联系推动了积极的投资者情绪,这支撑了价格的上涨。在这次上涨过程中,DOGE 价格突破了长期三角形形态的阻力趋势线,表明潜在的趋势逆转。
Dogecoin Price Analysis
狗狗币价格分析
For over two years, Dogecoin’s price has been trapped between the converging trend lines of a symmetrical triangle formation. This chart pattern has put the altcoin into a prolonged consolidation phase following a significant downtrend from May 2021 to May 2022.
两年多来,狗狗币的价格一直被困在对称三角形的汇聚趋势线之间。在 2021 年 5 月至 2022 年 5 月的大幅下跌趋势之后,这种图表模式使山寨币进入了长期盘整阶段。

Indeed, as the cryptocurrency market has gradually entered a recovery mode, DOGE price has experienced a strong rally since mid-October. The price surged from $0.0572 to $0.089, registering a growth of 55% in just two months.
确实,随着加密货币市场逐渐进入复苏模式,DOGE价格自10月中旬以来经历了强劲的上涨。价格从 0.0572 美元飙升至 0.089 美元,短短两个月内上涨了 55%。
Particularly on December 2nd, buyers caused a significant change in market sentiment by pushing the price above the upper boundary of the triangle formation on the chart. According to the logic of the formation, each high swing that tests the upper trend line can serve as a target for the triangle formation, potentially leading to a significant increase of 78.84% in the trajectory of DOGE price towards $0.22. However, there are resistance levels at $0.105 and then $0.132 in this expected rally.
特别是在 12 月 2 日,买家将价格推高到图表上三角形的上边界之上,导致市场情绪发生重大变化。根据该形态的逻辑,每次测试上方趋势线的高位波动都可以作为三角形形态的目标,有可能导致 DOGE 价格向 0.22 美元的轨迹大幅上涨 78.84%。然而,在这次预期的反弹中,阻力位为 0.105 美元,然后为 0.132 美元。
Dogecoin and Bitcoin Price Performance
狗狗币和比特币价格表现
Compared to Bitcoin, both cryptocurrencies have seen significant recovery in their prices in the past two weeks. While Bitcoin’s price has consistently risen, Dogecoin’s price trajectory occasionally experiences pullbacks. Therefore, DOGE investors need to resist against these corrections and see them as buying opportunities.
与比特币相比,这两种加密货币的价格在过去两周都出现了显着回升。虽然比特币的价格持续上涨,但狗狗币的价格轨迹偶尔会出现回调。因此,DOGE 投资者需要抵制这些调整,并将其视为买入机会。
The upward movement at the upper boundary of the Bollinger Band (BB) indicator in the daily timeframe price chart reflects the aggressive stance of buyers in the altcoin. Furthermore, the bullish crossover between the Moving Average Convergence Divergence (MACD) indicator and its signal line suggests an ongoing recovery in DOGE without any deterioration.
每日时间框架价格图表中布林带(BB)指标上边界的向上运动反映了山寨币买家的激进立场。此外,移动平均收敛分歧(MACD)指标与其信号线之间的看涨交叉表明 DOGE 正在持续复苏,且没有任何恶化。
Continue Reading: https://en.coin-turk.com/dogecoin-price-analysis/继续阅读:https://en.coin-turk.com/dogecoin-price-analysis/


 DogeHome
 TheCoinrise Media
 Thecoinrepublic.com
 TheCoinrise Media
 TheCoinrise Media
 Cryptopolitan_News
 Coin Edition
 BlockchainReporter


