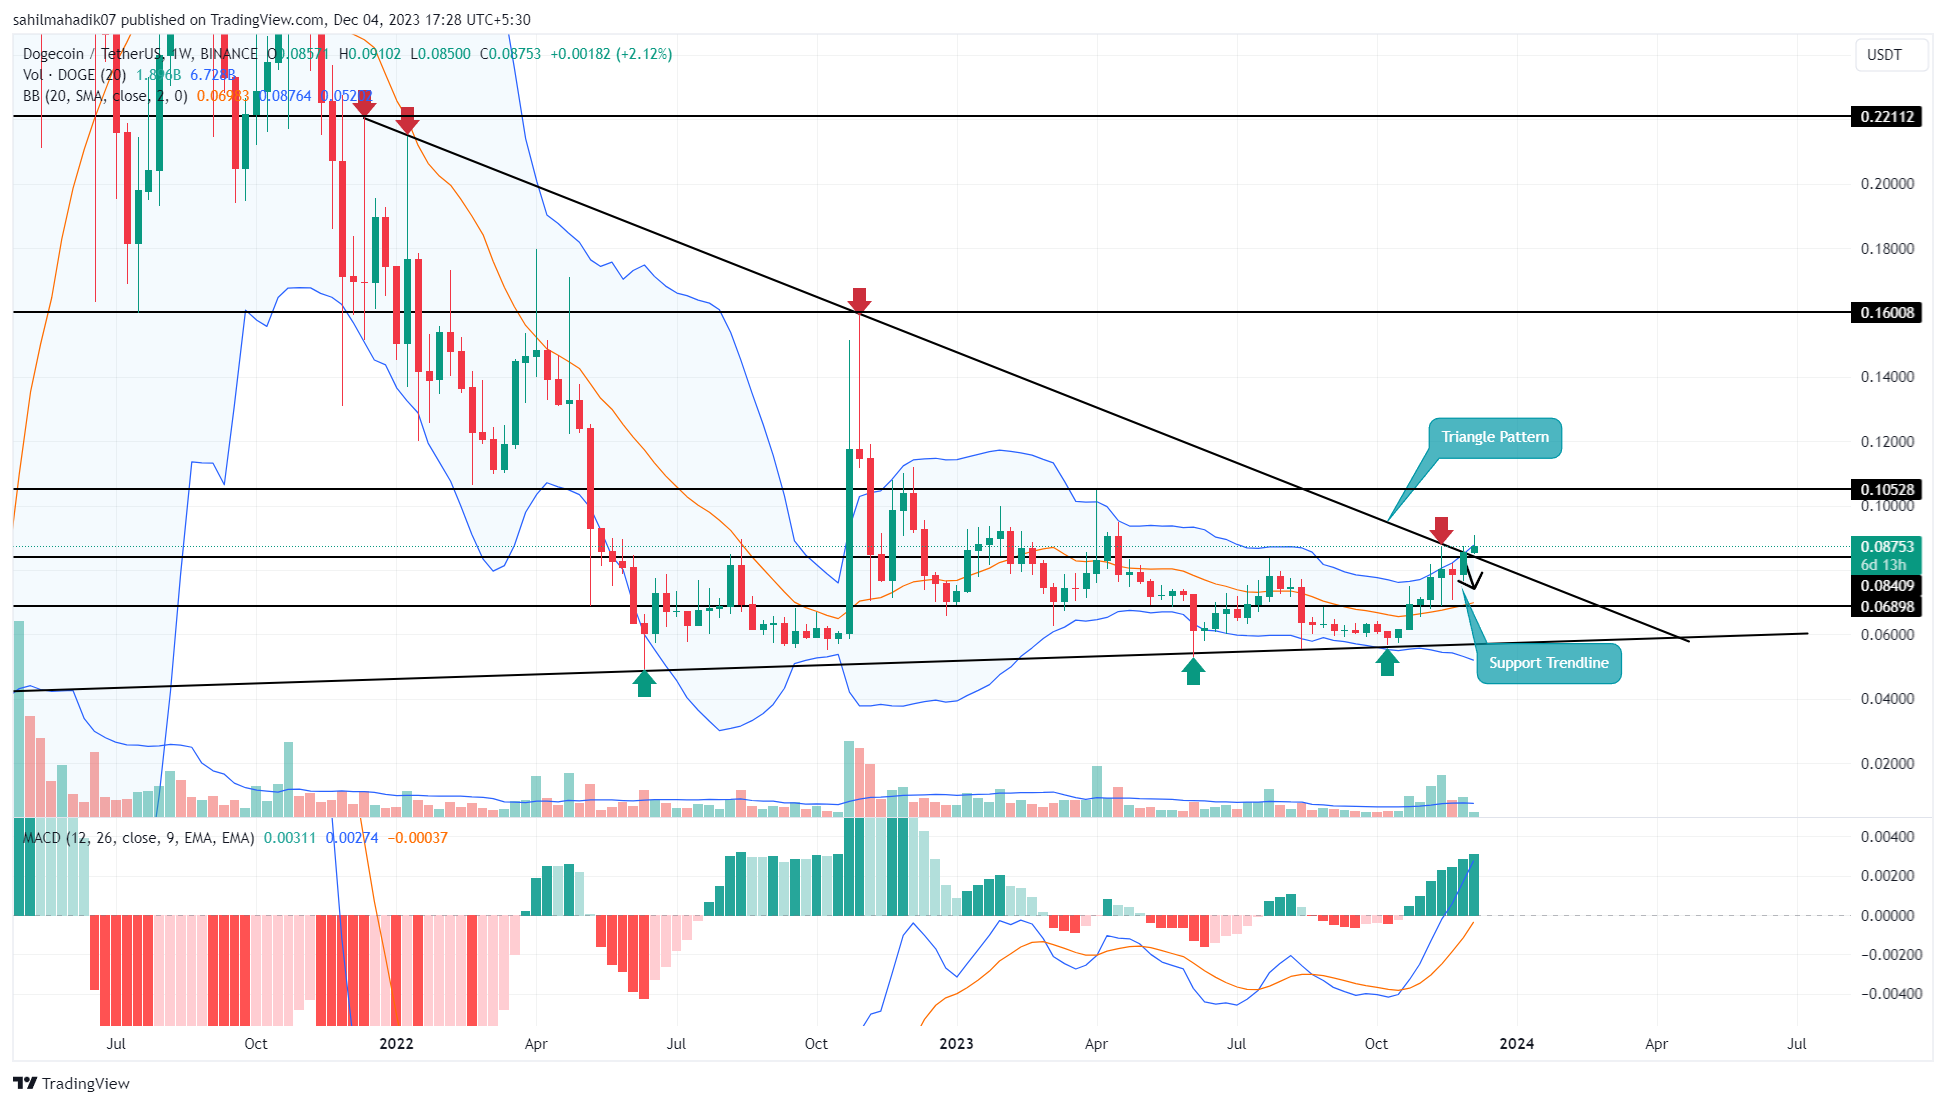
Dogecoin (DOGE) has made an impressive increase of 28.8%, climbing from $0.075 to a recent peak of $0.091 during the past two weeks. This price surge has been supported by the positive investor sentiment, which is fueled by Dogecoin’s recent association with various space programs. During this ascent, DOGE price broke above the resistance trend line of a long-standing triangle formation, indicating a potential trend reversal.
過去兩週,狗狗幣 (DOGE) 的漲幅令人印象深刻,上漲了 28.8%,從 0.075 美元攀升至最近的峰值 0.091 美元。狗狗幣最近與各種太空計畫的聯繫推動了積極的投資者情緒,這支撐了價格的上漲。在這次上漲過程中,DOGE 價格突破了長期三角形形態的阻力趨勢線,顯示潛在的趨勢逆轉。
Dogecoin Price Analysis
狗狗幣價格分析
For over two years, Dogecoin’s price has been trapped between the converging trend lines of a symmetrical triangle formation. This chart pattern has put the altcoin into a prolonged consolidation phase following a significant downtrend from May 2021 to May 2022.
兩年多來,狗狗幣的價格一直被困在對稱三角形的匯聚趨勢線之間。在 2021 年 5 月至 2022 年 5 月的大幅下跌趨勢之後,這種圖表模式使山寨幣進入了長期盤整階段。

Indeed, as the cryptocurrency market has gradually entered a recovery mode, DOGE price has experienced a strong rally since mid-October. The price surged from $0.0572 to $0.089, registering a growth of 55% in just two months.
確實,隨著加密貨幣市場逐漸進入復甦模式,DOGE價格自10月中旬以來經歷了強勁的上漲。價格從 0.0572 美元飆升至 0.089 美元,短短兩個月內上漲了 55%。
Particularly on December 2nd, buyers caused a significant change in market sentiment by pushing the price above the upper boundary of the triangle formation on the chart. According to the logic of the formation, each high swing that tests the upper trend line can serve as a target for the triangle formation, potentially leading to a significant increase of 78.84% in the trajectory of DOGE price towards $0.22. However, there are resistance levels at $0.105 and then $0.132 in this expected rally.
特別是在 12 月 2 日,買家將價格推高到圖表上三角形的上邊界之上,導致市場情緒發生重大變化。根據該形態的邏輯,每次測試上方趨勢線的高位波動都可以作為三角形形態的目標,有可能導致 DOGE 價格向 0.22 美元的軌跡大幅上漲 78.84%。然而,在這次預期的反彈中,阻力位為 0.105 美元,然後為 0.132 美元。
Dogecoin and Bitcoin Price Performance
狗狗幣和比特幣價格表現
Compared to Bitcoin, both cryptocurrencies have seen significant recovery in their prices in the past two weeks. While Bitcoin’s price has consistently risen, Dogecoin’s price trajectory occasionally experiences pullbacks. Therefore, DOGE investors need to resist against these corrections and see them as buying opportunities.
與比特幣相比,這兩種加密貨幣的價格在過去兩週都出現了顯著回升。雖然比特幣的價格持續上漲,但狗狗幣的價格軌跡偶爾會出現回檔。因此,DOGE 投資者需要抵制這些調整,並將其視為買入機會。
The upward movement at the upper boundary of the Bollinger Band (BB) indicator in the daily timeframe price chart reflects the aggressive stance of buyers in the altcoin. Furthermore, the bullish crossover between the Moving Average Convergence Divergence (MACD) indicator and its signal line suggests an ongoing recovery in DOGE without any deterioration.
每日時間框架價格圖表中布林通道(BB)指標上邊界的向上移動反映了山寨幣買家的激進立場。此外,移動平均收斂分歧(MACD)指標與其訊號線之間的看漲交叉表明 DOGE 正在持續復甦,且沒有任何惡化。
Continue Reading: https://en.coin-turk.com/dogecoin-price-analysis/繼續閱讀:https://en.coin-turk.com/dogecoin-price-analysis/


 DogeHome
 U_Today
 U_Today
 Optimisus
 Crypto Front News
 Cointribune
 CoinPedia News
 CoinoMedia


