You can also read this news on COINTURK NEWS: Dogecoin Price Trends Upward in 2024
COINTURK NEWS: 2024년 Dogecoin 가격 동향 상승에서도 이 소식을 읽을 수 있습니다.
Dogecoin price followed an upward trend in 2024, reaching a notable formation’s resistance trend line in chart analysis. This movement was also observed by analysts as Dogecoin’s second attempt to surge. Will Dogecoin succeed at this point? We examine this with detailed chart analysis, significant support and resistance levels, and expert opinions.
Dogecoin 가격은 2024년 상승 추세를 따라 차트 분석에서 주목할만한 형태의 저항 추세선에 도달했습니다. 이 움직임은 분석가들에 의해 Dogecoin의 두 번째 급등 시도로도 관찰되었습니다. 이 시점에서 Dogecoin이 성공할 수 있을까요? 상세한 차트 분석, 중요한 지지 및 저항 수준, 전문가 의견을 바탕으로 이를 검토합니다.
Weekly DOGE Chart Analysis
주간 DOGE 차트 분석
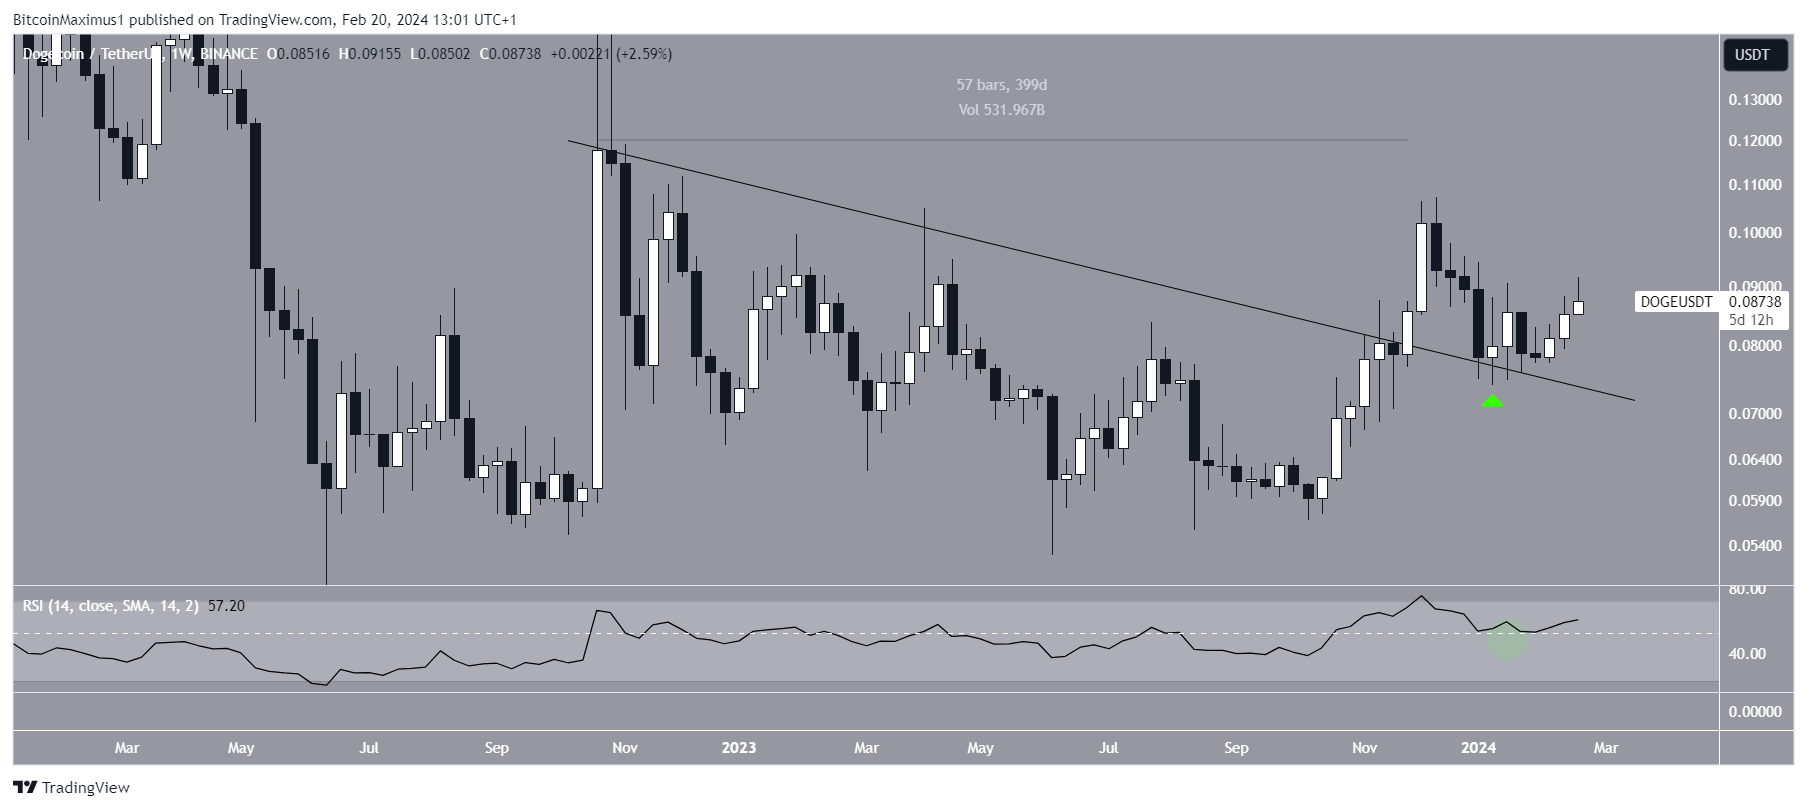
The weekly chart’s technical analysis shows that the DOGE price broke out from a decreasing resistance trend line in November 2023. The trend line had been in focus for 400 days before the breakout. DOGE reached a high level of $0.107 before the decline. However, the DOGE price jumped at the resistance trend line in January 2024 and showed an increase despite being below the highest level of 2023. The weekly Relative Strength Index (RSI) supports the continuation of this rise.
주간 차트의 기술적 분석에 따르면 DOGE 가격은 2023년 11월 감소하는 저항 추세선에서 벗어났습니다. 추세선은 돌파 전 400일 동안 집중되었습니다. DOGE는 하락하기 전에 $0.107라는 높은 수준에 도달했습니다. 그러나 DOGE 가격은 2024년 1월 저항 추세선으로 급등하여 2023년 최고 수준을 밑돌았음에도 불구하고 상승세를 보였습니다. 주간 상대강도지수(RSI)는 이러한 상승의 지속을 뒷받침합니다.
RSI is a momentum indicator that investors follow with interest, as it helps them assess whether a market is overbought or oversold and whether an asset will be accumulated or sold.
RSI는 시장이 과매수 또는 과매도 상태인지, 자산이 축적되거나 매도되는지 여부를 평가하는 데 도움이 되므로 투자자가 관심을 가지고 따르는 모멘텀 지표입니다.
RSI readings above 50 and an upward trend indicate that bulls are still at an advantage, while readings below 50 suggest the opposite. When the price jumped at the resistance trend line, the RSI rose above 50 (green circle), supporting the movement.
RSI 수치가 50을 넘고 상승 추세는 강세가 여전히 유리하다는 것을 의미하는 반면, 50 미만은 그 반대를 의미합니다. 가격이 저항 추세선에서 급등하자 RSI가 50(녹색 원) 위로 상승하여 움직임을 뒷받침했습니다.

Daily DOGE Chart Analysis
일일 DOGE 차트 분석
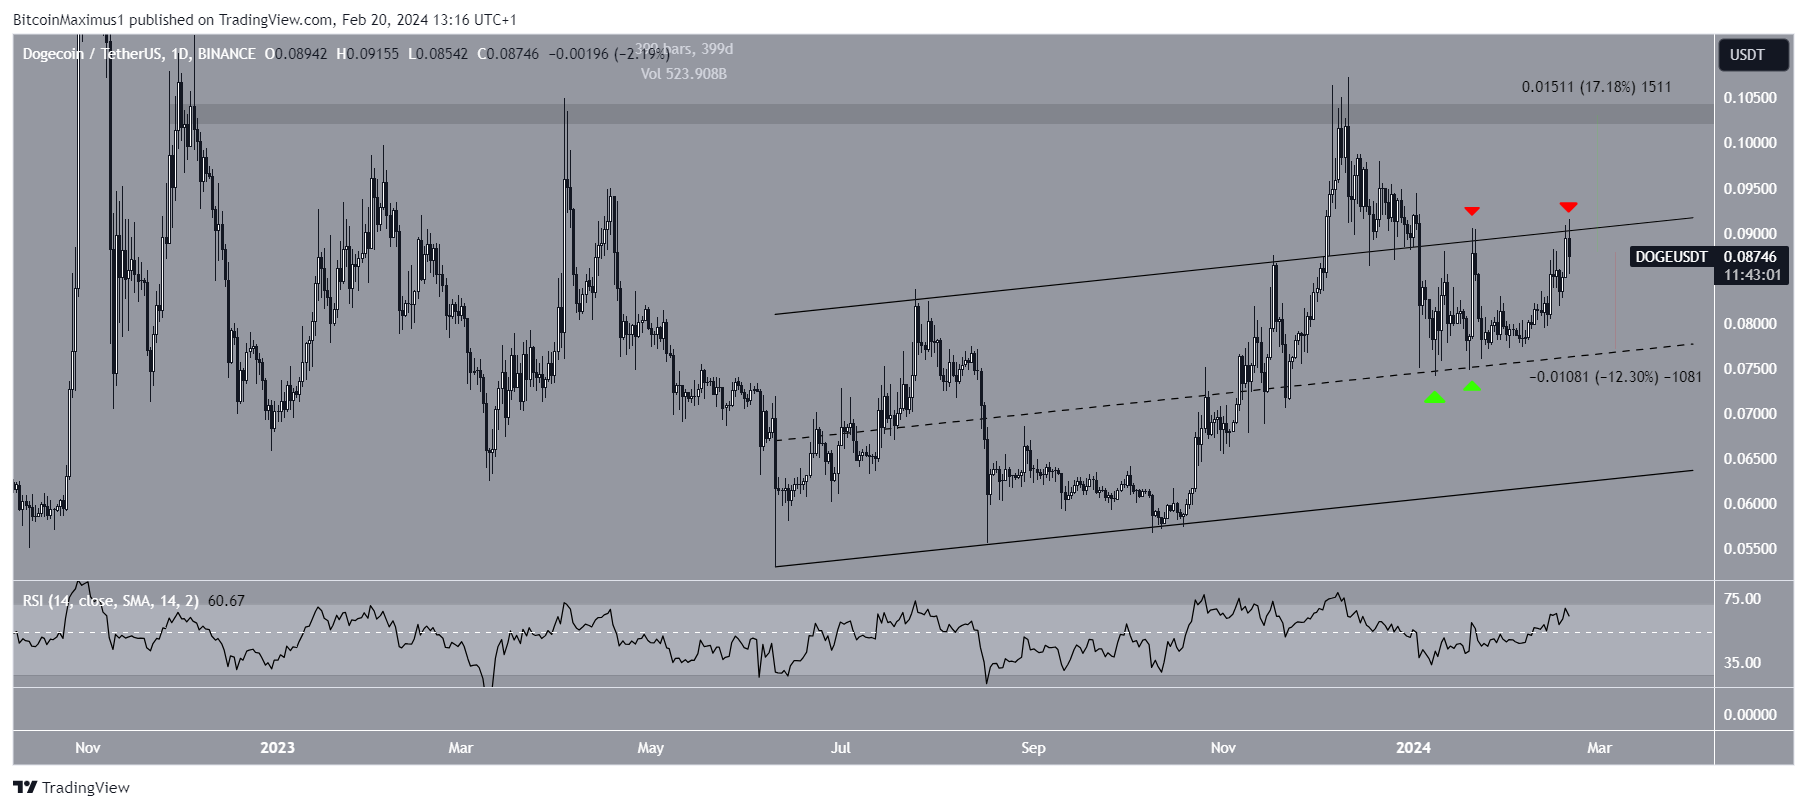
The daily chart shows that DOGE has been trading within a rising parallel channel since June. It initially broke above the channel in November 2023 but fell back into the channel shortly after. Despite the drop, DOGE rose to the channel’s mid-line and is now attempting to break out from the resistance trend line (red symbols). The daily RSI supports the likelihood of a breakout as it is above 50 and rising.
일일 차트를 보면 DOGE가 6월부터 상승하는 병렬 채널 내에서 거래되고 있음을 알 수 있습니다. 처음에는 2023년 11월에 채널을 돌파했지만 얼마 지나지 않아 다시 채널로 떨어졌습니다. 하락에도 불구하고 DOGE는 채널 중간선으로 상승했으며 현재 저항 추세선(빨간색 기호)에서 벗어나려고 시도하고 있습니다. 일일 RSI는 50을 넘고 상승하고 있으므로 돌파 가능성을 뒷받침합니다.
Cryptocurrency investor InmortalCrypto predicts that Dogecoin will soon end its long-term consolidation phase and start a new bull run. If DOGE exits this channel, it could first increase by 17% and reach the next resistance at $0.103.
암호화폐 투자자 InmortalCrypto는 Dogecoin이 곧 장기적인 통합 단계를 끝내고 새로운 강세장을 시작할 것이라고 예측합니다. DOGE가 이 채널을 벗어나면 먼저 17% 증가하고 $0.103의 다음 저항에 도달할 수 있습니다.

Despite the rising Dogecoin price prediction, a rejection from the channel’s resistance trend line could lead to a 12% drop to the mid-line at $0.078.
Dogecoin 가격 예측 상승에도 불구하고 채널의 저항 추세선이 거부되면 $0.078의 중간선까지 12% 하락할 수 있습니다.
The post first appeared on COINTURK NEWS: Dogecoin Price Trends Upward in 2024
이 게시물은 COINTURK NEWS: 2024년 Dogecoin 가격 동향 상승에 처음 게재되었습니다.


 ETHNews
 Coin Edition
 DogeHome
 Crypto Daily™
 BlockchainReporter
 Crypto Daily™
 Crypto Daily™
 crypto.news
 CoinPedia News


