You can also read this news on COINTURK NEWS: Dogecoin Price Trends Upward in 2024
COINTURK NEWS でもこのニュースを読むことができます: ドージコインの価格は 2024 年に上昇傾向
Dogecoin price followed an upward trend in 2024, reaching a notable formation’s resistance trend line in chart analysis. This movement was also observed by analysts as Dogecoin’s second attempt to surge. Will Dogecoin succeed at this point? We examine this with detailed chart analysis, significant support and resistance levels, and expert opinions.
ドージコインの価格は2024年に上昇傾向をたどり、チャート分析で注目すべきフォーメーションのレジスタンストレンドラインに到達しました。この動きはドージコインの二度目の急騰の試みとしてアナリストらも観察した。この時点でドージコインは成功するでしょうか?詳細なチャート分析、重要なサポートとレジスタンスのレベル、専門家の意見によってこれを検証します。
Weekly DOGE Chart Analysis
毎週のDOGEチャート分析
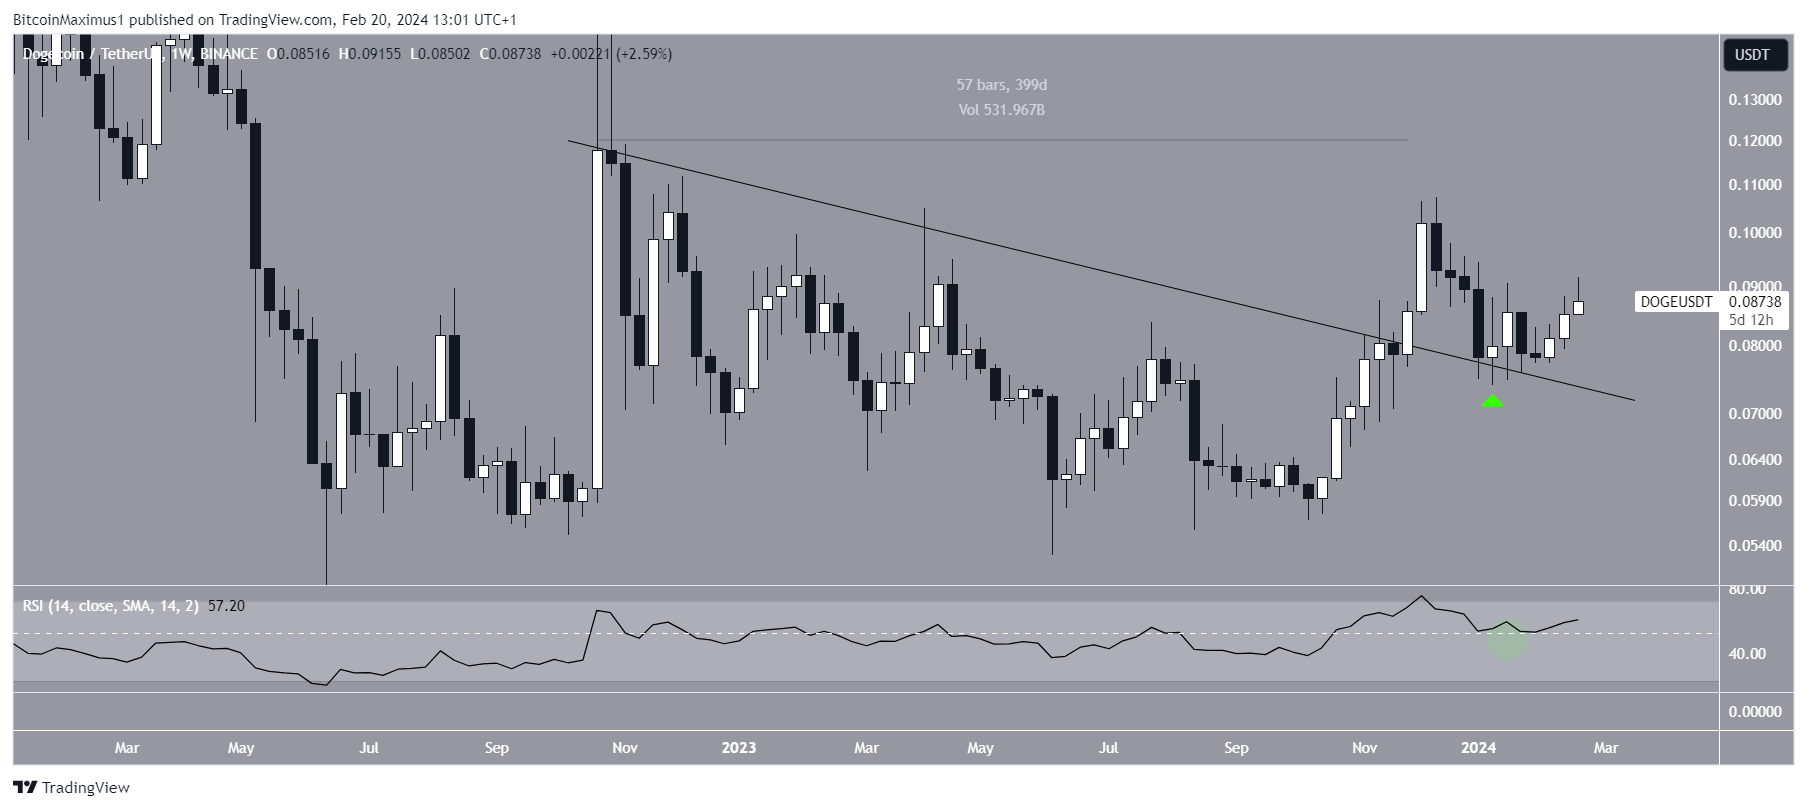
The weekly chart’s technical analysis shows that the DOGE price broke out from a decreasing resistance trend line in November 2023. The trend line had been in focus for 400 days before the breakout. DOGE reached a high level of $0.107 before the decline. However, the DOGE price jumped at the resistance trend line in January 2024 and showed an increase despite being below the highest level of 2023. The weekly Relative Strength Index (RSI) supports the continuation of this rise.
週足チャートのテクニカル分析は、DOGE価格が2023年11月に下降抵抗トレンドラインからブレイクアウトしたことを示しています。トレンドラインはブレイクアウトの400日前から注目されていました。 DOGEは下落前に0.107ドルの高値に達した。しかし、DOGE価格は2024年1月にレジスタンストレンドラインで急上昇し、2023年の高値を下回ったにもかかわらず上昇を示しました。毎週の相対力指数(RSI)はこの上昇の継続を裏付けています。
RSI is a momentum indicator that investors follow with interest, as it helps them assess whether a market is overbought or oversold and whether an asset will be accumulated or sold.
RSI は、市場が買われすぎか売られすぎか、また資産が蓄積されるか売却されるかを評価するのに役立つため、投資家が興味を持ってフォローするモメンタム指標です。
RSI readings above 50 and an upward trend indicate that bulls are still at an advantage, while readings below 50 suggest the opposite. When the price jumped at the resistance trend line, the RSI rose above 50 (green circle), supporting the movement.
RSI 測定値が 50 を超え、上昇傾向にある場合は、強気派が依然として有利であることを示しますが、50 を下回る測定値はその逆を示唆しています。価格がレジスタンストレンドラインで急騰すると、RSIは50(緑の円)を超えて上昇し、動きをサポートしました。

Daily DOGE Chart Analysis
毎日のDOGEチャート分析
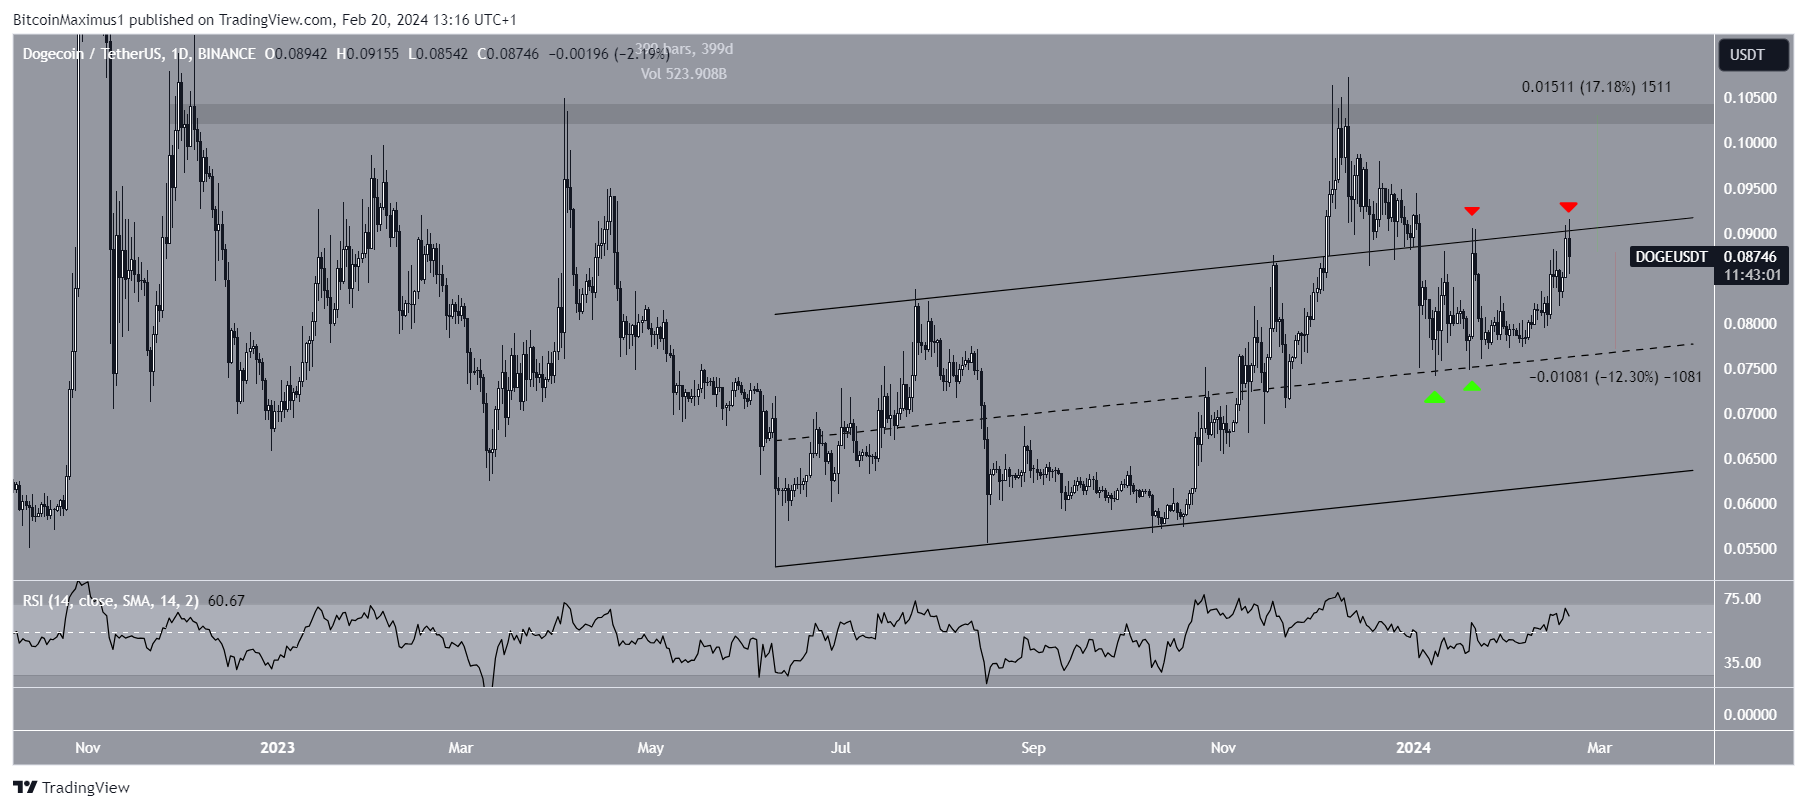
The daily chart shows that DOGE has been trading within a rising parallel channel since June. It initially broke above the channel in November 2023 but fell back into the channel shortly after. Despite the drop, DOGE rose to the channel’s mid-line and is now attempting to break out from the resistance trend line (red symbols). The daily RSI supports the likelihood of a breakout as it is above 50 and rising.
日足チャートは、DOGEが6月以来、上昇平行チャネル内で取引されているのを示しています。 2023年11月に最初に海峡を超えたが、すぐに再び海峡に落ちた。下落にもかかわらず、DOGEはチャネルの中間線まで上昇し、現在レジスタンストレンドライン(赤いシンボル)からの突破を試みています。日次RSIは50を超え上昇しているため、ブレイクアウトの可能性を裏付けている。
Cryptocurrency investor InmortalCrypto predicts that Dogecoin will soon end its long-term consolidation phase and start a new bull run. If DOGE exits this channel, it could first increase by 17% and reach the next resistance at $0.103.
仮想通貨投資家のインモータルクリプトは、ドージコインが間もなく長期的な統合段階を終了し、新たな強気相場を開始すると予測している。 DOGEがこのチャネルを抜けた場合、まず17%上昇し、0.103ドルの次の抵抗に達する可能性があります。

Despite the rising Dogecoin price prediction, a rejection from the channel’s resistance trend line could lead to a 12% drop to the mid-line at $0.078.
ドージコイン価格の上昇予測にもかかわらず、チャネルのレジスタンストレンドラインからの拒否により、0.078ドルの中間線まで12%下落する可能性があります。
The post first appeared on COINTURK NEWS: Dogecoin Price Trends Upward in 2024
この投稿は COINTURK NEWS に最初に掲載されました: ドージコインの価格は 2024 年に上昇傾向


 Crypto Daily™
 BlockchainReporter
 Crypto Daily™
 Crypto Daily™
 crypto.news
 CoinPedia News
 Cryptopolitan_News
 Crypto Daily™
 BSCN
BSCN


