You can also read this news on COINTURK NEWS: Dogecoin Price Trends Upward in 2024
您也可以在 COINTURK NEWS 上閱讀此新聞:2024 年狗狗幣價格趨勢上漲
Dogecoin price followed an upward trend in 2024, reaching a notable formation’s resistance trend line in chart analysis. This movement was also observed by analysts as Dogecoin’s second attempt to surge. Will Dogecoin succeed at this point? We examine this with detailed chart analysis, significant support and resistance levels, and expert opinions.
狗狗幣價格在 2024 年呈上升趨勢,在圖表分析中達到了顯著的阻力趨勢線。分析師也將這一走勢視為狗狗幣的第二次嘗試飆升。狗狗幣此時會成功嗎?我們透過詳細的圖表分析、重要的支撐位和阻力位以及專家意見來檢驗這一點。
Weekly DOGE Chart Analysis
每週 DOGE 圖表分析
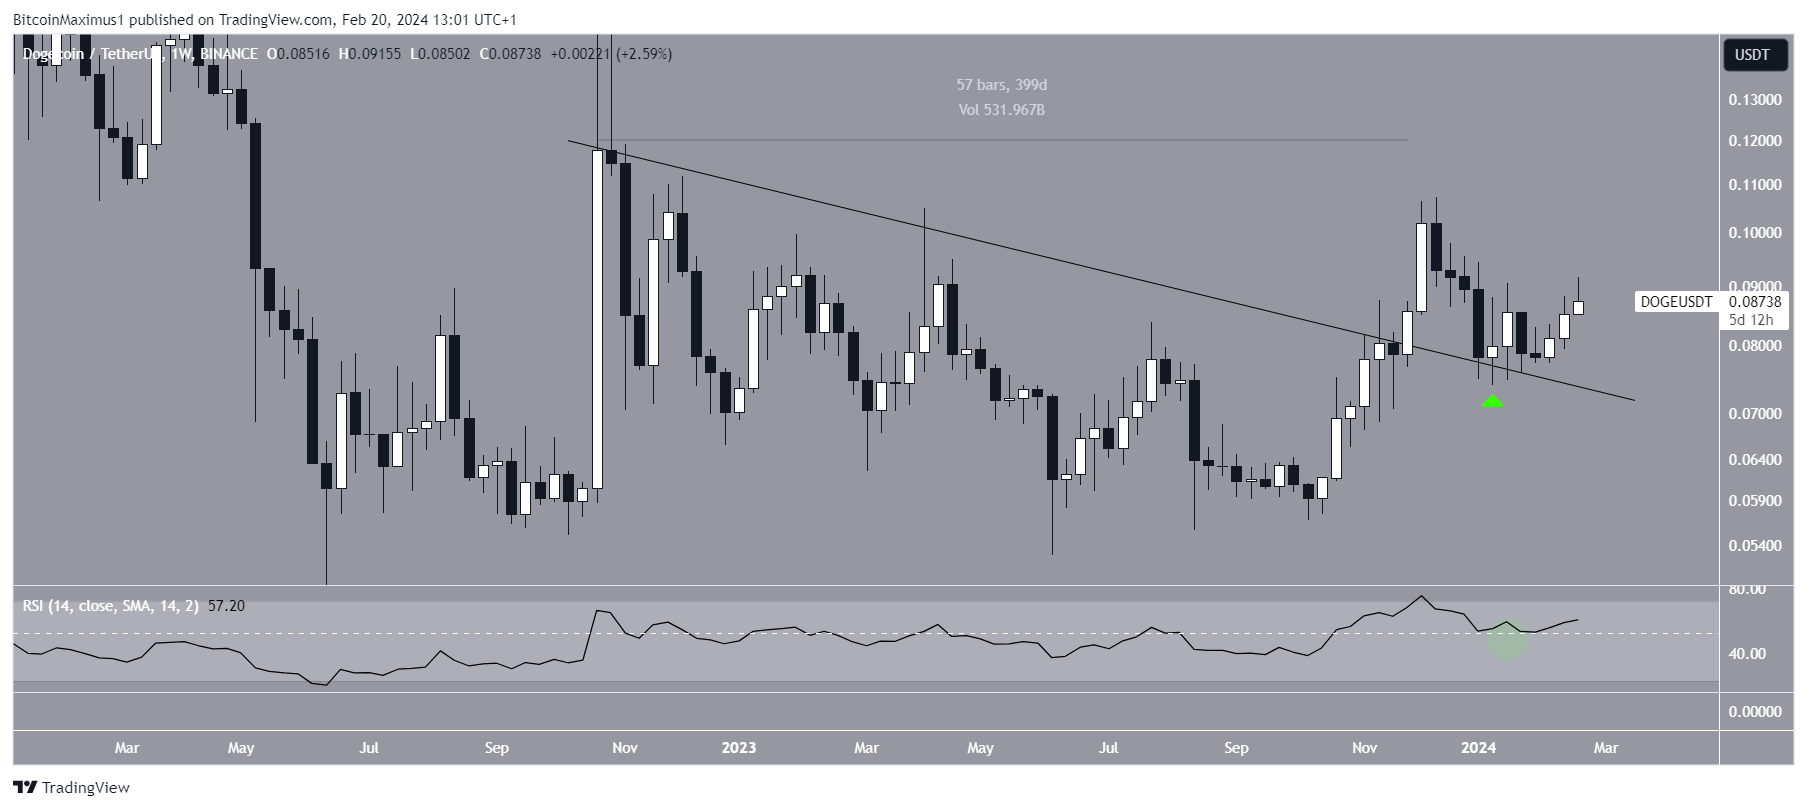
The weekly chart’s technical analysis shows that the DOGE price broke out from a decreasing resistance trend line in November 2023. The trend line had been in focus for 400 days before the breakout. DOGE reached a high level of $0.107 before the decline. However, the DOGE price jumped at the resistance trend line in January 2024 and showed an increase despite being below the highest level of 2023. The weekly Relative Strength Index (RSI) supports the continuation of this rise.
週線圖的技術分析顯示,DOGE價格在2023年11月突破了下降的阻力趨勢線。在突破之前的400天裡,這條趨勢線一直是人們關注的焦點。 DOGE在下跌之前達到了0.107美元的高點。然而,DOGE 價格在 2024 年 1 月突破阻力趨勢線,儘管低於 2023 年最高水平,但仍呈現上漲趨勢。每週相對強弱指數 (RSI) 支持這種上漲的持續。
RSI is a momentum indicator that investors follow with interest, as it helps them assess whether a market is overbought or oversold and whether an asset will be accumulated or sold.
RSI 是投資者感興趣的動量指標,因為它可以幫助他們評估市場是否超買或超賣以及是否會累積或出售資產。
RSI readings above 50 and an upward trend indicate that bulls are still at an advantage, while readings below 50 suggest the opposite. When the price jumped at the resistance trend line, the RSI rose above 50 (green circle), supporting the movement.
RSI 讀數高於 50 且呈上升趨勢表示多頭仍處於優勢,而讀數低於 50 則表示情況相反。當價格突破阻力趨勢線時,RSI 升至 50 以上(綠色圓圈),支撐了走勢。

Daily DOGE Chart Analysis
每日 DOGE 圖表分析
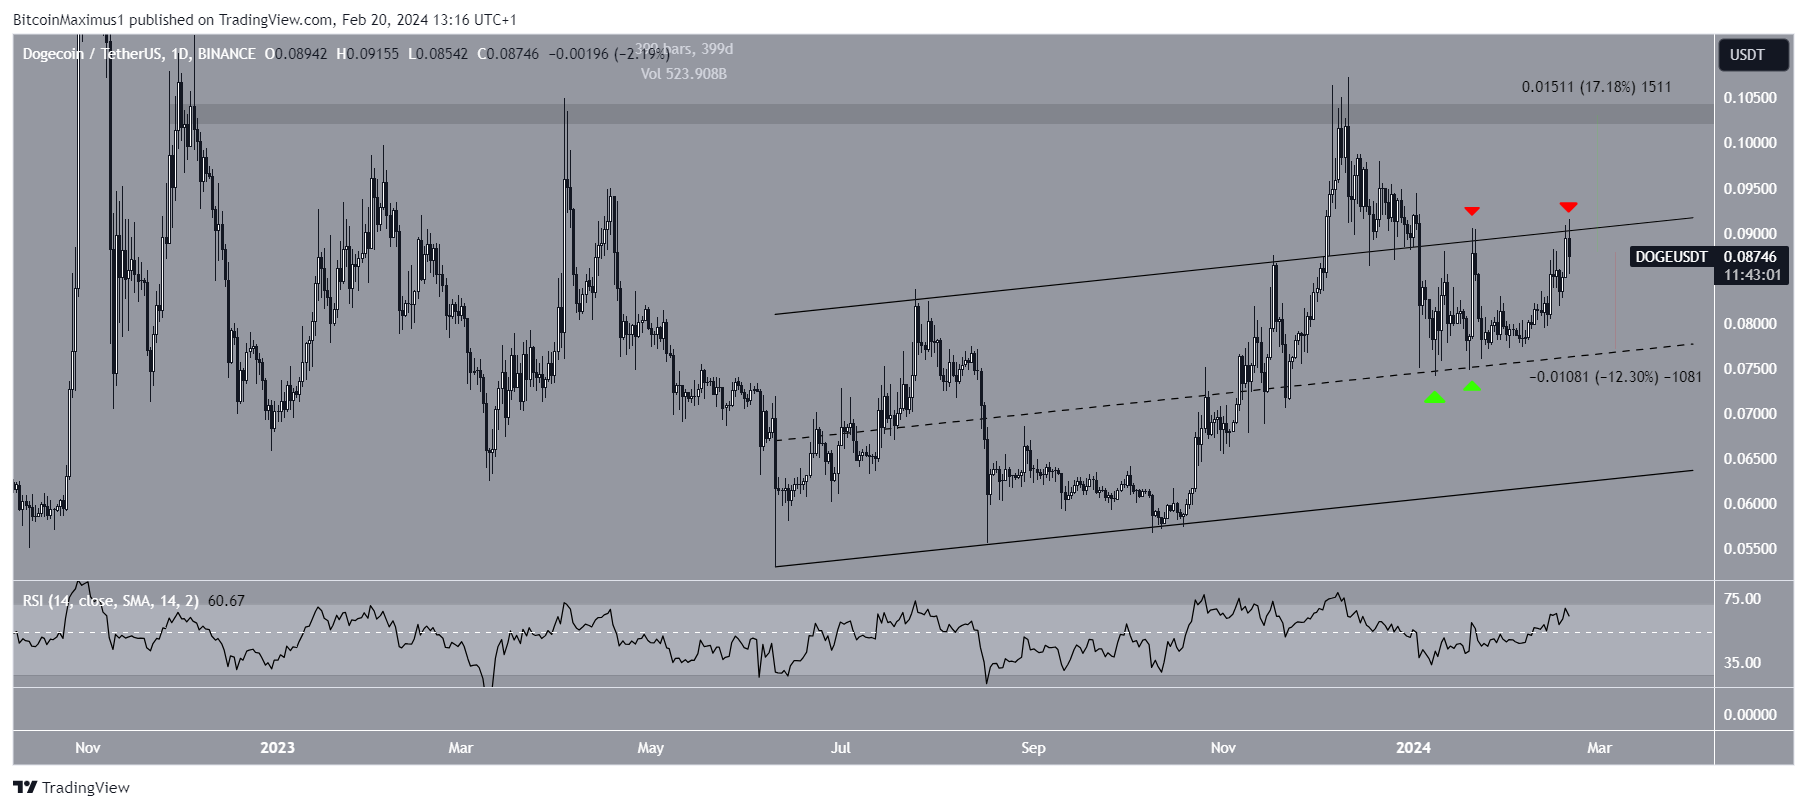
The daily chart shows that DOGE has been trading within a rising parallel channel since June. It initially broke above the channel in November 2023 but fell back into the channel shortly after. Despite the drop, DOGE rose to the channel’s mid-line and is now attempting to break out from the resistance trend line (red symbols). The daily RSI supports the likelihood of a breakout as it is above 50 and rising.
日線圖顯示,自 6 月以來,DOGE 一直在上昇平行通道內交易。它最初於 2023 年 11 月突破該通道,但不久後又回落至該通道。儘管下跌,DOGE 仍升至通道中線,目前正試圖突破阻力趨勢線(紅色符號)。每日 RSI 高於 50 且正在上升,支持突破的可能性。
Cryptocurrency investor InmortalCrypto predicts that Dogecoin will soon end its long-term consolidation phase and start a new bull run. If DOGE exits this channel, it could first increase by 17% and reach the next resistance at $0.103.
加密貨幣投資者 InmortalCrypto 預測,狗狗幣很快就會結束長期盤整階段,開始新的多頭市場。如果 DOGE 退出該通道,它可能會先上漲 17%,並達到下一個阻力位 0.103 美元。

Despite the rising Dogecoin price prediction, a rejection from the channel’s resistance trend line could lead to a 12% drop to the mid-line at $0.078.
儘管狗狗幣價格預測上漲,但如果拒絕該通道的阻力趨勢線,可能會導致其下跌 12%,至中線 0.078 美元。
The post first appeared on COINTURK NEWS: Dogecoin Price Trends Upward in 2024
該貼文首次出現在 COINTURK 新聞:2024 年狗狗幣價格趨勢上漲


 Coin Edition
 ETHNews
 DogeHome
 Crypto Daily™
 BlockchainReporter
 Crypto Daily™
 Crypto Daily™
 crypto.news
 CoinPedia News


