According to a report by IntotheBlock, Litecoin processes an average of $2.85 billion in transactions over $100k daily, which accounts for over 50% of its market cap. Surprisingly, this is more than most Layer 1 cryptocurrencies. For comparison, Dogecoin sees around $590 million in large transactions, even though it has roughly three times the market cap of Litecoin. This indicates substantial whale activity on the Litecoin network.
IntotheBlock의 보고서에 따르면 Litecoin은 매일 10만 달러 이상의 거래에서 평균 28억 5천만 달러를 처리하며 이는 시가총액의 50% 이상을 차지합니다. 놀랍게도 이는 대부분의 레이어 1 암호화폐보다 더 많은 금액입니다. 비교를 위해 Dogecoin은 Litecoin 시가총액의 약 3배임에도 불구하고 대규모 거래에서 약 5억 9천만 달러를 보고 있습니다. 이는 Litecoin 네트워크에서 상당한 고래 활동이 있음을 나타냅니다.
Litecoin Price Prediction: LTC Suggesting Bullish Reversal
라이트코인 가격 예측: 강세 반전을 제안하는 LTC
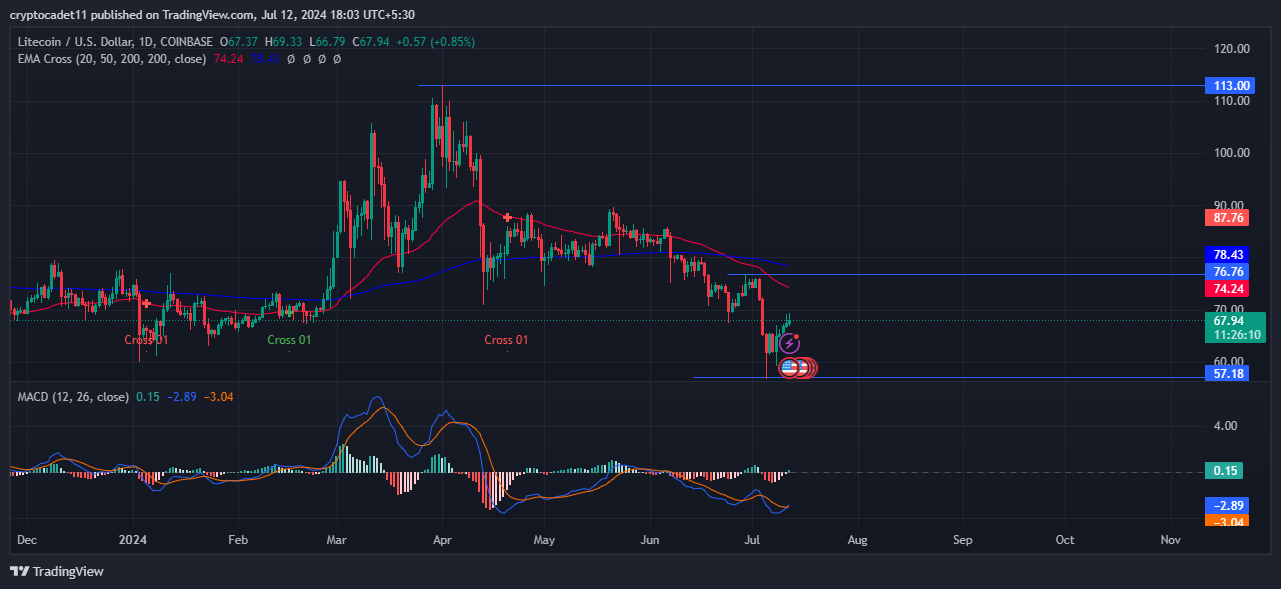
On the daily technical chart, Litecoin is bouncing back by taking support at $57.18 showcasing mild bullishness in the last few trading sessions. The price of LTC began to decline in early April, dropping from $113.00 and continuing a downtrend by breaking below key exponential moving averages.
일일 기술 차트에서 Litecoin은 지난 몇 번의 거래 세션에서 약간의 강세를 보여주는 $57.18의 지지를 받아 반등하고 있습니다. LTC 가격은 4월 초부터 하락하기 시작하여 $113.00에서 하락했으며 주요 지수 이동 평균을 밑돌면서 하락세를 이어갔습니다.
The performance of the coin has been weak in the last few months as the price went down by 20.54% in the last three months, and down by 11.44% in the last month. However, last week it increased by 4.66% showing buyers' presence in the coin.
지난 3개월 동안 가격이 20.54% 하락했고, 지난달에는 11.44% 하락하면서 코인의 성과는 지난 몇 달 동안 약세를 보였습니다. 그러나 지난주에는 4.66% 상승해 코인 내 구매자의 존재감을 보여줬다.
Moreover, indicators like MACD and RSI are also showing mild bullish signs. The MACD curve is in the bearish zone but forms a bullish cross and heads in an upward direction. The RSI curve bounced back from the oversold zone and headed in the upward direction trading above the 14-day SMA line showcasing bullishness.
또한 MACD 및 RSI와 같은 지표도 약간의 강세 신호를 보이고 있습니다. MACD 곡선은 약세 지역에 있지만 강세 십자가를 형성하고 상승 방향으로 향합니다. RSI 곡선은 과매도 영역에서 반등하여 강세를 나타내는 14일 SMA 선 위에서 상승 방향으로 거래되었습니다.
However, according to the technical summary of Tradingview out of 26 indicators 11 are on the sell side, 10 are on the neutral side and 5 are on the buying side suggesting bearishness in the chart.
그러나 Tradingview의 기술 요약에 따르면 26개 지표 중 11개는 매도 측에 있고 10개는 중립 측에 있으며 5개는 매수 측에 있어 차트의 약세를 시사합니다.
At the time of writing Litecoin's price was trading at  with an intraday gain of 1.47% showcasing bullishness on the technical chart. The 24-hour trading volume was 311.04 Million and its market cap stands at 5.12 Billion.
이 글을 쓰는 당시 Litecoin의 가격은 장중 1.47% 상승하며 기술 차트에서 강세를 보였습니다. 24시간 거래량은 3억 1104만건, 시가총액은 51억 2000만건입니다.
If LTC price surpasses the key exponential moving averages and sustains over it then it could start a bullish rally shortly. But if the price is rejected from key EMAs then it may continue the bearish momentum.
LTC 가격이 주요 지수 이동 평균을 초과하고 이를 유지한다면 곧 강세 랠리가 시작될 수 있습니다. 그러나 주요 EMA에서 가격이 거부되면 약세 모멘텀이 계속될 수 있습니다.
Conclusion
결론
Litecoin is showing signs of a potential rebound, driven by significant whale activity and mild bullish indicators like MACD and RSI. While recent price movements suggest a possible upward trend, the overall technical analysis remains mixed. If Litecoin can surpass key exponential moving averages, it may initiate a bullish rally; otherwise, it could continue its bearish momentum.
Litecoin은 상당한 고래 활동과 MACD 및 RSI와 같은 온화한 강세 지표에 힘입어 잠재적인 반등 조짐을 보이고 있습니다. 최근 가격 움직임이 상승 추세를 시사하고 있지만 전반적인 기술적 분석은 여전히 엇갈리고 있습니다. Litecoin이 주요 지수 이동 평균을 능가할 수 있다면 강세 랠리가 시작될 수 있습니다. 그렇지 않으면 약세 모멘텀이 계속될 수 있습니다.


 Coincu
 DogeHome
 BlockchainReporter
 CoinPedia News
 TheNewsCrypto
 CFN
CFN Optimisus


