According to a report by IntotheBlock, Litecoin processes an average of $2.85 billion in transactions over $100k daily, which accounts for over 50% of its market cap. Surprisingly, this is more than most Layer 1 cryptocurrencies. For comparison, Dogecoin sees around $590 million in large transactions, even though it has roughly three times the market cap of Litecoin. This indicates substantial whale activity on the Litecoin network.
IntotheBlock のレポートによると、ライトコインは毎日平均 28 億 5,000 万ドルの 10 万ドル以上の取引を処理しており、これは時価総額の 50% 以上を占めています。驚くべきことに、これはほとんどのレイヤー 1 暗号通貨よりも多いです。比較のために、ドージコインの時価総額はライトコインの約3倍であるにもかかわらず、大規模取引では約5億9,000万ドルとみられています。これは、ライトコインネットワーク上でのクジラの活発な活動を示しています。
Litecoin Price Prediction: LTC Suggesting Bullish Reversal
ライトコイン価格予測:LTCは強気反転を示唆
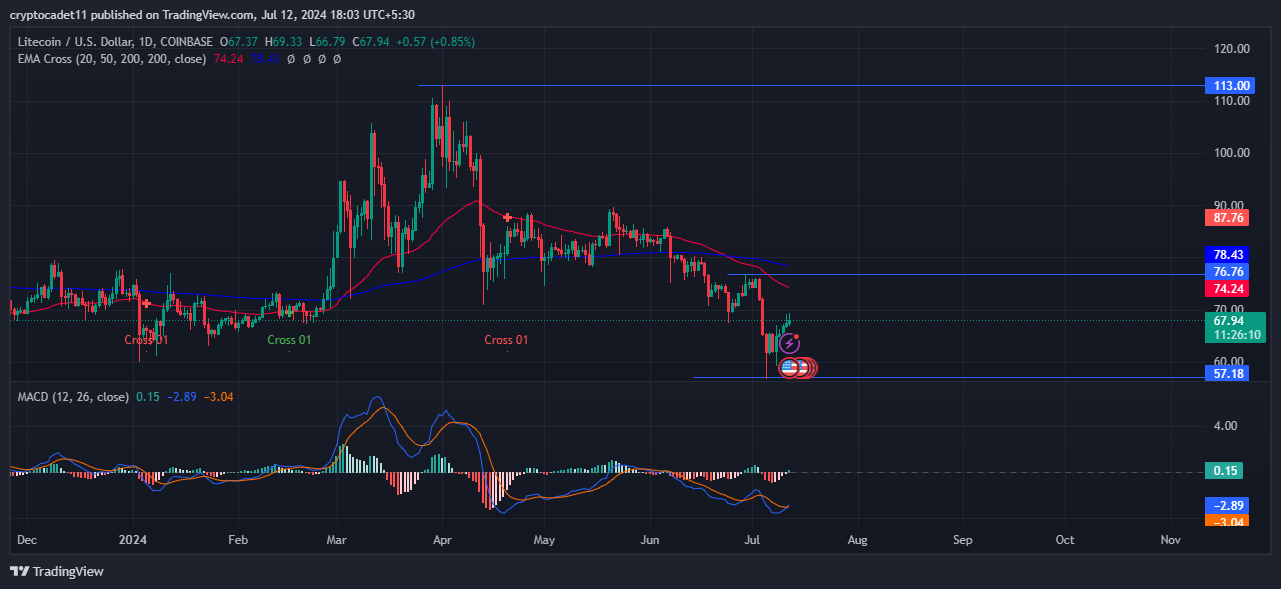
On the daily technical chart, Litecoin is bouncing back by taking support at $57.18 showcasing mild bullishness in the last few trading sessions. The price of LTC began to decline in early April, dropping from $113.00 and continuing a downtrend by breaking below key exponential moving averages.
日次テクニカルチャートでは、ライトコインは57.18ドルでサポートを受けて反発しており、ここ数回の取引セッションで穏やかな強気を示している。 LTCの価格は4月初旬に下落し始め、113.00ドルから下落し、主要な指数移動平均を下回ることで下落傾向が続いた。
The performance of the coin has been weak in the last few months as the price went down by 20.54% in the last three months, and down by 11.44% in the last month. However, last week it increased by 4.66% showing buyers' presence in the coin.
価格が過去 3 か月で 20.54% 下落し、先月では 11.44% 下落したため、ここ数か月のコインのパフォーマンスは低迷しています。しかし、先週は4.66%上昇し、コインにおける買い手の存在感を示した。
Moreover, indicators like MACD and RSI are also showing mild bullish signs. The MACD curve is in the bearish zone but forms a bullish cross and heads in an upward direction. The RSI curve bounced back from the oversold zone and headed in the upward direction trading above the 14-day SMA line showcasing bullishness.
さらに、MACDやRSIなどの指標も穏やかな強気の兆候を示しています。 MACD 曲線は弱気ゾーンにありますが、強気のクロスを形成し、上向きの方向に向かっています。 RSI曲線は売られすぎゾーンから反発し、14日SMA線を上回って上昇方向に向かい、強気を示しました。
However, according to the technical summary of Tradingview out of 26 indicators 11 are on the sell side, 10 are on the neutral side and 5 are on the buying side suggesting bearishness in the chart.
しかし、Tradingviewのテクニカルサマリーによると、26の指標のうち11が売り側、10が中立側、5が買い側であり、チャートの弱気を示唆しています。
At the time of writing Litecoin's price was trading at  with an intraday gain of 1.47% showcasing bullishness on the technical chart. The 24-hour trading volume was 311.04 Million and its market cap stands at 5.12 Billion.
本稿執筆時点では、ライトコインの価格は日中1.47%上昇しており、テクニカルチャートで強気を示している。 24時間の取引高は3億1,104万株、時価総額は51億2,000万株となった。
If LTC price surpasses the key exponential moving averages and sustains over it then it could start a bullish rally shortly. But if the price is rejected from key EMAs then it may continue the bearish momentum.
LTC価格が主要な指数移動平均を上回り、それを維持すれば、間もなく強気の上昇が始まる可能性があります。しかし、主要なEMAから価格が拒否された場合は、弱気の勢いが続く可能性があります。
Conclusion
結論
Litecoin is showing signs of a potential rebound, driven by significant whale activity and mild bullish indicators like MACD and RSI. While recent price movements suggest a possible upward trend, the overall technical analysis remains mixed. If Litecoin can surpass key exponential moving averages, it may initiate a bullish rally; otherwise, it could continue its bearish momentum.
ライトコインは、クジラの活発な活動とMACDやRSIなどの穏やかな強気指標に牽引されて、潜在的な反発の兆候を示しています。最近の価格変動は上昇傾向の可能性を示唆していますが、全体的なテクニカル分析は依然としてまちまちです。ライトコインが主要な指数移動平均を超えることができれば、強気の上昇が始まる可能性があります。そうでなければ、弱気の勢いが続く可能性がある。


 Thecoinrepublic.com
 Cryptopolitan_News
 CryptoNewsLand
 DogeHome
 CryptoNewsLand
 crypto.ro English
 CoinoMedia


