According to a report by IntotheBlock, Litecoin processes an average of $2.85 billion in transactions over $100k daily, which accounts for over 50% of its market cap. Surprisingly, this is more than most Layer 1 cryptocurrencies. For comparison, Dogecoin sees around $590 million in large transactions, even though it has roughly three times the market cap of Litecoin. This indicates substantial whale activity on the Litecoin network.
根據 IntotheBlock 的報告,萊特幣平均每天處理 28.5 億美元的超過 10 萬美元的交易,佔其市值的 50% 以上。令人驚訝的是,這比大多數第 1 層加密貨幣都要多。相比之下,狗狗幣的大額交易額約為 5.9 億美元,儘管它的市值大約是萊特幣的三倍。這表明萊特幣網路上存在大量鯨魚活動。
Litecoin Price Prediction: LTC Suggesting Bullish Reversal
萊特幣價格預測:LTC 建議看漲逆轉
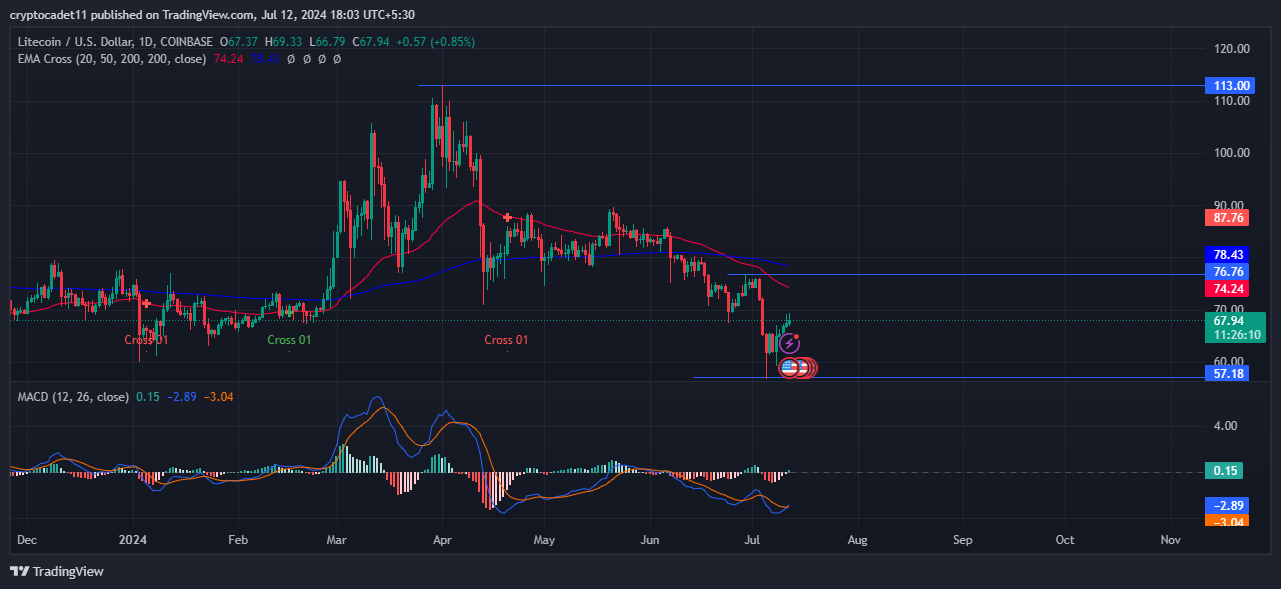
On the daily technical chart, Litecoin is bouncing back by taking support at $57.18 showcasing mild bullishness in the last few trading sessions. The price of LTC began to decline in early April, dropping from $113.00 and continuing a downtrend by breaking below key exponential moving averages.
在日線技術圖表上,萊特幣在 57.18 美元的支撐位上反彈,顯示出過去幾個交易日的溫和看漲情緒。 LTC 的價格從 4 月初開始下跌,從 113.00 美元下跌,並跌破關鍵指數移動平均線,繼續下跌趨勢。
The performance of the coin has been weak in the last few months as the price went down by 20.54% in the last three months, and down by 11.44% in the last month. However, last week it increased by 4.66% showing buyers' presence in the coin.
過去幾個月,該幣的表現一直疲軟,過去三個月價格下跌了 20.54%,上個月下跌了 11.44%。然而,上週它上漲了 4.66%,顯示了買家對代幣的關注。
Moreover, indicators like MACD and RSI are also showing mild bullish signs. The MACD curve is in the bearish zone but forms a bullish cross and heads in an upward direction. The RSI curve bounced back from the oversold zone and headed in the upward direction trading above the 14-day SMA line showcasing bullishness.
此外,MACD和RSI等指標也顯示出溫和的看漲跡象。 MACD 曲線位於看跌區域,但形成看漲交叉並向上移動。 RSI 曲線從超賣區域反彈,並在 14 日移動平均線上方向上移動,顯示看漲。
However, according to the technical summary of Tradingview out of 26 indicators 11 are on the sell side, 10 are on the neutral side and 5 are on the buying side suggesting bearishness in the chart.
然而,根據Tradingview的技術摘要,在26個指標中,11個為賣方指標,10個為中性指標,5個為買方指標,顯示圖表中看跌。
At the time of writing Litecoin's price was trading at  with an intraday gain of 1.47% showcasing bullishness on the technical chart. The 24-hour trading volume was 311.04 Million and its market cap stands at 5.12 Billion.
在撰寫本文時,萊特幣的交易價格盤中漲幅為 1.47%,在技術圖表上顯示出看漲情緒。 24小時交易量為31104萬手,市值為51.2億。
If LTC price surpasses the key exponential moving averages and sustains over it then it could start a bullish rally shortly. But if the price is rejected from key EMAs then it may continue the bearish momentum.
如果 LTC 價格超過關鍵指數移動平均線並維持在該水平之上,那麼它可能很快就會開始看漲反彈。但如果價格被關鍵 EMA 拒絕,那麼它可能會繼續看跌勢頭。
Conclusion
結論
Litecoin is showing signs of a potential rebound, driven by significant whale activity and mild bullish indicators like MACD and RSI. While recent price movements suggest a possible upward trend, the overall technical analysis remains mixed. If Litecoin can surpass key exponential moving averages, it may initiate a bullish rally; otherwise, it could continue its bearish momentum.
在大量鯨魚活動和 MACD 和 RSI 等溫和看漲指標的推動下,萊特幣顯示出潛在反彈的跡象。雖然最近的價格走勢表明可能出現上漲趨勢,但整體技術分析仍然喜憂參半。如果萊特幣能夠超越關鍵指數移動平均線,則可能會引發看漲反彈;否則,它可能會繼續其看跌勢頭。


 TheNewsCrypto
 CFN
CFN DogeHome
 Optimisus
 Crypto News Land
 Optimisus
 Cryptopolitan_News


