


The attempt by bulls to sustain Bitcoin’s market price above $52,000 appears to have faltered, potentially signalling a shift in short-term market dynamics for both BTC and alternative cryptocurrencies.
비트코인의 시장 가격을 52,000달러 이상으로 유지하려는 황소의 시도는 흔들리는 것으로 보이며 잠재적으로 BTC와 대체 암호화폐 모두에 대한 단기 시장 역학의 변화를 신호합니다.
Bitcoin (BTC) has recently remained in a consolidation phase, reflecting a fierce struggle between bullish and bearish forces. The prevailing uncertainty raises speculation regarding whether selling pressure will prevail, leading to a short-term downturn, or if buying interest will prevail. This uncertainty weighs heavily on the minds of cryptocurrency investors.
비트코인(BTC)은 최근 강세 세력과 약세 세력 간의 치열한 투쟁을 반영하여 통합 단계에 머물고 있습니다. 만연한 불확실성으로 인해 매도 압력이 우세하여 단기 경기 침체로 이어질 것인지, 아니면 매수세가 우세할 것인지에 대한 추측이 높아집니다. 이러한 불확실성은 암호화폐 투자자들의 마음을 무겁게 짓누르고 있습니다.
With expectations for an imminent rate cut by the Federal Reserve dwindling, profit-taking has ensued in the S&P 500 Index. This development hints at a cautious market sentiment shortly, heightening the likelihood of a retracement in Bitcoin and specific alternative cryptocurrencies.
미국 연방준비제도(Fed·연준)의 금리 인하가 임박했다는 기대감이 줄어들면서 S&P 500 지수에는 차익실현이 이어졌다. 이러한 발전은 곧 조심스러운 시장 심리를 암시하며 비트코인과 특정 대체 암호화폐의 되돌림 가능성을 높입니다.
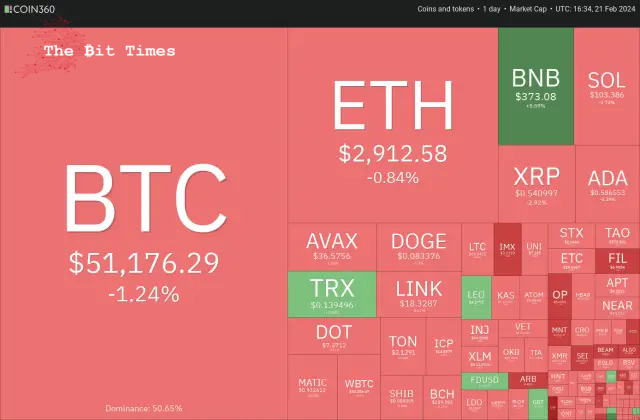
However, the dip may not change the long-term bullish view. Investors will likely view every dip as a buying opportunity because of Bitcoin’s upcoming halving in April, which has historically been bullish.
그러나 하락세는 장기적인 강세 전망을 바꾸지 못할 수도 있습니다. 투자자들은 역사적으로 낙관적이었던 비트코인의 다가오는 4월 반감기로 인해 모든 하락을 매수 기회로 볼 가능성이 높습니다.
What essential support levels may arrest the decline in Bitcoin and altcoins? Let’s analyze the charts of the top 10 cryptocurrencies to find out.
비트코인과 알트코인의 하락을 막을 수 있는 필수 지원 수준은 무엇입니까? 알아보기 위해 상위 10개 암호화폐 차트를 분석해 보겠습니다.
Bitcoin (BTC) Market Analysis
비트코인(BTC) 시장 분석
Bitcoin struggles to sustain above $52,000, indicating that the bears fiercely defend the level.
비트코인은 $52,000 이상을 유지하기 위해 고군분투하고 있는데, 이는 곰들이 치열하게 그 수준을 방어하고 있음을 나타냅니다.
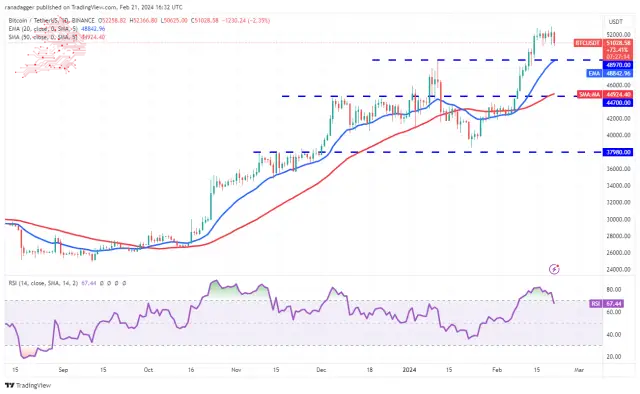
If the price slips below $50,000, short-term traders may give up and book profits. That could pull the BTC/USDT pair to the 20-day exponential moving average ($48,842).
가격이 $50,000 아래로 떨어지면 단기 거래자는 포기하고 이익을 기록할 수 있습니다. 이는 BTC/USDT 쌍을 20일 지수 이동 평균($48,842)으로 끌어올릴 수 있습니다.
If the price rebounds off the 20-day EMA with force, it will suggest that the sentiment remains positive and traders are buying at lower levels. That will increase the likelihood of a rally above $52,000. The pair could then jump to $60,000.
가격이 20일 EMA에서 힘차게 반등한다면 이는 정서가 여전히 긍정적이고 거래자들이 더 낮은 수준에서 매수하고 있음을 의미합니다. 그러면 $52,000 이상의 랠리 가능성이 높아집니다. 그러면 그 쌍은 $60,000까지 뛸 수 있습니다.
Instead, if the price continues lower and breaks below the 20-day EMA, it will start a pullback to the 50-day simple moving average ($44,924).
대신 가격이 계속 낮아지고 20일 EMA 아래로 떨어지면 50일 단순 이동 평균($44,924)으로 하락하기 시작합니다.
Ether (ETH) Market Analysis
이더(ETH) 시장 분석
이더리움은 2월 21일 3,000달러의 심리적 저항으로 인해 거절되었으며, 이는 단기 트레이더의 차익 예약을 의미합니다.
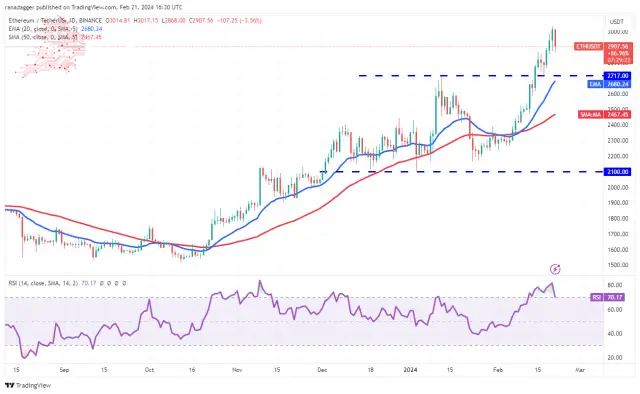
The corrections generally last between one to three days in a strong uptrend. The crucial support on the downside is $2,717. If the price snaps back from $2,717 with force, it will indicate that every minor dip is being purchased aggressively. That will enhance the prospects of a break above $3,000. The ETH/USDT pair may then rally to $3,300.
조정은 일반적으로 강한 상승 추세에서 1~3일 동안 지속됩니다. 단점에 대한 중요한 지원은 $ 2,717입니다. 가격이 2,717달러에서 강제로 급락한다면 모든 소폭 하락이 공격적으로 매수되고 있음을 나타냅니다. 이는 $3,000 이상의 휴식 가능성을 높여줄 것입니다. 그러면 ETH/USDT 쌍이 3,300달러까지 상승할 수 있습니다.
Conversely, if bears tug the price below the 20-day EMA ($2,680), it will signal the start of a deeper correction to the 50-day SMA ($2,467).
반대로 하락세가 20일 EMA($2,680) 아래로 가격을 끌어내리면 50일 SMA($2,467)에 대한 더 깊은 조정이 시작된다는 신호가 됩니다.
BNB Market Analysis
BNB 시장 분석
BNB turned up after a brief correction and surged above the $367 resistance on Feb. 21, signalling the resumption of the uptrend.
BNB는 잠시 조정을 거친 후 상승하여 2월 21일 저항선인 367달러를 넘어 급등하며 상승 추세 재개를 알렸습니다.
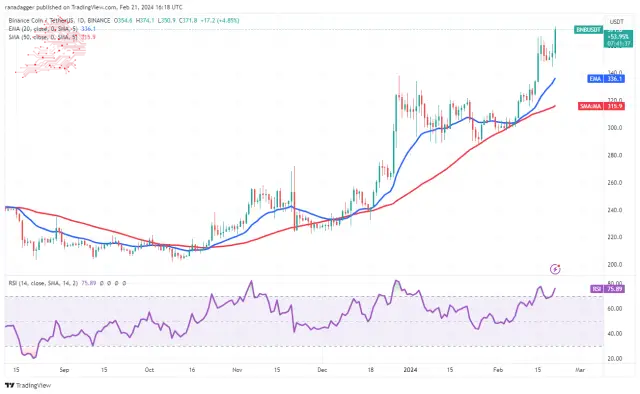
The upsloping moving averages and the RSI in the overbought zone indicate that the bulls are in command. If buyers maintain the price above $368, the BNB/USDT pair could pick up momentum and surge toward $400.
상승하는 이동평균선과 과매수 구간의 RSI는 상승세가 지배적임을 나타냅니다. 구매자가 가격을 368달러 이상으로 유지한다면 BNB/USDT 쌍은 추진력을 얻어 400달러까지 급등할 수 있습니다.
The first support on the downside is at the 20-day EMA ($336), and the next is the 50-day SMA ($315). The bears must yank the price below the 50-day SMA to indicate a trend change.
아래쪽에 대한 첫 번째 지지는 20일 EMA($336)이고 다음은 50일 SMA($315)입니다. 하락세는 추세 변화를 나타내기 위해 가격을 50일 SMA 아래로 끌어내려야 합니다.
Solana (SOL) Price Analysis
솔라나(SOL) 가격 분석
Solana’s rebound fizzled at $115, and the price turned down on Feb. 19, indicating a lack of higher-level demand.
솔라나의 반등은 115달러로 주춤했고, 2월 19일 가격이 하락해 더 높은 수준의 수요가 부족함을 나타냈습니다.
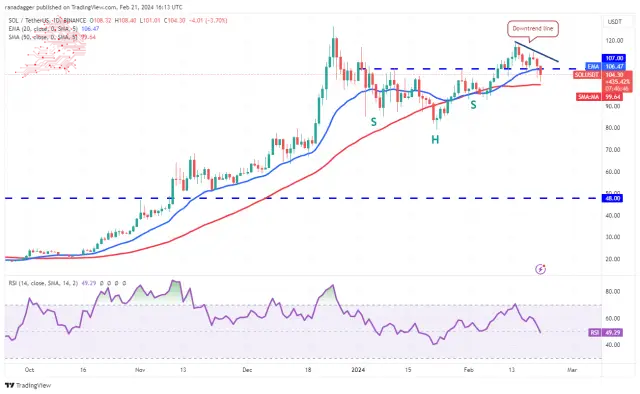
The bears pulled the price below the neckline of the inverse head-and-shoulders pattern on Feb. 21, signalling that the bullish momentum has weakened. The 50-day SMA may act as a support, but it may not hold for long. If the support cracks, the SOL/USDT pair could start a decline to $93, which is a significant level to keep an eye on.
하락세는 2월 21일 역헤드앤숄더 패턴의 네크라인 아래로 가격을 끌어내려 강세 모멘텀이 약해졌다는 신호를 보냈습니다. 50일 SMA는 지원 역할을 할 수 있지만 오래 지속되지 않을 수 있습니다. 지지가 무너지면 SOL/USDT 쌍은 93달러까지 하락하기 시작할 수 있는데, 이는 주목해야 할 상당한 수준입니다.
The first sign of strength will be a rise above the downtrend line. The pair could then attempt a rally to the overhead resistance of $126.
강세의 첫 번째 신호는 하락 추세선 위로 상승하는 것입니다. 그러면 이 쌍은 $126의 머리 위 저항선까지 상승을 시도할 수 있습니다.
XRP Price Analysis
XRP closed above the downtrend line on Feb. 19, but the bulls could not clear the hurdle at $0.57. This suggests that every minor relief rally is being sold into.
XRP 가격 분석 XRP는 2월 19일 하락 추세선 위에서 마감했지만 상승세는 $0.57로 장애물을 넘지 못했습니다. 이는 모든 소규모 구호 집회가 매각되고 있음을 의미합니다.
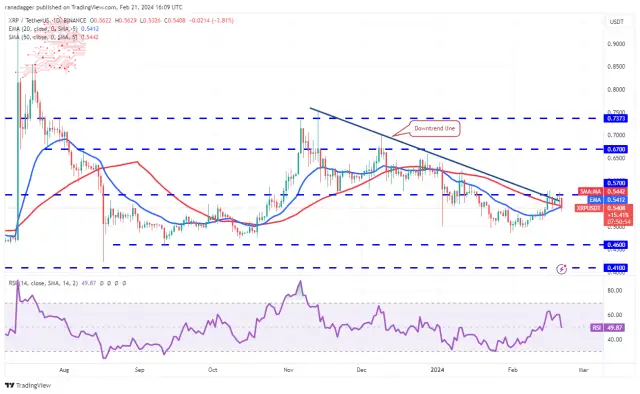
The bears are trying to pull the price below the moving averages. If they succeed, the XRP/USDT pair could dip toward the strong support at $0.46. Buyers are expected to defend this level with vigour.
하락세는 가격을 이동 평균 아래로 끌어내리려고 노력하고 있습니다. 성공하면 XRP/USDT 쌍은 $0.46의 강력한 지지선을 향해 하락할 수 있습니다. 구매자들은 이 수준을 적극적으로 방어할 것으로 예상됩니다.
If the price rebounds off $0.46, the pair could climb to $0.57 and stay inside this range for some time. A break and close above $0.57 will suggest that the corrective phase may be over. The pair could then attempt a rally to $0.67.
가격이 $0.46에서 반등하면 쌍은 $0.57까지 상승하여 한동안 이 범위 내에 머물 수 있습니다. 0.57달러를 초과하는 중단 및 마감은 조정 단계가 끝났음을 의미합니다. 그런 다음 쌍은 $0.67까지 반등을 시도할 수 있습니다.
Cardano (ADA) Price Analysis
카르다노(ADA) 가격 분석
Cardano turned down from $0.64 on Feb. 20, suggesting profit booking by the short-term traders. The price could reach the 20-day EMA ($0.57).
Cardano는 2월 20일 $0.64에서 거절되었으며, 이는 단기 트레이더의 이익 예약을 암시합니다. 가격은 20일 EMA($0.57)에 도달할 수 있습니다.
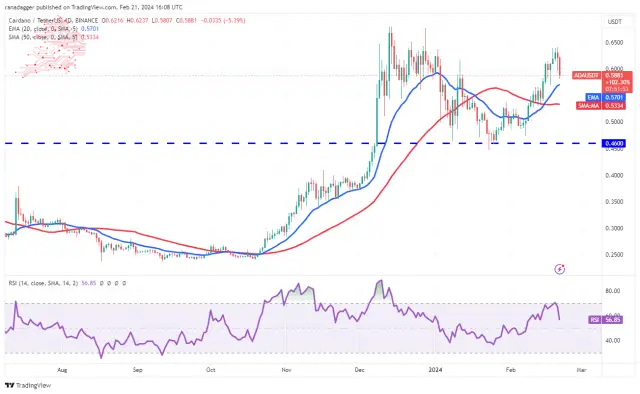
Buyers will have to defend the 20-day EMA aggressively to keep the move intact. If they do that, the ADA/USDT pair could rise to $0.64 and eventually to $0.68. A break and close above this resistance will signal the start of the next leg of the uptrend.
구매자는 움직임을 그대로 유지하기 위해 20일 EMA를 공격적으로 방어해야 합니다. 그렇게 하면 ADA/USDT 쌍은 $0.64까지 상승하고 결국 $0.68까지 상승할 수 있습니다. 이 저항선 위의 돌파 및 종가는 상승 추세의 다음 구간이 시작된다는 신호입니다.
On the contrary, if the price tumbles below the 20-day EMA, it will indicate that the bullish momentum has weakened. The pair may consolidate inside an extensive range between $0.46 and $0.64.
반대로 가격이 20일 EMA 아래로 떨어지면 강세 모멘텀이 약화되었음을 나타냅니다. 이 쌍은 $0.46에서 $0.64 사이의 광범위한 범위 내에서 통합될 수 있습니다.
Avalanche (AVAX) Price Analysis
눈사태(AVAX) 가격 분석
The bulls defended the 50-day SMA ($36) on Feb. 20, but the bears sold the recovery to the 20-day EMA ($38.22) in Avalanche,
상승세는 2월 20일 50일 SMA($36)를 방어했지만 하락세는 Avalanche에서 회복세를 20일 EMA($38.22)에 매도했습니다.
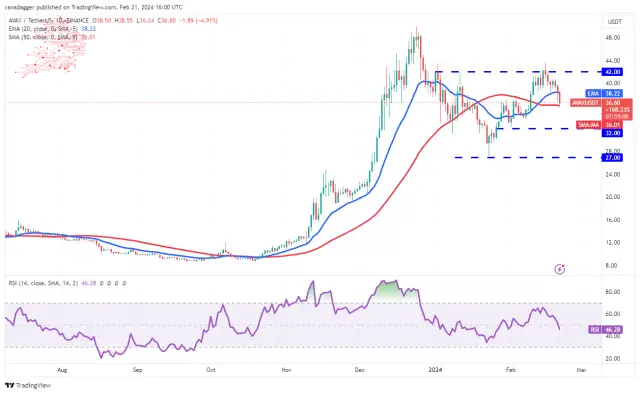
The 20-day EMA has flattened out, and the RSI is just below the midpoint, indicating a range-bound action in the near term. If the price breaks below the 50-day SMA, the AVAX/USDT pair may drop to $32, which will likely be a strong support. A solid rebound off the support could keep the pair between $32 and $42 for a few days.
20일 EMA는 평탄해졌고 RSI는 중간점 바로 아래에 있어 단기적으로 범위 제한 조치를 나타냅니다. 가격이 50일 SMA 아래로 떨어지면 AVAX/USDT 쌍이 32달러로 하락할 수 있으며 이는 강력한 지지가 될 가능성이 높습니다. 지지선이 확고하게 반등하면 며칠 동안 32달러에서 42달러 사이의 가격을 유지할 수 있습니다.
On the upside, the bulls must drive and sustain the pair above $42 to complete the inverse head-and-shoulders pattern and gain the upper hand.
긍정적인 측면에서는 황소가 역 머리-어깨 패턴을 완성하고 우위를 점하기 위해 쌍을 $42 이상으로 유지하고 유지해야 합니다.
Dogecoin (DOGE) Price Analysis
Dogecoin bounced off the 20-day EMA ($0.08) on Feb. 18, but the bulls could not overcome the barrier at $0.09. This suggests a negative sentiment where the bears are selling on rallies.
Dogecoin(DOGE) 가격 분석 Dogecoin은 2월 18일 20일 EMA($0.08)에서 반등했지만 상승세는 $0.09의 장벽을 극복하지 못했습니다. 이는 하락세가 랠리에서 매도하는 부정적인 정서를 시사합니다.
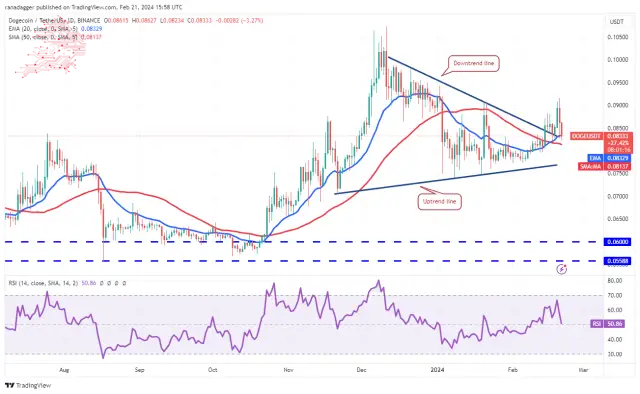
If the price skids below the moving averages, the DOT/USDT pair could drop to the uptrend line. This is an essential level for the bulls to defend because if they fail to do that, the pair may start a descent to $0.07.
가격이 이동 평균 아래로 미끄러지면 DOT/USDT 쌍이 상승 추세선으로 떨어질 수 있습니다. 이는 황소가 방어해야 할 필수 수준입니다. 그렇게 하지 않으면 쌍이 $0.07까지 하락할 수 있기 때문입니다.
This negative view will be invalidated in the short term if the price rebounds off the current level and rises above $0.09. That opens the doors for a rally to the $0.10 to $0.11 resistance zone.
가격이 현재 수준에서 반등하여 $0.09 이상으로 상승하면 이러한 부정적인 견해는 단기적으로 무효화됩니다. 이는 $0.10~$0.11 저항 영역으로의 반등의 문을 열어줍니다.
Chainlink (LINK) Price Analysis
체인링크(LINK) 가격 분석
Chainlink bounced off the 20-day EMA ($18.81) on Feb. 20, but the bulls could not build upon the recovery. The price turned down and slipped below the 20-day EMA on Feb. 21.
Chainlink는 2월 20일 20일 EMA($18.81)에서 반등했지만 강세는 회복세를 이어가지 못했습니다. 가격은 하락세를 보이며 2월 21일 20일 EMA 아래로 떨어졌습니다.
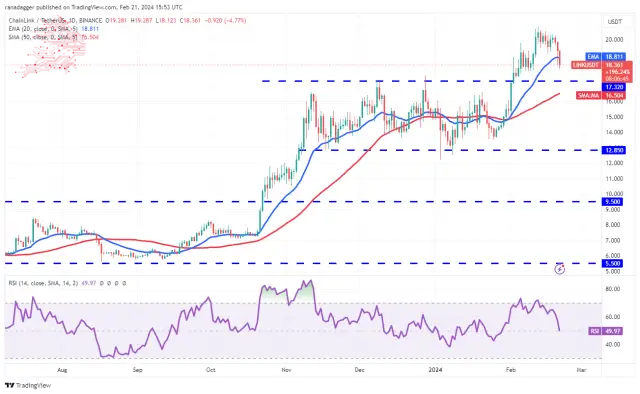
The next stop on the downside is the breakout level of $17.32. This level may witness a tough battle between the bulls and the bears. If the price rebounds off $17.32 with strength, the LINK/USDT pair may rise to the 20-day EMA and later to the overhead resistance at $20.85.
아래쪽의 다음 정거장은 $17.32의 돌파 수준입니다. 이 레벨에서는 황소와 곰 사이의 힘든 싸움을 목격할 수 있습니다. 가격이 $17.32로 반등하면 LINK/USDT 쌍은 20일 EMA까지 상승한 후 나중에 $20.85의 오버헤드 저항까지 상승할 수 있습니다.
The zone between $17.32 and the 50-day SMA ($16.51) will likely act as a formidable support on the downside. A break below this zone will suggest a potential trend change in the near term.
$17.32와 50일 SMA($16.51) 사이의 영역은 하락세에 대한 강력한 지지 역할을 할 가능성이 높습니다. 이 영역 아래의 돌파는 단기적으로 잠재적인 추세 변화를 암시합니다.
Polkadot (DOT) Price Analysis
Polkadot’s recovery stalled near the 61.8% Fibonacci retracement level of $8.21, indicating that bears continue to sell on rallies.
Polkadot(DOT) 가격 분석 Polkadot의 회복은 61.8% 피보나치 되돌림 수준인 $8.21 근처에서 정체되었으며, 이는 하락세가 계속해서 랠리에서 매도하고 있음을 나타냅니다.
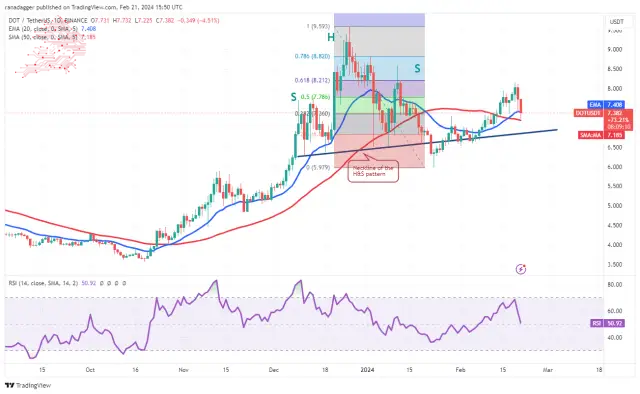
The DOT/USDT pair has reached the 50-day SMA ($7.18), a significant level to watch out for. If this level gives way, it will suggest that the bulls are losing their grip. The pair could then drop to the neckline and subsequently to $6.
DOT/USDT 쌍은 주의해야 할 상당한 수준인 50일 SMA($7.18)에 도달했습니다. 이 수준이 무너지면 황소가 지배력을 잃고 있음을 의미합니다. 그런 다음 쌍은 네크라인까지 하락한 후 $6까지 하락할 수 있습니다.
The flattening 20-day EMA and the RSI near the midpoint suggest a range-bound action in the near term. If the price rebounds off the neckline, the pair could reach $8.21 and stay range-bound between these two levels for some time. The Bulls will be back in the game on a close above $8.21.
평탄한 20일 EMA와 중간 지점 근처의 RSI는 단기적으로 범위 제한 조치를 암시합니다. 가격이 네크라인에서 반등하면 해당 쌍은 $8.21에 도달하고 한동안 이 두 수준 사이의 범위에 머무를 수 있습니다. Bulls는 $8.21 이상으로 경기에 복귀할 것입니다.
Source – Rakesh Upadhyay
출처 – Rakesh Upadhyay
Source: https://thebittimes.com/latest-market-overview-21st-feb-btc-eth-bnb-sol-xrp-ada-avax-doge-link-dot-tbt86045.html
출처: https://thebittimes.com/latest-market-overview-21st-feb-btc-eth-bnb-sol-xrp-ada-avax-doge-link-dot-tbt86045.html
 Coin Edition
 Optimisus
 TheCoinrise Media
 DogeHome
 Optimisus
 BH NEWS
 The Blockopedia
 COINTURK NEWS
 Crypto News Land


