


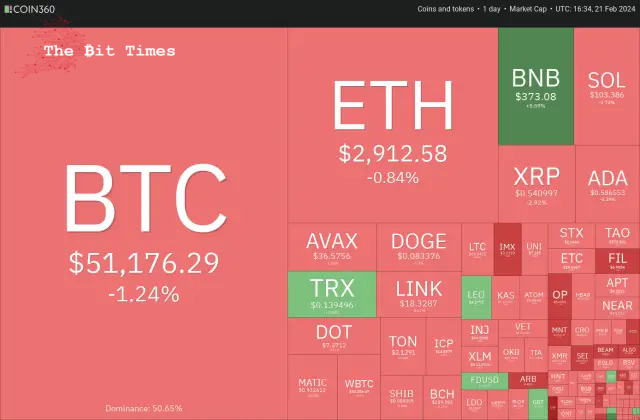
The attempt by bulls to sustain Bitcoin’s market price above $52,000 appears to have faltered, potentially signalling a shift in short-term market dynamics for both BTC and alternative cryptocurrencies.
ビットコインの市場価格を52,000ドル以上に維持しようとする強気派の試みは挫折したようで、BTCと代替仮想通貨の両方の短期的な市場力学の変化を示唆している可能性がある。
Bitcoin (BTC) has recently remained in a consolidation phase, reflecting a fierce struggle between bullish and bearish forces. The prevailing uncertainty raises speculation regarding whether selling pressure will prevail, leading to a short-term downturn, or if buying interest will prevail. This uncertainty weighs heavily on the minds of cryptocurrency investors.
ビットコイン(BTC)は最近、強気勢力と弱気勢力の間の熾烈な争いを反映して、引き続き調整局面にある。不透明感が広がっているため、売り圧力が優勢になって短期的な下落につながるのか、あるいは買い意欲が優勢となるのかについての憶測が高まっている。この不確実性は仮想通貨投資家の心に重くのしかかっています。
With expectations for an imminent rate cut by the Federal Reserve dwindling, profit-taking has ensued in the S&P 500 Index. This development hints at a cautious market sentiment shortly, heightening the likelihood of a retracement in Bitcoin and specific alternative cryptocurrencies.
米連邦準備制度理事会(FRB)による差し迫った利下げへの期待が後退し、S&P500指数には利益確定売りが広がった。この展開は近いうちに慎重な市場心理を示唆しており、ビットコインや特定の代替仮想通貨がリトレースメントする可能性が高まっている。
However, the dip may not change the long-term bullish view. Investors will likely view every dip as a buying opportunity because of Bitcoin’s upcoming halving in April, which has historically been bullish.
しかし、この下落によって長期的な強気の見方が変わることはないかもしれない。歴史的に強気だったビットコインは4月に半減期を迎えるため、投資家はあらゆる下落を買いの機会とみなす可能性が高い。
What essential support levels may arrest the decline in Bitcoin and altcoins? Let’s analyze the charts of the top 10 cryptocurrencies to find out.
ビットコインとアルトコインの下落を阻止できる重要なサポートレベルは何でしょうか?それを知るために、トップ 10 の仮想通貨のチャートを分析してみましょう。
Bitcoin (BTC) Market Analysis
ビットコイン(BTC)市場分析
Bitcoin struggles to sustain above $52,000, indicating that the bears fiercely defend the level.
ビットコインは52,000ドルを超える水準を維持するのに苦労しており、弱気派がその水準を激しく守っていることを示している。
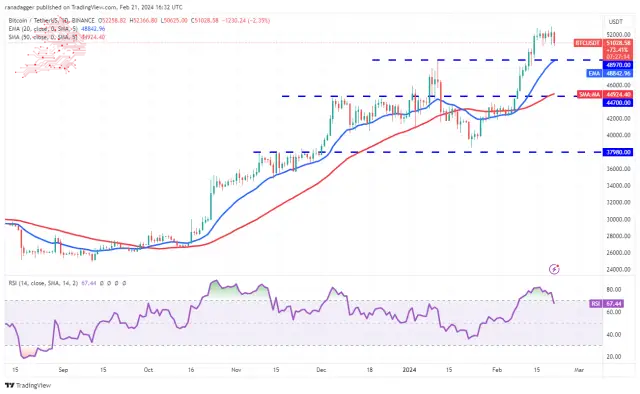
If the price slips below $50,000, short-term traders may give up and book profits. That could pull the BTC/USDT pair to the 20-day exponential moving average ($48,842).
価格が50,000ドルを下回った場合、短期トレーダーは諦めて利益を確定する可能性があります。これにより、BTC/USDTペアは20日間の指数移動平均(4万8842ドル)まで引き上げられる可能性がある。
If the price rebounds off the 20-day EMA with force, it will suggest that the sentiment remains positive and traders are buying at lower levels. That will increase the likelihood of a rally above $52,000. The pair could then jump to $60,000.
価格が20日間EMAから勢いよく反発した場合、センチメントは引き続きポジティブであり、トレーダーがより低いレベルで購入していることを示唆するでしょう。そうなると5万2000ドルを超える上昇の可能性が高まるだろう。そうなると、ペアは6万ドルにまで跳ね上がる可能性がある。
Instead, if the price continues lower and breaks below the 20-day EMA, it will start a pullback to the 50-day simple moving average ($44,924).
代わりに、価格が下落し続けて20日間EMAを下回った場合、50日間の単純移動平均(44,924ドル)への戻りが始まります。
Ether (ETH) Market Analysis
イーサ(ETH)市場分析
イーサは2月21日の3,000ドルの心理的抵抗から反落し、短期トレーダーによる利益確定を示している。
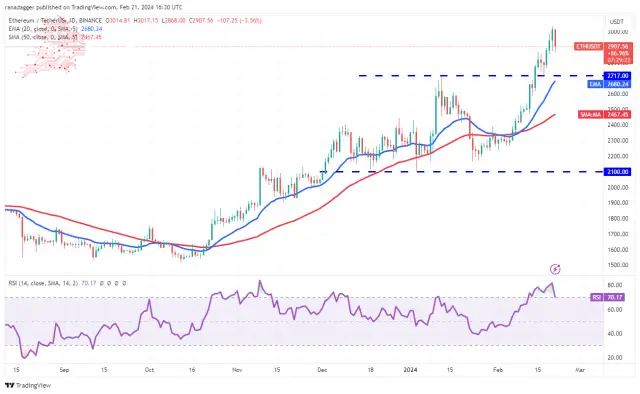
The corrections generally last between one to three days in a strong uptrend. The crucial support on the downside is $2,717. If the price snaps back from $2,717 with force, it will indicate that every minor dip is being purchased aggressively. That will enhance the prospects of a break above $3,000. The ETH/USDT pair may then rally to $3,300.
強い上昇トレンドでは、調整は通常 1 ~ 3 日間続きます。下値の重要なサポートは2,717ドルです。価格が2,717ドルから勢いよく戻った場合、それはあらゆる小さな下落が積極的に購入されていることを示します。これにより、3,000ドルを突破する可能性が高まるだろう。その後、ETH/USDTペアは3,300ドルまで上昇する可能性がある。
Conversely, if bears tug the price below the 20-day EMA ($2,680), it will signal the start of a deeper correction to the 50-day SMA ($2,467).
逆に、弱気派が価格を20日間EMA(2,680ドル)以下に押し下げた場合、50日間SMA(2,467ドル)へのさらなる調整が始まることを示すことになる。
BNB Market Analysis
BNB市場分析
BNB turned up after a brief correction and surged above the $367 resistance on Feb. 21, signalling the resumption of the uptrend.
BNBは短い調整の後上昇し、2月21日に367ドルの抵抗線を超えて急上昇し、上昇トレンドの再開を示しました。
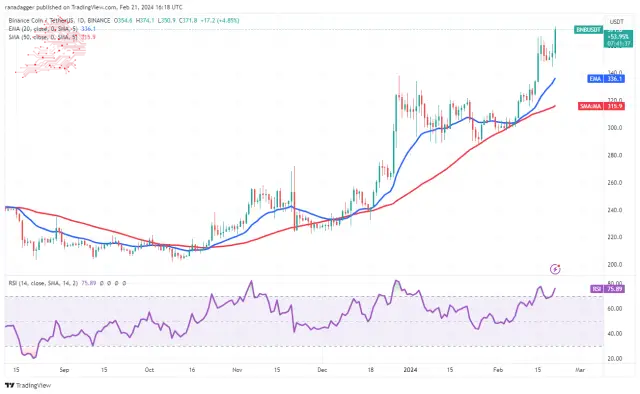
The upsloping moving averages and the RSI in the overbought zone indicate that the bulls are in command. If buyers maintain the price above $368, the BNB/USDT pair could pick up momentum and surge toward $400.
上昇する移動平均線と買われ過ぎゾーンのRSIは、強気派が主導権を握っていることを示しています。買い手が368ドルを超える価格を維持すれば、BNB/USDTペアは勢いを増し、400ドルに向けて急騰する可能性がある。
The first support on the downside is at the 20-day EMA ($336), and the next is the 50-day SMA ($315). The bears must yank the price below the 50-day SMA to indicate a trend change.
下値の最初のサポートは20日間EMA(336ドル)で、次は50日間SMA(315ドル)です。弱気派はトレンドの変化を示すために価格を50日間SMA以下に引き下げる必要がある。
Solana (SOL) Price Analysis
ソラナ (SOL) 価格分析
Solana’s rebound fizzled at $115, and the price turned down on Feb. 19, indicating a lack of higher-level demand.
ソラナの反発は 115 ドルでしぼみ、2 月 19 日に価格は下落し、より高いレベルの需要が存在しないことを示しました。
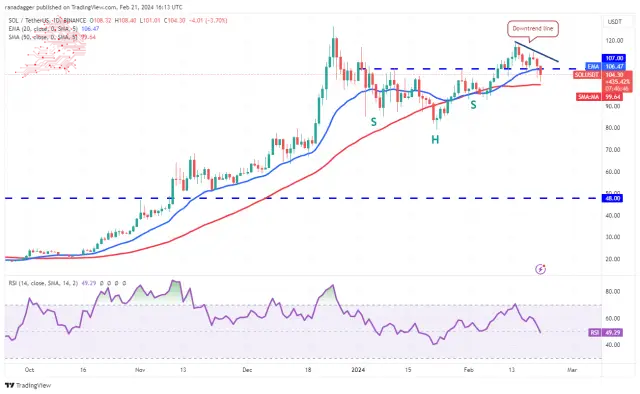
The bears pulled the price below the neckline of the inverse head-and-shoulders pattern on Feb. 21, signalling that the bullish momentum has weakened. The 50-day SMA may act as a support, but it may not hold for long. If the support cracks, the SOL/USDT pair could start a decline to $93, which is a significant level to keep an eye on.
弱気派は2月21日に価格を逆ヘッドアンドショルダーパターンのネックライン以下に引き下げ、強気の勢いが弱まったことを示した。 50 日間の SMA はサポートとして機能する可能性がありますが、長くは維持されない可能性があります。サポートが割れた場合、SOL/USDTペアは93ドルまで下落を始める可能性があり、これは注目すべき重要なレベルである。
The first sign of strength will be a rise above the downtrend line. The pair could then attempt a rally to the overhead resistance of $126.
強さの最初の兆候は、下降トレンドラインを超える上昇です。その後、ペアは126ドルの直上の抵抗線までの上昇を試みる可能性がある。
XRP Price Analysis
XRP closed above the downtrend line on Feb. 19, but the bulls could not clear the hurdle at $0.57. This suggests that every minor relief rally is being sold into.
XRP価格分析 XRPは2月19日に下降トレンドラインを上回って終了しましたが、強気派は0.57ドルのハードルをクリアできませんでした。これは、あらゆる小規模な救済集会が売り込まれていることを示唆しています。
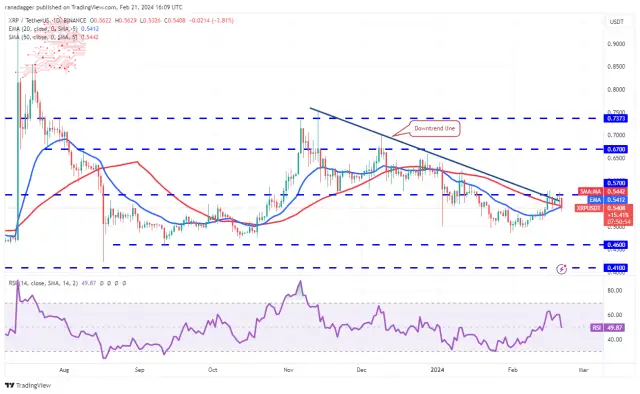
The bears are trying to pull the price below the moving averages. If they succeed, the XRP/USDT pair could dip toward the strong support at $0.46. Buyers are expected to defend this level with vigour.
弱気派は価格を移動平均線以下に引き下げようとしている。それが成功すれば、XRP/USDTペアは0.46ドルの強力なサポートに向けて下落する可能性がある。買い手はこの水準を精力的に守ることが期待される。
If the price rebounds off $0.46, the pair could climb to $0.57 and stay inside this range for some time. A break and close above $0.57 will suggest that the corrective phase may be over. The pair could then attempt a rally to $0.67.
価格が0.46ドルから反発した場合、ペアは0.57ドルまで上昇し、しばらくこの範囲内に留まる可能性がある。 0.57ドルを超えてブレイクして終値を迎えると、調整局面が終了した可能性があることが示唆される。その後、ペアは0.67ドルへの上昇を試みる可能性がある。
Cardano (ADA) Price Analysis
カルダノ (ADA) 価格分析
Cardano turned down from $0.64 on Feb. 20, suggesting profit booking by the short-term traders. The price could reach the 20-day EMA ($0.57).
カルダノは2月20日の0.64ドルから下落し、短期トレーダーによる利益確定を示唆している。価格は20日間EMA(0.57ドル)に達する可能性がある。
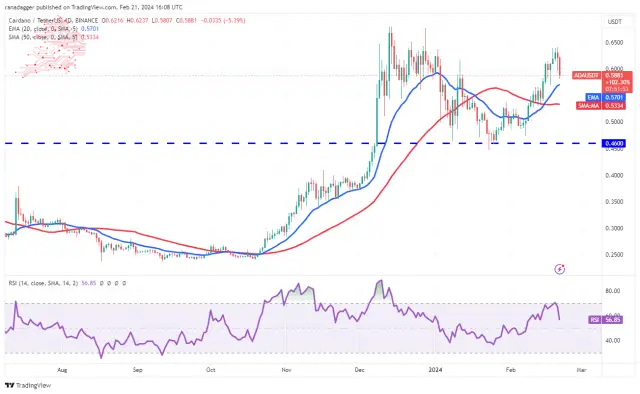
Buyers will have to defend the 20-day EMA aggressively to keep the move intact. If they do that, the ADA/USDT pair could rise to $0.64 and eventually to $0.68. A break and close above this resistance will signal the start of the next leg of the uptrend.
買い手はこの動きを維持するために、20日間EMAを積極的に守る必要があるだろう。そうすれば、ADA/USDTペアは0.64ドルまで上昇し、最終的には0.68ドルまで上昇する可能性がある。このレジスタンスを上抜けて終値を迎えると、上昇トレンドの次の区間の開始の合図となります。
On the contrary, if the price tumbles below the 20-day EMA, it will indicate that the bullish momentum has weakened. The pair may consolidate inside an extensive range between $0.46 and $0.64.
逆に、価格が20日間EMAを下回った場合は、強気の勢いが弱まったことを示します。ペアは0.46ドルから0.64ドルまでの幅広いレンジ内で固まる可能性がある。
Avalanche (AVAX) Price Analysis
アバランチ (AVAX) 価格分析
The bulls defended the 50-day SMA ($36) on Feb. 20, but the bears sold the recovery to the 20-day EMA ($38.22) in Avalanche,
強気派は2月20日に50日間SMA(36ドル)を守りましたが、弱気派はアバランチで20日間EMA(38.22ドル)までの回復を売りました。
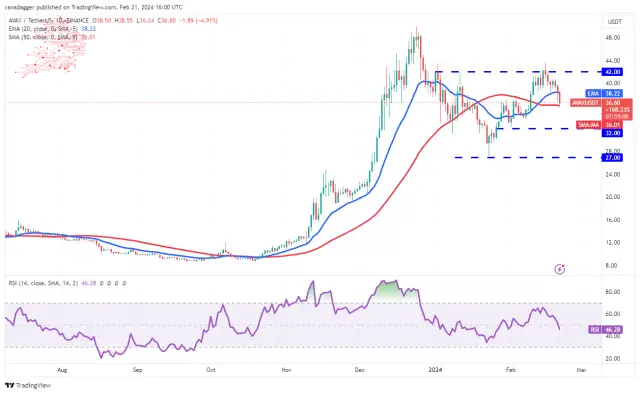
The 20-day EMA has flattened out, and the RSI is just below the midpoint, indicating a range-bound action in the near term. If the price breaks below the 50-day SMA, the AVAX/USDT pair may drop to $32, which will likely be a strong support. A solid rebound off the support could keep the pair between $32 and $42 for a few days.
20 日間 EMA は横ばいとなり、RSI は中間点のすぐ下にあり、短期的にはレンジ内での動きとなることを示しています。価格が50日SMAを下回った場合、AVAX/USDTペアは32ドルまで下落する可能性があり、これが強力なサポートとなる可能性があります。サポートからの堅調な反発があれば、数日間は32ドルから42ドルの間で推移する可能性がある。
On the upside, the bulls must drive and sustain the pair above $42 to complete the inverse head-and-shoulders pattern and gain the upper hand.
上昇局面では、強気派は逆ヘッドアンドショルダーパターンを完成させて優位性を得るために、ペアを42ドル以上に押し上げて維持する必要がある。
Dogecoin (DOGE) Price Analysis
Dogecoin bounced off the 20-day EMA ($0.08) on Feb. 18, but the bulls could not overcome the barrier at $0.09. This suggests a negative sentiment where the bears are selling on rallies.
ドージコイン(DOGE)価格分析 ドージコインは2月18日に20日間EMA(0.08ドル)から反発したが、強気派は0.09ドルの壁を超えることができなかった。これは弱気派が反発して売りを出しているネガティブなセンチメントを示唆している。
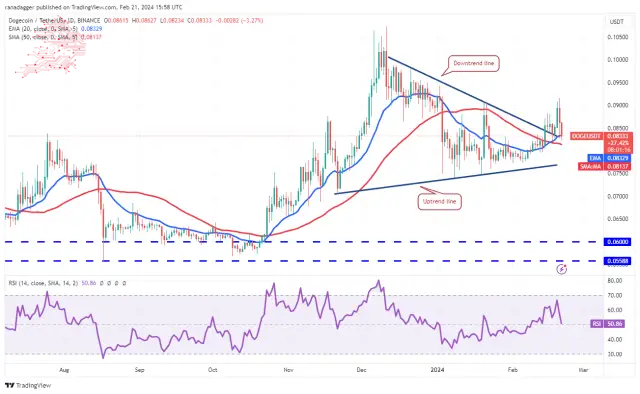
If the price skids below the moving averages, the DOT/USDT pair could drop to the uptrend line. This is an essential level for the bulls to defend because if they fail to do that, the pair may start a descent to $0.07.
価格が移動平均線を下回った場合、DOT/USDTペアは上昇トレンドラインまで下落する可能性があります。これは強気派にとって防御するために不可欠なレベルであり、それができなかった場合、ペアは0.07ドルまで下落を始める可能性があるためです。
This negative view will be invalidated in the short term if the price rebounds off the current level and rises above $0.09. That opens the doors for a rally to the $0.10 to $0.11 resistance zone.
価格が現在の水準から反発して0.09ドルを超えれば、この否定的な見方は短期的には無効になるだろう。これにより、0.10ドルから0.11ドルのレジスタンスゾーンへの上昇への扉が開かれることになる。
Chainlink (LINK) Price Analysis
チェーンリンク (LINK) 価格分析
Chainlink bounced off the 20-day EMA ($18.81) on Feb. 20, but the bulls could not build upon the recovery. The price turned down and slipped below the 20-day EMA on Feb. 21.
チェーンリンクは2月20日に20日間EMA(18.81ドル)から反発したが、強気派は回復をさらに発展させることができなかった。価格は下落に転じ、2月21日には20日間EMAを下回った。
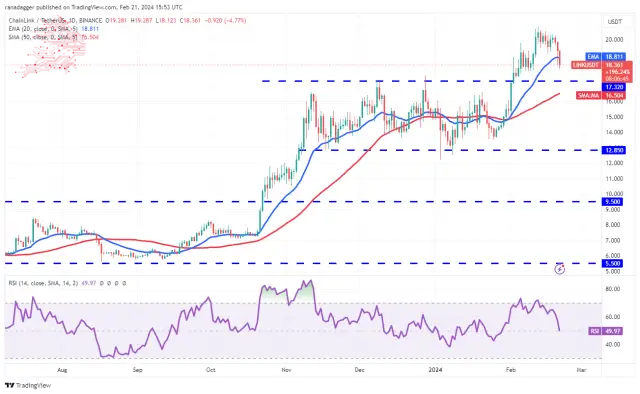
The next stop on the downside is the breakout level of $17.32. This level may witness a tough battle between the bulls and the bears. If the price rebounds off $17.32 with strength, the LINK/USDT pair may rise to the 20-day EMA and later to the overhead resistance at $20.85.
次の下値ストップは17.32ドルのブレイクアウトレベルです。このレベルでは、強気派と弱気派の間の激しい戦いが見られるかもしれません。価格が17.32ドルから力強く反発した場合、LINK/USDTペアは20日間EMAまで上昇し、その後は20.85ドルの直上の抵抗線まで上昇する可能性があります。
The zone between $17.32 and the 50-day SMA ($16.51) will likely act as a formidable support on the downside. A break below this zone will suggest a potential trend change in the near term.
17.32ドルと50日SMA(16.51ドル)の間のゾーンは、下値の強力なサポートとして機能する可能性が高い。このゾーンを下回ると、短期的にトレンドが変化する可能性があることが示唆されます。
Polkadot (DOT) Price Analysis
Polkadot’s recovery stalled near the 61.8% Fibonacci retracement level of $8.21, indicating that bears continue to sell on rallies.
ポルカドット (DOT) 価格分析 ポルカドットの回復は 61.8% のフィボナッチ リトレースメント レベルである 8.21 ドル付近で停滞しており、弱気派が反発で売りを続けていることを示しています。
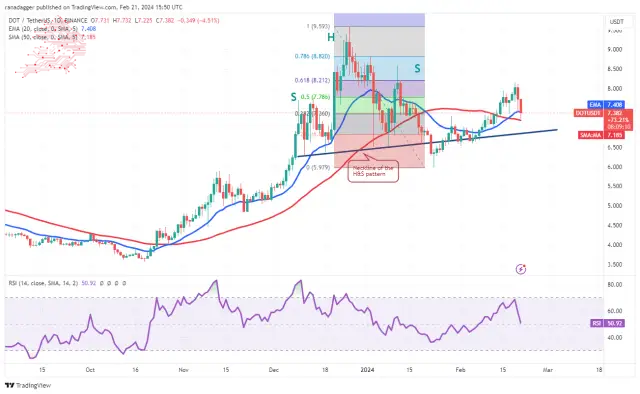
The DOT/USDT pair has reached the 50-day SMA ($7.18), a significant level to watch out for. If this level gives way, it will suggest that the bulls are losing their grip. The pair could then drop to the neckline and subsequently to $6.
DOT/USDTペアは50日間SMA(7.18ドル)に達しており、注目すべき重要な水準となっている。この水準が崩れれば、強気派がグリップ力を失いつつあることを示唆するだろう。その後、ペアはネックラインまで下落し、その後6ドルまで下落する可能性がある。
The flattening 20-day EMA and the RSI near the midpoint suggest a range-bound action in the near term. If the price rebounds off the neckline, the pair could reach $8.21 and stay range-bound between these two levels for some time. The Bulls will be back in the game on a close above $8.21.
平坦化している 20 日間 EMA と中間点付近の RSI は、短期的にはレンジ内での行動を示唆しています。価格がネックラインから反発した場合、ペアは8.21ドルに達し、しばらくの間これら2つのレベルの間でレンジ内にとどまる可能性がある。ブルズは8.21ドルを超える終値で試合に戻ることになる。
Source – Rakesh Upadhyay
出典 – ラケシュ・ウパディヤイ
Source: https://thebittimes.com/latest-market-overview-21st-feb-btc-eth-bnb-sol-xrp-ada-avax-doge-link-dot-tbt86045.html
出典: https://thebittimes.com/latest-market-overview-21st-feb-btc-eth-bnb-sol-xrp-ada-avax-doge-link-dot-tbt86045.html
 Coin Edition
 Optimisus
 TheCoinrise Media
 DogeHome
 Optimisus
 BH NEWS
 The Blockopedia
 COINTURK NEWS
 Crypto News Land


