


The attempt by bulls to sustain Bitcoin’s market price above $52,000 appears to have faltered, potentially signalling a shift in short-term market dynamics for both BTC and alternative cryptocurrencies.
多头将比特币市场价格维持在 52,000 美元以上的尝试似乎已经动摇,这可能预示着 BTC 和其他加密货币的短期市场动态发生了变化。
Bitcoin (BTC) has recently remained in a consolidation phase, reflecting a fierce struggle between bullish and bearish forces. The prevailing uncertainty raises speculation regarding whether selling pressure will prevail, leading to a short-term downturn, or if buying interest will prevail. This uncertainty weighs heavily on the minds of cryptocurrency investors.
比特币(BTC)最近仍处于盘整阶段,反映出多头和空头力量之间的激烈斗争。普遍存在的不确定性引发了人们的猜测:抛售压力是否会占上风,导致短期低迷,或者买盘兴趣是否会占上风。这种不确定性严重影响了加密货币投资者的心。
With expectations for an imminent rate cut by the Federal Reserve dwindling, profit-taking has ensued in the S&P 500 Index. This development hints at a cautious market sentiment shortly, heightening the likelihood of a retracement in Bitcoin and specific alternative cryptocurrencies.
随着美联储即将降息的预期减弱,标普500指数出现获利了结。这一事态发展暗示市场情绪很快会变得谨慎,从而增加了比特币和特定替代加密货币回调的可能性。
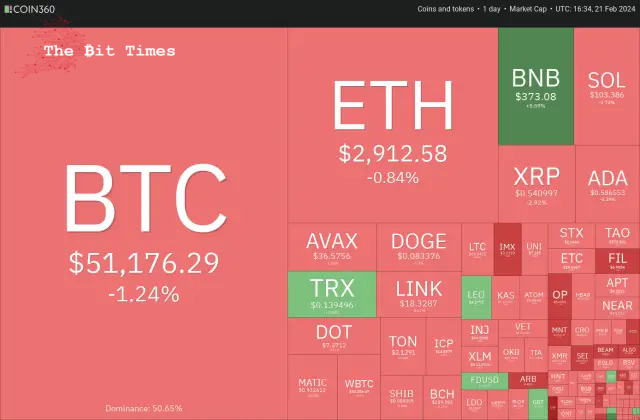
However, the dip may not change the long-term bullish view. Investors will likely view every dip as a buying opportunity because of Bitcoin’s upcoming halving in April, which has historically been bullish.
然而,下跌可能不会改变长期看涨观点。投资者可能会将每次下跌视为买入机会,因为比特币即将在四月份减半,这在历史上一直是看涨的。
What essential support levels may arrest the decline in Bitcoin and altcoins? Let’s analyze the charts of the top 10 cryptocurrencies to find out.
哪些重要的支撑位可以阻止比特币和山寨币的下跌?让我们分析一下前 10 名加密货币的图表来找出答案。
Bitcoin (BTC) Market Analysis
比特币(BTC)市场分析
Bitcoin struggles to sustain above $52,000, indicating that the bears fiercely defend the level.
比特币难以维持在 52,000 美元上方,表明空头正在激烈捍卫该水平。
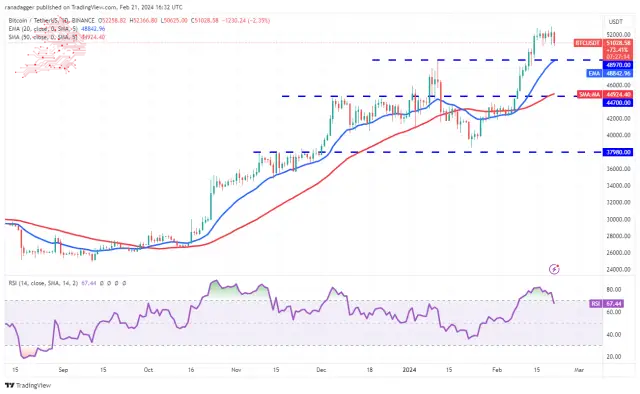
If the price slips below $50,000, short-term traders may give up and book profits. That could pull the BTC/USDT pair to the 20-day exponential moving average ($48,842).
如果价格跌破 50,000 美元,短线交易者可能会放弃并获利了结。这可能会将 BTC/USDT 货币对拉至 20 天指数移动平均线(48,842 美元)。
If the price rebounds off the 20-day EMA with force, it will suggest that the sentiment remains positive and traders are buying at lower levels. That will increase the likelihood of a rally above $52,000. The pair could then jump to $60,000.
如果价格从 20 日均线强力反弹,则表明市场情绪依然乐观,交易者正在较低水平买入。这将增加反弹至 52,000 美元上方的可能性。随后该货币对可能会跃升至 60,000 美元。
Instead, if the price continues lower and breaks below the 20-day EMA, it will start a pullback to the 50-day simple moving average ($44,924).
相反,如果价格继续走低并跌破 20 日均线,它将开始回调至 50 日简单移动平均线(44,924 美元)。
Ether (ETH) Market Analysis
以太坊(ETH)市场分析
2 月 21 日,以太币从 3,000 美元的心理阻力位回落,表明短期交易者获利了结。
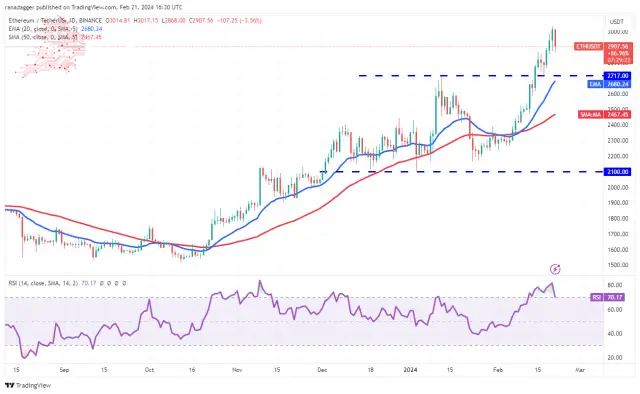
The corrections generally last between one to three days in a strong uptrend. The crucial support on the downside is $2,717. If the price snaps back from $2,717 with force, it will indicate that every minor dip is being purchased aggressively. That will enhance the prospects of a break above $3,000. The ETH/USDT pair may then rally to $3,300.
在强劲的上升趋势中,修正通常会持续一到三天。下行的关键支撑位是 2,717 美元。如果价格从 2,717 美元强力反弹,则表明每次小幅下跌都被积极买入。这将增强其突破 3,000 美元的前景。随后 ETH/USDT 货币对可能会上涨至 3,300 美元。
Conversely, if bears tug the price below the 20-day EMA ($2,680), it will signal the start of a deeper correction to the 50-day SMA ($2,467).
相反,如果空头将价格拉低至 20 日均线(2,680 美元)下方,则将预示着 50 日均线(2,467 美元)将开始进一步修正。
BNB Market Analysis
BNB市场分析
BNB turned up after a brief correction and surged above the $367 resistance on Feb. 21, signalling the resumption of the uptrend.
BNB 经过短暂调整后出现上涨,并于 2 月 21 日飙升至 367 美元阻力位上方,标志着上升趋势的恢复。
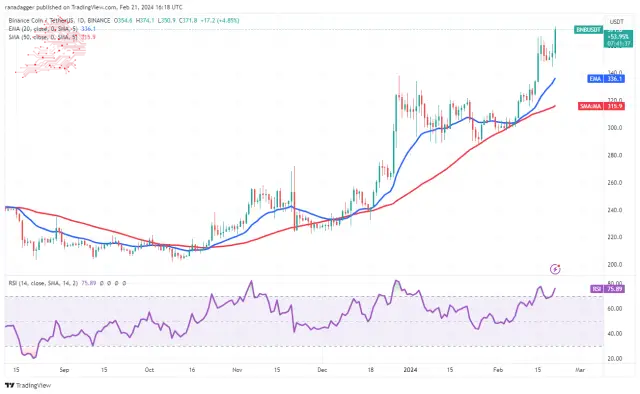
The upsloping moving averages and the RSI in the overbought zone indicate that the bulls are in command. If buyers maintain the price above $368, the BNB/USDT pair could pick up momentum and surge toward $400.
向上倾斜的移动平均线和超买区域的 RSI 表明多头处于主导地位。如果买家将价格维持在 368 美元以上,BNB/USDT 货币对可能会加速并飙升至 400 美元。
The first support on the downside is at the 20-day EMA ($336), and the next is the 50-day SMA ($315). The bears must yank the price below the 50-day SMA to indicate a trend change.
下行的第一个支撑位是 20 日均线(336 美元),下一个支撑位是 50 日均线(315 美元)。空头必须将价格拉至 50 日均线下方才能表明趋势发生变化。
Solana (SOL) Price Analysis
Solana (SOL) 价格分析
Solana’s rebound fizzled at $115, and the price turned down on Feb. 19, indicating a lack of higher-level demand.
Solana 的反弹在 115 美元处失败,价格在 2 月 19 日开始下跌,表明缺乏更高层次的需求。
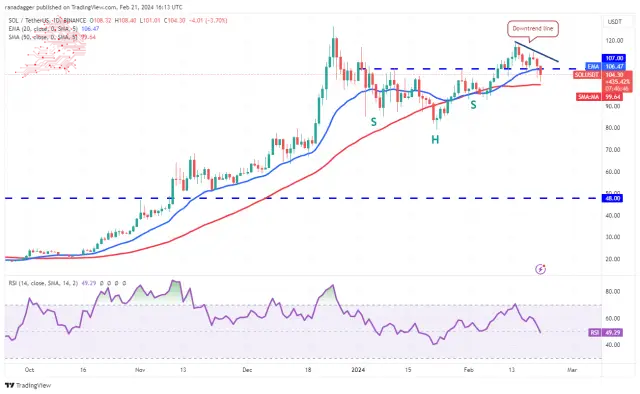
The bears pulled the price below the neckline of the inverse head-and-shoulders pattern on Feb. 21, signalling that the bullish momentum has weakened. The 50-day SMA may act as a support, but it may not hold for long. If the support cracks, the SOL/USDT pair could start a decline to $93, which is a significant level to keep an eye on.
2 月 21 日,空头将价格拉低至反向头肩形态的颈线下方,表明看涨势头已经减弱。 50日均线可能会起到支撑作用,但可能不会维持太久。如果支撑位破裂,SOL/USDT 货币对可能会开始下跌至 93 美元,这是一个值得关注的重要水平。
The first sign of strength will be a rise above the downtrend line. The pair could then attempt a rally to the overhead resistance of $126.
强势的第一个迹象将是升破下降趋势线。随后该货币对可能会尝试反弹至上方阻力位 126 美元。
XRP Price Analysis
XRP closed above the downtrend line on Feb. 19, but the bulls could not clear the hurdle at $0.57. This suggests that every minor relief rally is being sold into.
XRP 价格分析 XRP 于 2 月 19 日收于下降趋势线上方,但多头未能突破 0.57 美元的障碍。这表明每次小幅缓解反弹都被抛售。
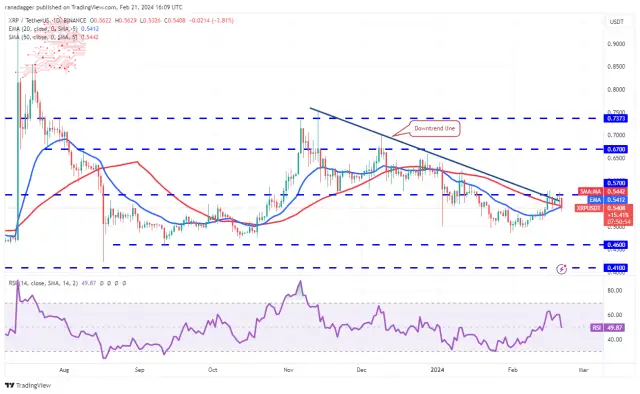
The bears are trying to pull the price below the moving averages. If they succeed, the XRP/USDT pair could dip toward the strong support at $0.46. Buyers are expected to defend this level with vigour.
空头正试图将价格拉至移动平均线以下。如果成功,XRP/USDT 货币对可能会跌向 0.46 美元的强劲支撑位。预计买家将大力捍卫这一水平。
If the price rebounds off $0.46, the pair could climb to $0.57 and stay inside this range for some time. A break and close above $0.57 will suggest that the corrective phase may be over. The pair could then attempt a rally to $0.67.
如果价格从 0.46 美元反弹,该货币对可能会攀升至 0.57 美元,并在该区间内停留一段时间。突破并收盘于 0.57 美元之上将表明修正阶段可能已经结束。随后该货币对可能会尝试反弹至 0.67 美元。
Cardano (ADA) Price Analysis
卡尔达诺(ADA)价格分析
Cardano turned down from $0.64 on Feb. 20, suggesting profit booking by the short-term traders. The price could reach the 20-day EMA ($0.57).
卡尔达诺从 2 月 20 日的 0.64 美元下跌,表明短期交易者获利了结。价格可能触及 20 日均线(0.57 美元)。
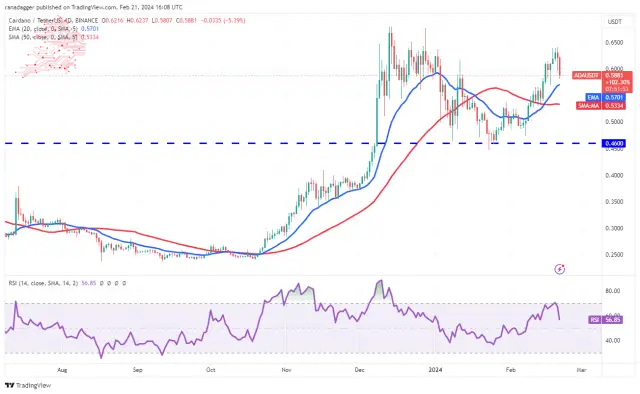
Buyers will have to defend the 20-day EMA aggressively to keep the move intact. If they do that, the ADA/USDT pair could rise to $0.64 and eventually to $0.68. A break and close above this resistance will signal the start of the next leg of the uptrend.
买家必须积极捍卫 20 日均线才能保持走势不变。如果他们这样做,ADA/USDT 货币对可能会上涨至 0.64 美元,最终升至 0.68 美元。突破并收盘于该阻力位之上将标志着下一阶段上升趋势的开始。
On the contrary, if the price tumbles below the 20-day EMA, it will indicate that the bullish momentum has weakened. The pair may consolidate inside an extensive range between $0.46 and $0.64.
相反,如果价格跌破20日均线,则表明看涨势头减弱。该货币对可能会在 0.46 美元至 0.64 美元之间的广泛区间内盘整。
Avalanche (AVAX) Price Analysis
雪崩 (AVAX) 价格分析
The bulls defended the 50-day SMA ($36) on Feb. 20, but the bears sold the recovery to the 20-day EMA ($38.22) in Avalanche,
多头在 2 月 20 日捍卫了 50 日均线(36 美元),但空头在 Avalanche 中将反弹卖出至 20 日均线(38.22 美元),
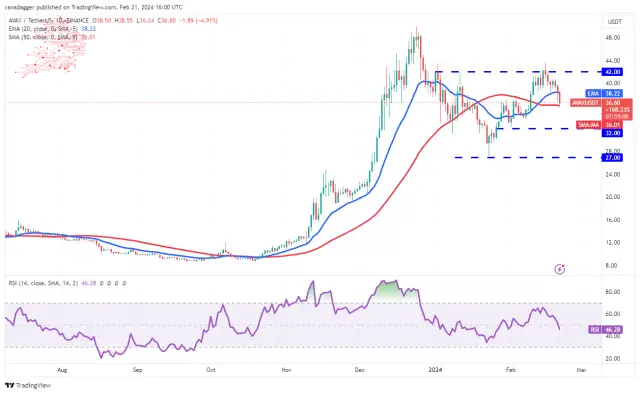
The 20-day EMA has flattened out, and the RSI is just below the midpoint, indicating a range-bound action in the near term. If the price breaks below the 50-day SMA, the AVAX/USDT pair may drop to $32, which will likely be a strong support. A solid rebound off the support could keep the pair between $32 and $42 for a few days.
20 日均线已趋于平缓,RSI 略低于中点,表明近期将呈区间波动。如果价格跌破 50 日移动平均线,AVAX/USDT 货币对可能会跌至 32 美元,这可能是一个强有力的支撑。脱离支撑位的强劲反弹可能会使该货币对在几天内保持在 32 美元至 42 美元之间。
On the upside, the bulls must drive and sustain the pair above $42 to complete the inverse head-and-shoulders pattern and gain the upper hand.
从好的方面来看,多头必须推动并维持该货币对高于 42 美元,才能完成反向头肩形态并占据上风。
Dogecoin (DOGE) Price Analysis
Dogecoin bounced off the 20-day EMA ($0.08) on Feb. 18, but the bulls could not overcome the barrier at $0.09. This suggests a negative sentiment where the bears are selling on rallies.
狗狗币 (DOGE) 价格分析 狗狗币于 2 月 18 日从 20 日均线(0.08 美元)反弹,但多头未能突破 0.09 美元的关口。这表明空头逢高抛售的负面情绪。
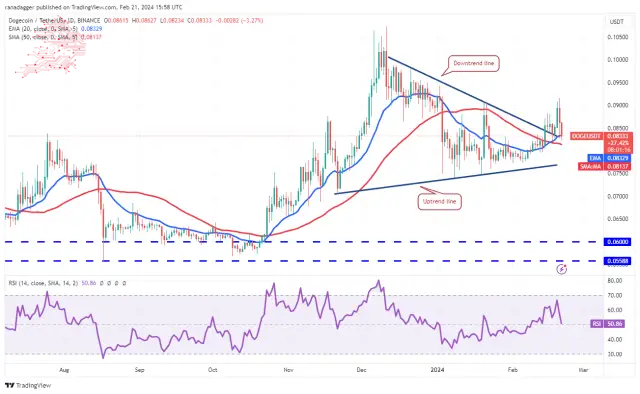
If the price skids below the moving averages, the DOT/USDT pair could drop to the uptrend line. This is an essential level for the bulls to defend because if they fail to do that, the pair may start a descent to $0.07.
如果价格跌破移动平均线,DOT/USDT 货币对可能会跌至上升趋势线。这是多头必须捍卫的重要水平,因为如果他们未能做到这一点,该货币对可能会开始下跌至 0.07 美元。
This negative view will be invalidated in the short term if the price rebounds off the current level and rises above $0.09. That opens the doors for a rally to the $0.10 to $0.11 resistance zone.
如果价格从当前水平反弹并升至 0.09 美元以上,这种负面观点将在短期内失效。这为反弹至 0.10 美元至 0.11 美元阻力区打开了大门。
Chainlink (LINK) Price Analysis
Chainlink (LINK) 价格分析
Chainlink bounced off the 20-day EMA ($18.81) on Feb. 20, but the bulls could not build upon the recovery. The price turned down and slipped below the 20-day EMA on Feb. 21.
Chainlink 于 2 月 20 日从 20 日均线(18.81 美元)反弹,但多头无法在复苏的基础上再接再厉。 2 月 21 日,价格下跌并跌破 20 日均线。
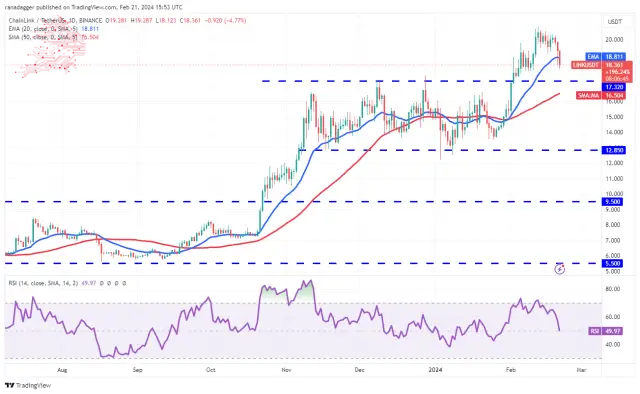
The next stop on the downside is the breakout level of $17.32. This level may witness a tough battle between the bulls and the bears. If the price rebounds off $17.32 with strength, the LINK/USDT pair may rise to the 20-day EMA and later to the overhead resistance at $20.85.
下行的下一站是突破 17.32 美元。这个水平可能会见证多头和空头之间的一场硬仗。如果价格从 17.32 美元强劲反弹,LINK/USDT 货币对可能会升至 20 日均线,然后升至上方阻力位 20.85 美元。
The zone between $17.32 and the 50-day SMA ($16.51) will likely act as a formidable support on the downside. A break below this zone will suggest a potential trend change in the near term.
17.32 美元和 50 日移动平均线(16.51 美元)之间的区域可能会成为下行的强大支撑。跌破该区域将表明近期趋势可能发生变化。
Polkadot (DOT) Price Analysis
Polkadot’s recovery stalled near the 61.8% Fibonacci retracement level of $8.21, indicating that bears continue to sell on rallies.
Polkadot (DOT) 价格分析 Polkadot 的复苏在 8.21 美元的 61.8% 斐波那契回撤位附近陷入停滞,表明空头继续逢高抛售。
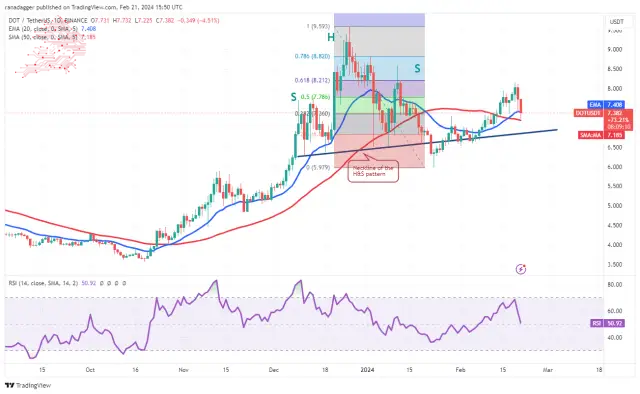
The DOT/USDT pair has reached the 50-day SMA ($7.18), a significant level to watch out for. If this level gives way, it will suggest that the bulls are losing their grip. The pair could then drop to the neckline and subsequently to $6.
DOT/USDT 货币对已触及 50 日移动平均线(7.18 美元),这是一个值得关注的重要水平。如果这个水平让步,则表明多头正在失去控制。然后该货币对可能会跌至颈线,随后跌至 6 美元。
The flattening 20-day EMA and the RSI near the midpoint suggest a range-bound action in the near term. If the price rebounds off the neckline, the pair could reach $8.21 and stay range-bound between these two levels for some time. The Bulls will be back in the game on a close above $8.21.
趋平的 20 日均线和 RSI 接近中点表明近期将出现区间波动。如果价格从颈线反弹,该货币对可能会达到 8.21 美元,并在一段时间内在这两个水平之间保持区间波动。公牛队将以高于 8.21 美元的收盘价重返比赛。
Source – Rakesh Upadhyay
来源——Rakesh Upadhyay
Source: https://thebittimes.com/latest-market-overview-21st-feb-btc-eth-bnb-sol-xrp-ada-avax-doge-link-dot-tbt86045.html
资料来源:https://thebittimes.com/latest-market-overview-21st-feb-btc-eth-bnb-sol-xrp-ada-avax-doge-link-dot-tbt86045.html
 Optimisus
 Crypto Intelligence
 DogeHome
 Coincu
 Times Tabloid
 CFN
CFN Crypto News Land
 Optimisus
 Optimisus


