Is the Memecoin Rally Over as MEMEAI and PEPE Tokens Suggest a 30% Plunge?
MEMEAI 및 PEPE 토큰이 30% 급락을 제안함에 따라 Memecoin 랠리는 끝났습니까?
The cryptocurrency market has shed its $2 trillion valuation, currently valued at $1.98 trillion, following a 7.82% decline in the last 24 hours. The 24-hour trading volume stands at $116.88 billion. Bitcoin has reached its lowest point since February at $53,717.38.
암호화폐 시장은 지난 24시간 동안 7.82% 하락한 후 현재 1조 9,800억 달러로 평가되는 2조 달러의 가치를 잃었습니다. 24시간 거래량은 1,168억 8천만 달러입니다. 비트코인은 53,717.38달러로 2월 이후 최저점에 도달했습니다.
Memecoins, once thriving, have experienced a significant correction, with leading tokens losing over 15% each. Amidst the prevailing bearish sentiment, it remains unclear whether memecoins will rebound this month.
한때 번성했던 Memecoin은 주요 토큰이 각각 15% 이상 손실을 입는 등 상당한 조정을 경험했습니다. 약세 정서가 만연한 가운데, 이번 달 밈코인이 반등할지는 아직 불분명합니다.
Pepe (PEPE) Price Analysis:
페페(PEPE) 가격 분석:
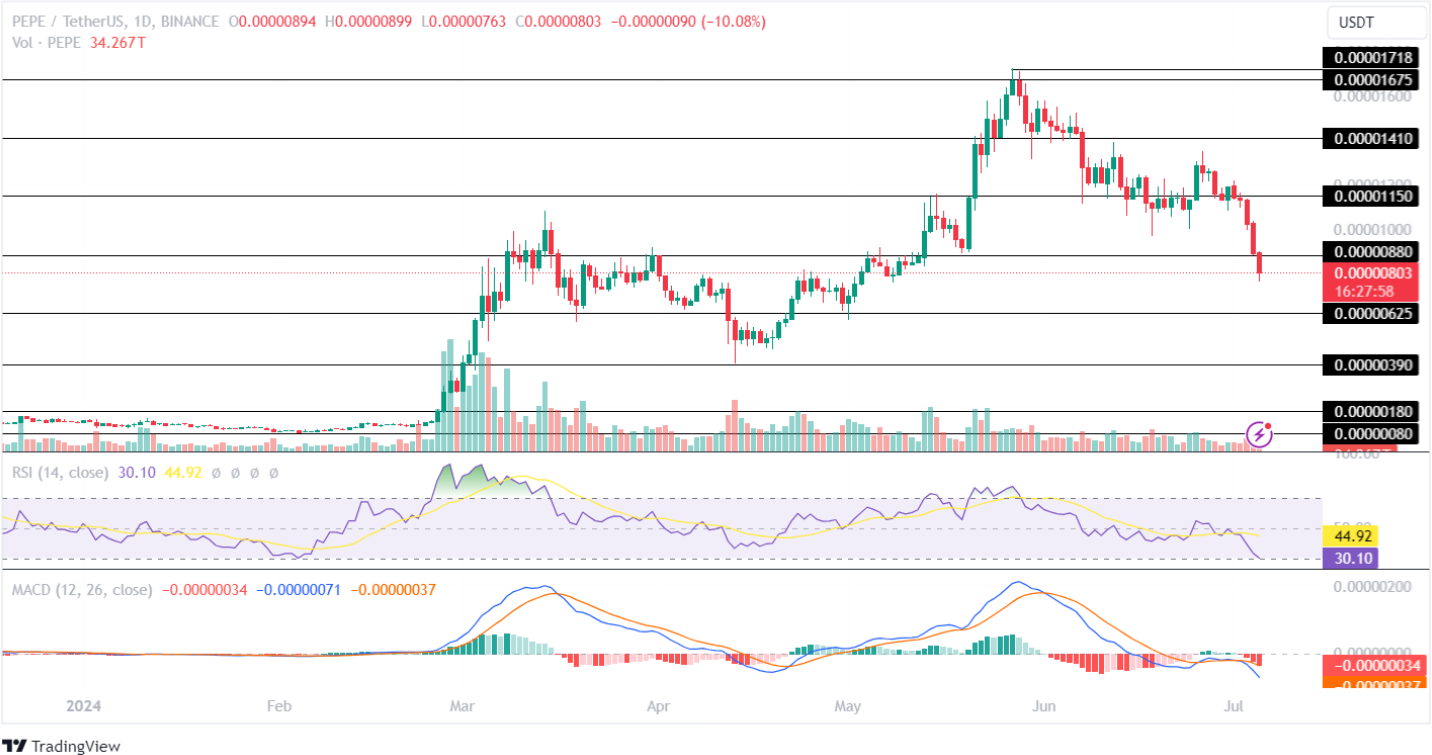
The Pepe token has depreciated 16.84% in the last 24 hours and 36.02% over the past week. A month-long plunge of 46.74% indicates growing bearishness.
Pepe 토큰은 지난 24시간 동안 16.84%, 지난 주 동안 36.02% 하락했습니다. 한 달 동안 46.74%의 급락은 약세가 커지고 있음을 나타냅니다.

TradingView: PEPE/USDT
TradingView: PEPE/USDT
The Moving Average Convergence Divergence (MACD) displays a sharp rise in the red histogram, signaling intensified selling pressure. The averages trend negatively, suggesting ongoing momentum loss.
MACD(Moving Average Convergence Divergence)의 빨간색 히스토그램이 급격히 상승하여 매도 압력이 강화되었음을 나타냅니다. 평균은 부정적인 추세를 보이며 지속적인 모멘텀 손실을 시사합니다.
The RSI indicator has fallen below its midpoint in the 1D time frame, indicating elevated selling activity.
RSI 지표는 1D 기간의 중간점 아래로 떨어졌으며 이는 판매 활동이 증가했음을 나타냅니다.
If bulls regain control, Pepe will attempt to test its resistance level of $0.00001150. Conversely, continued bearish dominance may push Pepe toward its support level of $0.00000625.
황소가 통제권을 되찾으면 Pepe는 $0.00001150의 저항 수준을 테스트하려고 시도할 것입니다. 반대로, 지속적인 약세 지배력으로 인해 Pepe는 $0.00000625의 지원 수준으로 밀려날 수 있습니다.
Meme Ai (MEMEAI) Price Analysis:
Meme Ai(MEMEAI) 가격 분석:
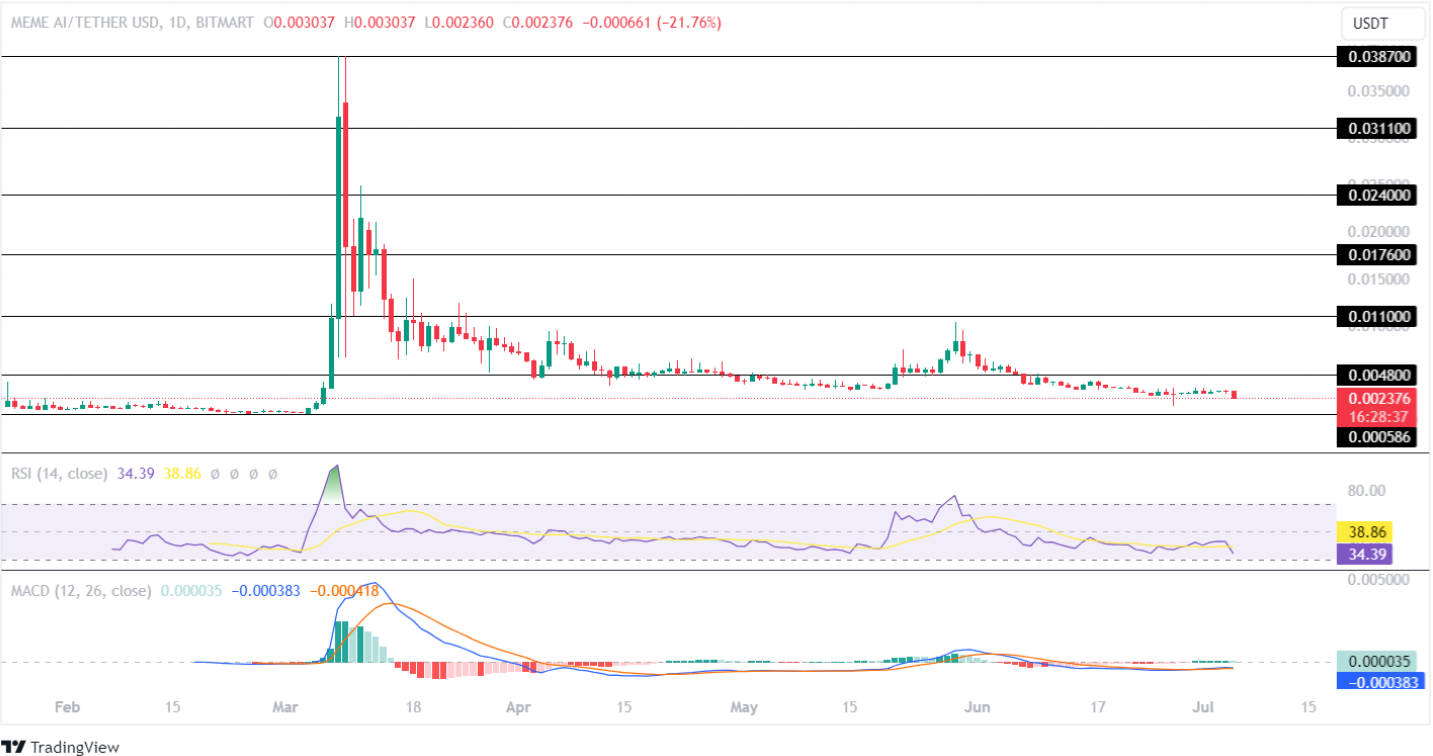
MEMEAI has experienced a 12.89% correction within 24 hours and 14.92% over the past week. A 30-day decline of 53.63% suggests a pessimistic outlook.
MEMEAI는 24시간 내 12.89%, 지난주 14.92%의 조정을 경험했습니다. 30일간 53.63% 하락한 것은 비관적인 전망을 시사합니다.

TradingView: MEMEAI/USDT
TradingView: MEMEAI/USDT
The Relative Strength Index (RSI) has plummeted, indicating increased bearish sentiment. The average trendline crosses negatively, pointing to a potential loss of momentum.
상대강도지수(RSI)가 급락해 약세 심리가 높아졌음을 나타냅니다. 평균 추세선이 마이너스 방향으로 교차하여 모멘텀 손실 가능성을 나타냅니다.
The MACD exhibits a neutral flatline, indicating weak price action. The averages also trend neutrally, suggesting uncertainty in MEMEAI's future price movement.
MACD는 중립 평면선을 보이고 있어 가격 움직임이 약함을 나타냅니다. 평균 또한 중립적인 추세를 보이고 있어 MEMEAI의 향후 가격 변동에 대한 불확실성을 시사합니다.
If the market recovers, MEMEAI may test its resistance level of $0.0048. However, persistent bearishness could drive it towards its support level of $0.000586.
시장이 회복되면 MEMEAI는 $0.0048의 저항 수준을 테스트할 수 있습니다. 그러나 지속적인 약세로 인해 $0.000586의 지원 수준에 도달할 수 있습니다.


 Crypto Daily™
 Crypto Daily™
 DogeHome
 TheCoinrise Media
 Thecoinrepublic.com
 TheCoinrise Media
 TheCoinrise Media
 Cryptopolitan_News


