Is the Memecoin Rally Over as MEMEAI and PEPE Tokens Suggest a 30% Plunge?
MEMEAI 和 PEPE 代幣暗示暴跌 30%,Memecoin 漲勢是否已結束?
The cryptocurrency market has shed its $2 trillion valuation, currently valued at $1.98 trillion, following a 7.82% decline in the last 24 hours. The 24-hour trading volume stands at $116.88 billion. Bitcoin has reached its lowest point since February at $53,717.38.
加密貨幣市場在過去 24 小時內下跌 7.82% 後,估值已下跌 2 兆美元,目前估值為 1.98 兆美元。 24小時交易量為1168.8億美元。比特幣已觸及 2 月以來的最低點 53,717.38 美元。
Memecoins, once thriving, have experienced a significant correction, with leading tokens losing over 15% each. Amidst the prevailing bearish sentiment, it remains unclear whether memecoins will rebound this month.
Memecoin 曾經一度繁榮,但經歷了重大調整,領先的代幣均下跌超過 15%。在普遍的看跌情緒中,目前尚不清楚迷因幣本月是否會反彈。
Pepe (PEPE) Price Analysis:
佩佩(PEPE)價格分析:
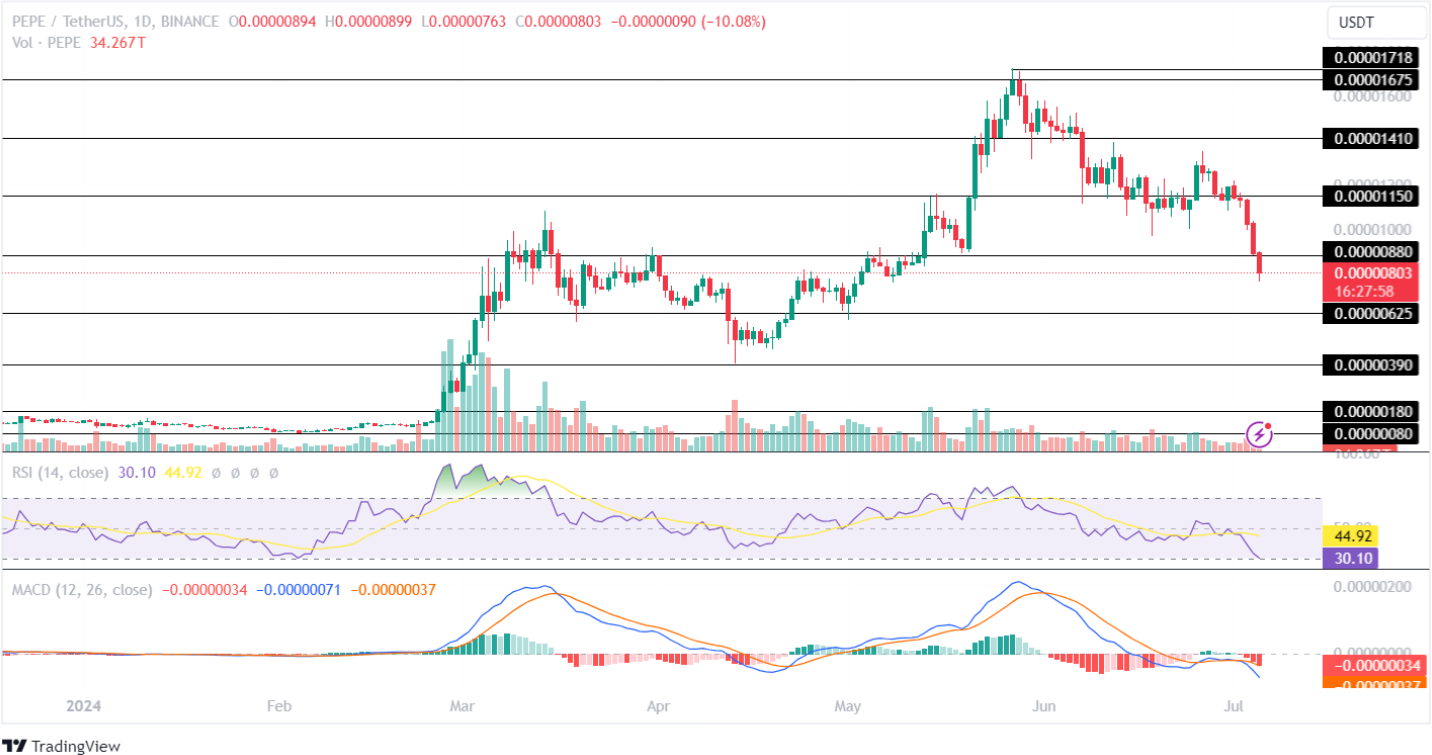
The Pepe token has depreciated 16.84% in the last 24 hours and 36.02% over the past week. A month-long plunge of 46.74% indicates growing bearishness.
Pepe 代幣在過去 24 小時內貶值了 16.84%,在過去一周貶值了 36.02%。長達一個月的暴跌 46.74% 表示看跌情緒日益加劇。

TradingView: PEPE/USDT
交易檢視:PEPE/USDT
The Moving Average Convergence Divergence (MACD) displays a sharp rise in the red histogram, signaling intensified selling pressure. The averages trend negatively, suggesting ongoing momentum loss.
移動平均線趨同分歧(MACD)顯示紅色長條圖急劇上升,顯示賣壓加劇。平均趨勢呈負面趨勢,顯示動能持續喪失。
The RSI indicator has fallen below its midpoint in the 1D time frame, indicating elevated selling activity.
RSI 指標已跌破一維時間框架的中點,顯示拋售活動增加。
If bulls regain control, Pepe will attempt to test its resistance level of $0.00001150. Conversely, continued bearish dominance may push Pepe toward its support level of $0.00000625.
如果多頭重新獲得控制權,佩佩將嘗試測試 0.00001150 美元的阻力位。相反,持續的看跌主導地位可能會將 Pepe 推向 0.00000625 美元的支撐位。
Meme Ai (MEMEAI) Price Analysis:
米姆艾(MEMEAI)價格分析:
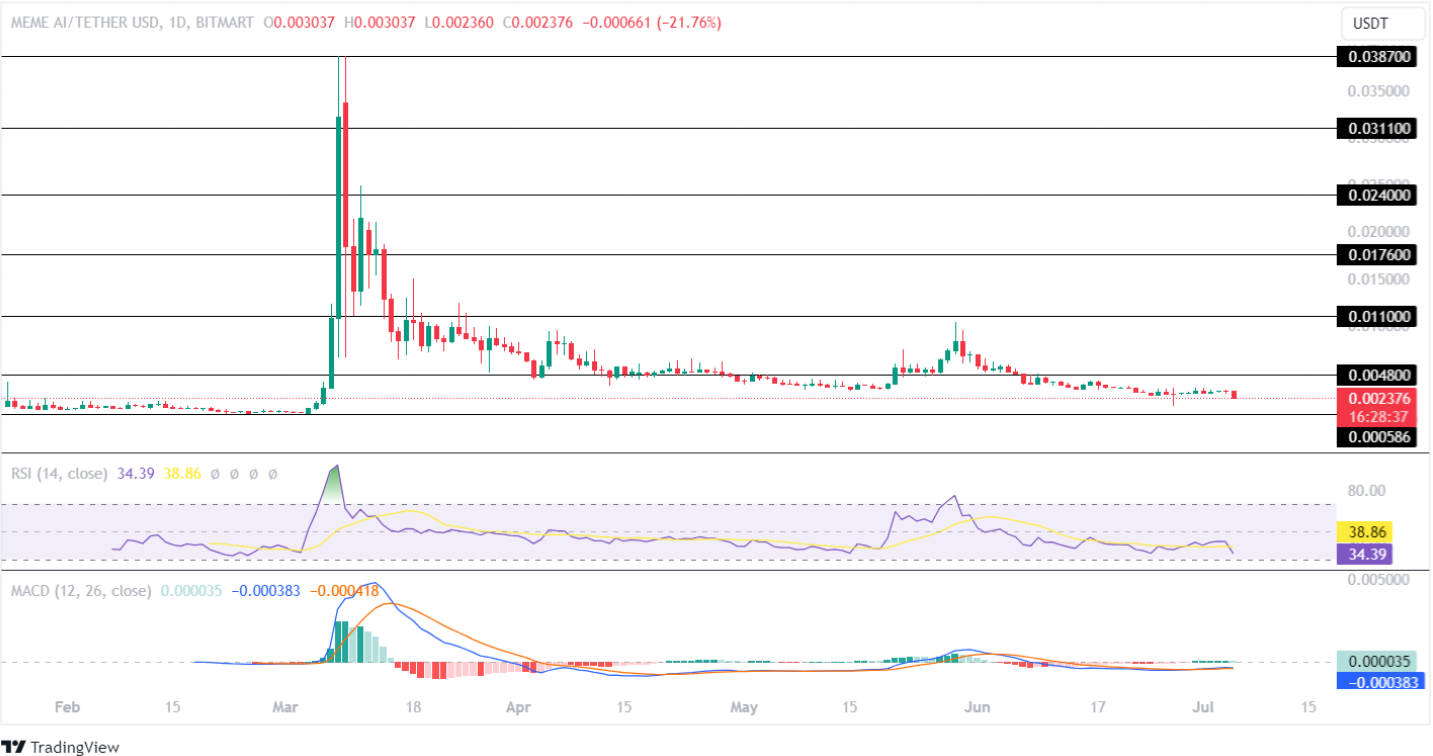
MEMEAI has experienced a 12.89% correction within 24 hours and 14.92% over the past week. A 30-day decline of 53.63% suggests a pessimistic outlook.
MEMEAI在24小時內經歷了12.89%的回調,在過去一周經歷了14.92%的回調。 30 天下跌 53.63% 表示前景悲觀。

TradingView: MEMEAI/USDT
交易檢視:MEMEAI/USDT
The Relative Strength Index (RSI) has plummeted, indicating increased bearish sentiment. The average trendline crosses negatively, pointing to a potential loss of momentum.
相對強弱指數(RSI)暴跌,顯示看跌情緒加劇。平均趨勢線向下交叉,表示潛在的動能喪失。
The MACD exhibits a neutral flatline, indicating weak price action. The averages also trend neutrally, suggesting uncertainty in MEMEAI's future price movement.
MACD 呈中性平線,表示價格走勢疲軟。均線趨勢也呈現中性,顯示 MEMEAI 未來價格走勢存在不確定性。
If the market recovers, MEMEAI may test its resistance level of $0.0048. However, persistent bearishness could drive it towards its support level of $0.000586.
如果市場復甦,MEMEAI 可能會測試 0.0048 美元的阻力位。然而,持續的看跌情緒可能會將其推向 0.000586 美元的支撐位。


 Crypto Daily™
 Crypto Daily™
 DogeHome
 TheCoinrise Media
 Thecoinrepublic.com
 TheCoinrise Media
 TheCoinrise Media
 Cryptopolitan_News


