Is the Memecoin Rally Over as MEMEAI and PEPE Tokens Suggest a 30% Plunge?
MEMEAIとPEPEトークンが30%の急落を示唆しているため、Memecoinのラリーは終わったのか?
The cryptocurrency market has shed its $2 trillion valuation, currently valued at $1.98 trillion, following a 7.82% decline in the last 24 hours. The 24-hour trading volume stands at $116.88 billion. Bitcoin has reached its lowest point since February at $53,717.38.
過去24時間で7.82%下落した仮想通貨市場は、現在1兆9800億ドルと評価されている2兆ドルの評価額を切り下げた。 24時間の取引高は1168億8000万ドル。ビットコインは2月以来の安値となる5万3717.38ドルに達した。
Memecoins, once thriving, have experienced a significant correction, with leading tokens losing over 15% each. Amidst the prevailing bearish sentiment, it remains unclear whether memecoins will rebound this month.
ミームコインはかつて繁栄していましたが、主要なトークンがそれぞれ15%以上下落するなど、大幅な調整を経験しました。弱気ムードが広がる中、ミームコインが今月反発するかどうかは依然として不透明だ。
Pepe (PEPE) Price Analysis:
ペペ (PEPE) 価格分析:
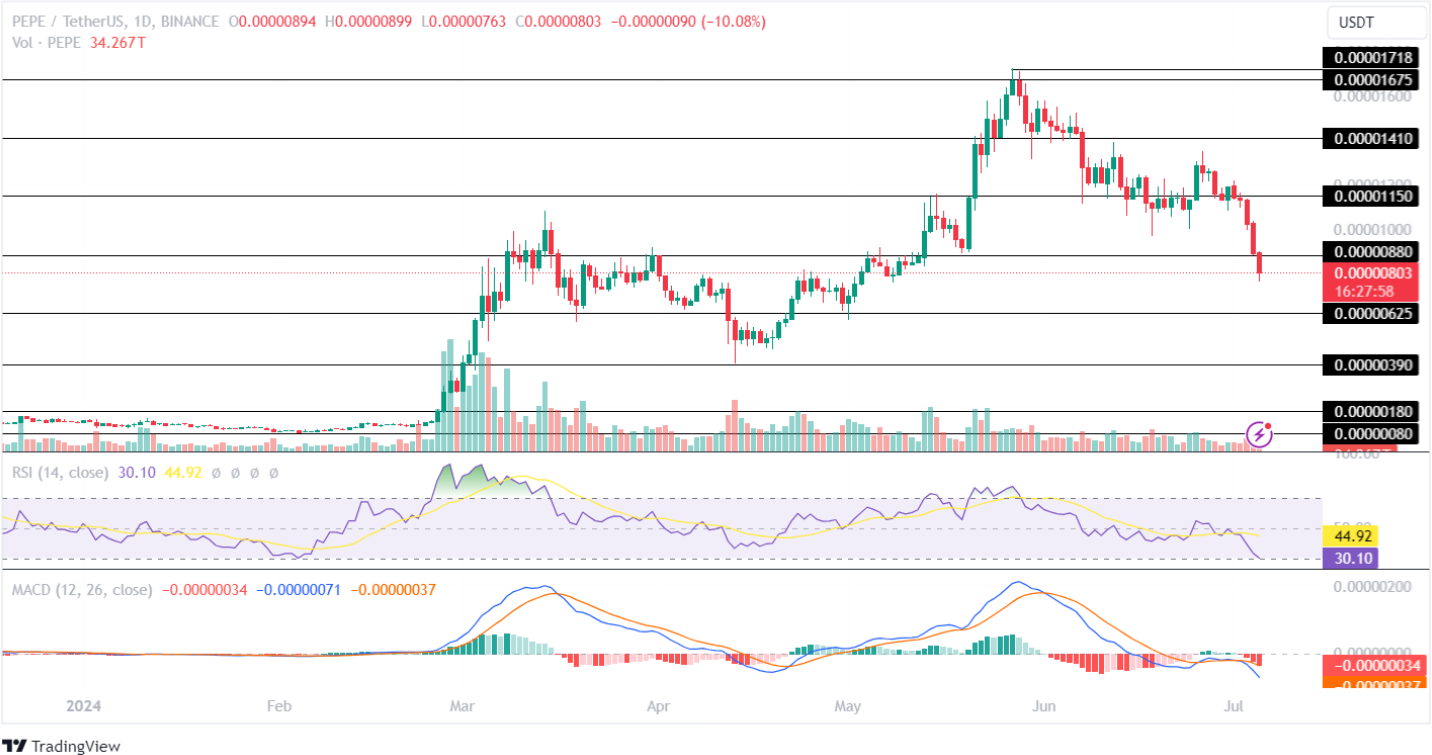
The Pepe token has depreciated 16.84% in the last 24 hours and 36.02% over the past week. A month-long plunge of 46.74% indicates growing bearishness.
Pepeトークンは過去24時間で16.84%、過去1週間で36.02%下落しました。 1カ月連続の46.74%下落は弱気の高まりを示している。

TradingView: PEPE/USDT
TradingView: PEPE/USDT
The Moving Average Convergence Divergence (MACD) displays a sharp rise in the red histogram, signaling intensified selling pressure. The averages trend negatively, suggesting ongoing momentum loss.
移動平均収束ダイバージェンス (MACD) は、赤いヒストグラムの急激な上昇を示し、売り圧力の強化を示しています。平均はマイナスの傾向にあり、継続的な勢いの低下を示唆しています。
The RSI indicator has fallen below its midpoint in the 1D time frame, indicating elevated selling activity.
RSI指標は1D時間枠の中間点を下回っており、売り活動の高まりを示しています。
If bulls regain control, Pepe will attempt to test its resistance level of $0.00001150. Conversely, continued bearish dominance may push Pepe toward its support level of $0.00000625.
強気派が主導権を取り戻した場合、ペペ氏はその抵抗レベルである0.00001150ドルをテストしようとするだろう。逆に、引き続き弱気の優位性があれば、Pepe はサポートレベルである 0.00000625 ドルに向かって押し上げられる可能性があります。
Meme Ai (MEMEAI) Price Analysis:
メメアイ (MEMEAI) 価格分析:
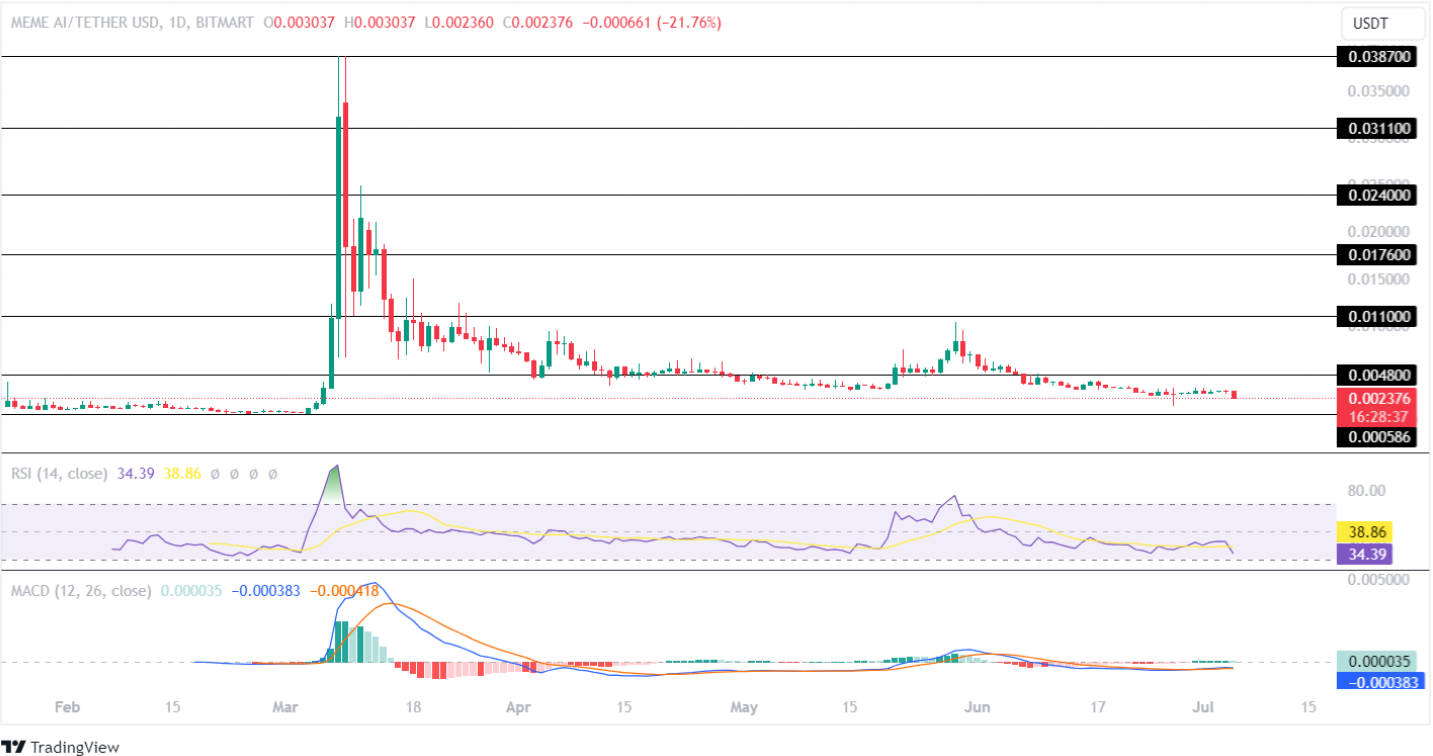
MEMEAI has experienced a 12.89% correction within 24 hours and 14.92% over the past week. A 30-day decline of 53.63% suggests a pessimistic outlook.
MEMEAIは24時間以内に12.89%、過去1週間で14.92%の調整を経験しました。 30日間の53.63%下落は悲観的な見通しを示唆している。

TradingView: MEMEAI/USDT
TradingView: MEMEAI/USDT
The Relative Strength Index (RSI) has plummeted, indicating increased bearish sentiment. The average trendline crosses negatively, pointing to a potential loss of momentum.
相対力指数(RSI)は急落し、弱気心理の高まりを示している。平均トレンドラインがマイナスに交差し、勢いが失われる可能性があることを示しています。
The MACD exhibits a neutral flatline, indicating weak price action. The averages also trend neutrally, suggesting uncertainty in MEMEAI's future price movement.
MACD は中立的なフラットラインを示し、弱い値動きを示しています。平均値も中立的な傾向にあり、MEMEAI の将来の価格変動の不確実性を示唆しています。
If the market recovers, MEMEAI may test its resistance level of $0.0048. However, persistent bearishness could drive it towards its support level of $0.000586.
市場が回復した場合、MEMEAIは0.0048ドルの抵抗レベルをテストする可能性があります。ただし、持続的な弱気相場により、サポートレベルの0.000586ドルに向かって上昇する可能性があります。


 DogeHome
 TheCoinrise Media
 Thecoinrepublic.com
 TheCoinrise Media
 TheCoinrise Media
 Cryptopolitan_News
 Coin Edition
 BlockchainReporter


