Pepe Price Faces Resistance Within the Falling Wedge
Pepe Price는 하락 쐐기 내에서 저항에 직면합니다.
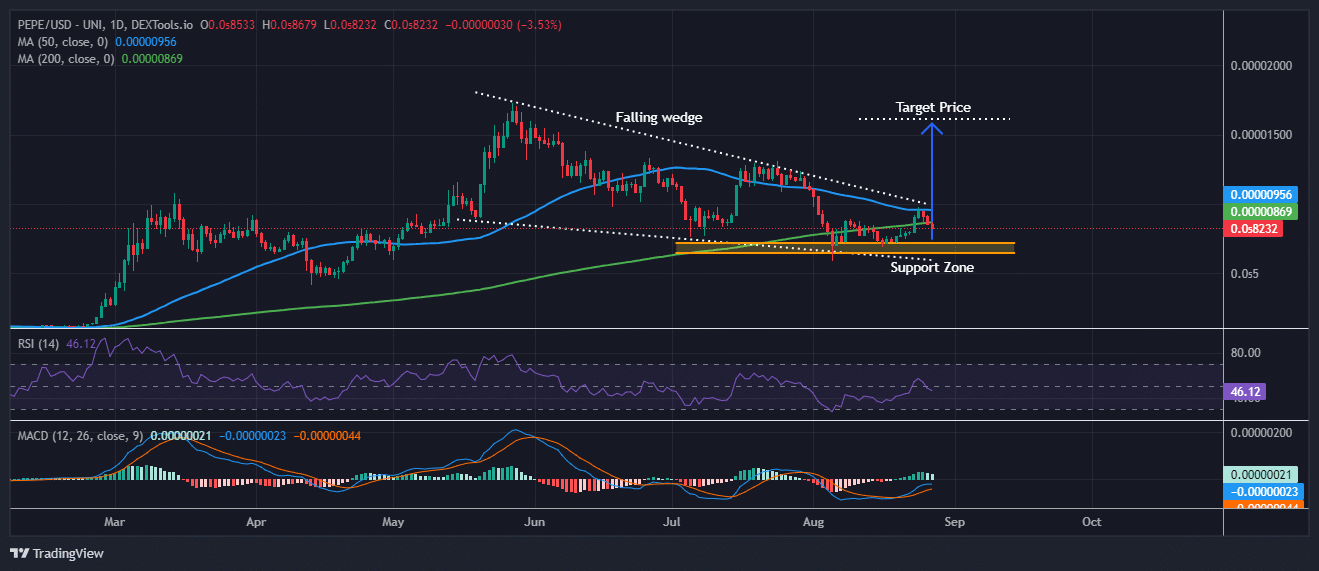
The PEPE/USD trading pair on a daily time frame indicates a potential bullish reversal. A Falling Wedge pattern is evident, typically a bullish signal when appearing in a downtrend.
일일 시간대의 PEPE/USD 거래 쌍은 잠재적인 강세 반전을 나타냅니다. Falling Wedge 패턴은 분명하며 일반적으로 하락세에 나타날 때 강세 신호입니다.
This pattern shows a consolidation with lower highs and lower lows, indicating a weakening of the selling pressure. A breakout from this wedge could lead to a significant upward move, aligning with the suggested target price.
이 패턴은 고점과 저점이 낮아지는 횡보를 보여 매도 압력이 약화됨을 나타냅니다. 이 쐐기형이 돌파되면 제안된 목표 가격에 맞춰 상당한 상승 움직임이 나타날 수 있습니다.

PEPE/USD Analysis
PEPE/USD 분석
Source: Dextools.io
출처: Dextools.io
Pepe price currently resides within a strong support zone, highlighted in yellow, which has historically attracted buying interest.
Pepe 가격은 현재 노란색으로 강조된 강력한 지지 구역 내에 위치하며, 이는 역사적으로 매수 관심을 불러일으켰습니다.
The recent bounce off this support level further suggests that the downtrend may be losing steam. Additionally, the price is near the 50-day simple moving average (MA), which could act as a key resistance or support level depending on the next movement.
최근 이 지지 수준에서 반등한 것은 하락 추세가 힘을 잃고 있음을 더욱 시사합니다. 또한 가격은 50일 단순 이동 평균(MA) 근처에 있으며, 이는 다음 움직임에 따라 주요 저항 또는 지지 수준으로 작용할 수 있습니다.
The 200-day MA, slightly below the current price, suggests that the long-term trend could still be positive.
현재 가격보다 약간 낮은 200일 MA는 장기적인 추세가 여전히 긍정적일 수 있음을 시사합니다.
The Relative Strength Index (RSI) is at 46.07, slightly below the neutral 50 level. This indicates that the market isn't overbought or oversold, providing room for potential upside if buying pressure increases.
상대강도지수(RSI)는 46.07로 중립 수준인 50보다 약간 낮습니다. 이는 시장이 과매수 또는 과매도 상태가 아니라는 것을 의미하며, 매수 압력이 증가할 경우 잠재적인 상승 여력을 제공합니다.
The Moving Average Convergence Divergence (MACD) indicator shows a recent bearish crossover, with the MACD line below the signal line. However, the shrinking histogram bars suggest that bearish momentum might be waning.
MACD(Moving Average Convergence Divergence) 지표는 MACD 선이 신호 선 아래에 있는 최근 약세 교차를 보여줍니다. 그러나 히스토그램 막대가 줄어들면 약세 모멘텀이 약해지고 있음을 시사합니다.
Pepe Price Poised for a Bull Rally
강세장을 준비하는 페페 프라이스
If a breakout occurs, the price could rise toward the target level of $0.00001734. This target aligns with previous highs, suggesting a potential price increase of around 30-50% from the current level, depending on the strength of the breakout.
돌파가 발생하면 가격은 목표 수준 $0.00001734까지 상승할 수 있습니다. 이 목표는 이전 최고치와 일치하며, 돌파 강도에 따라 현재 수준에서 약 30~50%의 가격 상승 가능성이 있음을 시사합니다.
However, waiting for confirmation of the breakout above the falling wedge is essential before making any trading decisions, as failure to break the wedge could lead to continued consolidation or even further downside.
그러나 거래 결정을 내리기 전에 떨어지는 쐐기 위의 돌파 확인을 기다리는 것이 필수적입니다. 쐐기를 깨뜨리지 못하면 지속적인 통합 또는 추가 하락으로 이어질 수 있기 때문입니다.
Related Articles:
관련 기사:
- Is It Too Late to Buy BAR? Gold Standard Price Soars 60% and This Might Be the Next Crypto to Explode
- Upcoming Crypto Presales: Unlock Early Investment Opportunities!
- Ethereum Price Prediction as ETH Celebrates 9th Birthday and This Ethereum Layer 2 Meme Coin Explodes
BAR을 구매하기에는 너무 늦었나요? 금 표준 가격이 60% 급등하고 이것이 폭발할 다음 암호화폐가 될 수 있습니다다가오는 암호화폐 사전 판매: 조기 투자 기회를 잠금 해제하세요!ETH가 9번째 생일을 축하하고 이 이더리움 레이어 2 밈 코인이 폭발함에 따라 이더리움 가격 예측


 Coincu
 Optimisus
 Crypto Intelligence
 DogeHome
 Coincu
 Times Tabloid
 CFN
CFN Crypto News Land
 Optimisus


