Pepe Price Faces Resistance Within the Falling Wedge
ペペ・プライス、立ち下がりウェッジの中で抵抗に直面
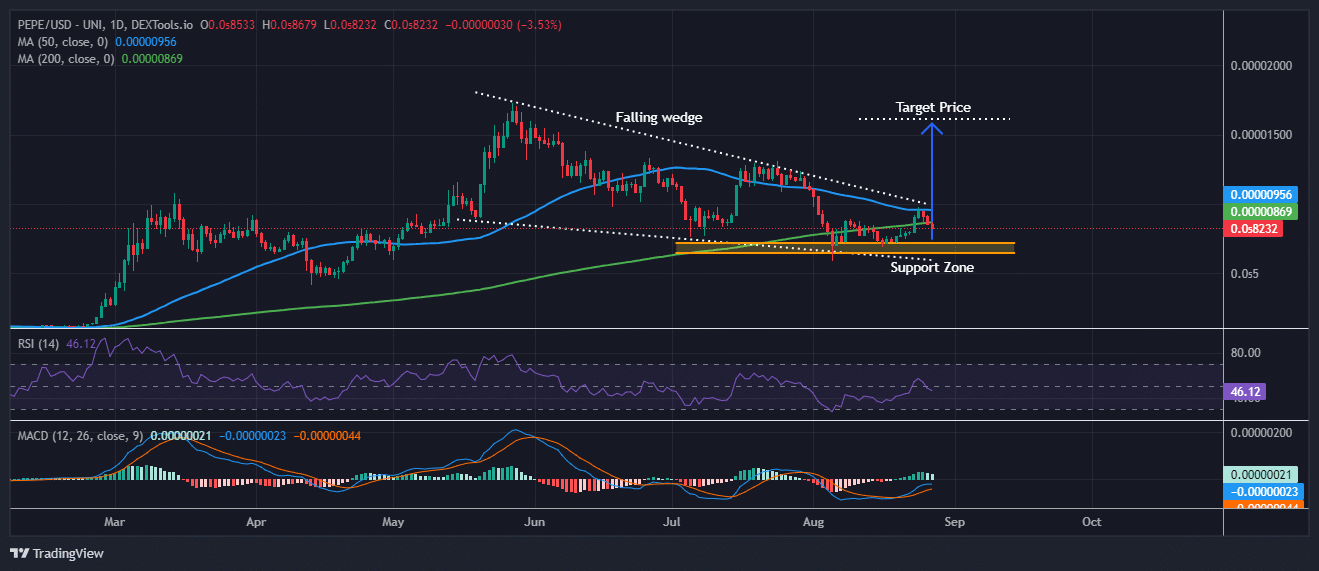
The PEPE/USD trading pair on a daily time frame indicates a potential bullish reversal. A Falling Wedge pattern is evident, typically a bullish signal when appearing in a downtrend.
日足のPEPE/USD取引ペアは、強気反転の可能性を示しています。立ち下がりウェッジのパターンは明らかであり、通常、下降トレンドに現れた場合は強気のシグナルとなります。
This pattern shows a consolidation with lower highs and lower lows, indicating a weakening of the selling pressure. A breakout from this wedge could lead to a significant upward move, aligning with the suggested target price.
このパターンは高値を切り下げ、安値を切り下げる保ち合いを示しており、売り圧力の弱まりを示しています。このウェッジをブレイクアウトすると、提案された目標価格と一致して、大幅な上昇につながる可能性があります。

PEPE/USD Analysis
PEPE/USD分析
Source: Dextools.io
出典: Dextools.io
Pepe price currently resides within a strong support zone, highlighted in yellow, which has historically attracted buying interest.
ペペ価格は現在、黄色で強調表示されている強力なサポートゾーン内に位置しており、これまで歴史的に買いの関心を集めてきました。
The recent bounce off this support level further suggests that the downtrend may be losing steam. Additionally, the price is near the 50-day simple moving average (MA), which could act as a key resistance or support level depending on the next movement.
このサポートレベルから最近反発したことは、下降トレンドが勢いを失いつつある可能性をさらに示唆しています。さらに、価格は50日単純移動平均(MA)に近く、次の動きによっては重要な抵抗線または支持線として機能する可能性があります。
The 200-day MA, slightly below the current price, suggests that the long-term trend could still be positive.
現在の価格をわずかに下回る 200 日移動平均線は、長期トレンドが依然としてプラスである可能性を示唆しています。
The Relative Strength Index (RSI) is at 46.07, slightly below the neutral 50 level. This indicates that the market isn't overbought or oversold, providing room for potential upside if buying pressure increases.
相対力指数(RSI)は46.07で、中立的な50レベルをわずかに下回っています。これは、市場が買われすぎでも売られすぎでもないことを示しており、買い圧力が高まった場合には上値余地が残されています。
The Moving Average Convergence Divergence (MACD) indicator shows a recent bearish crossover, with the MACD line below the signal line. However, the shrinking histogram bars suggest that bearish momentum might be waning.
移動平均収束ダイバージェンス (MACD) インジケーターは、MACD ラインがシグナルラインの下にあり、最近の弱気クロスオーバーを示しています。ただし、ヒストグラムのバーが縮小していることは、弱気の勢いが弱まりつつあることを示唆しています。
Pepe Price Poised for a Bull Rally
ペペ・プライス、強気相場の準備を整える
If a breakout occurs, the price could rise toward the target level of $0.00001734. This target aligns with previous highs, suggesting a potential price increase of around 30-50% from the current level, depending on the strength of the breakout.
ブレイクアウトが発生した場合、価格は目標レベルの0.00001734ドルに向かって上昇する可能性があります。この目標は過去の高値と一致しており、ブレイクアウトの強さに応じて、価格が現在のレベルから約30〜50%上昇する可能性があることを示唆しています。
However, waiting for confirmation of the breakout above the falling wedge is essential before making any trading decisions, as failure to break the wedge could lead to continued consolidation or even further downside.
ただし、ウェッジをブレイクできなかった場合、値動きが継続したり、さらなる下値につながる可能性があるため、トレードの決定を下す前に、下落するウェッジを上抜けたことが確認されるまで待つことが不可欠です。
Related Articles:
関連記事:
- Is It Too Late to Buy BAR? Gold Standard Price Soars 60% and This Might Be the Next Crypto to Explode
- Upcoming Crypto Presales: Unlock Early Investment Opportunities!
- Ethereum Price Prediction as ETH Celebrates 9th Birthday and This Ethereum Layer 2 Meme Coin Explodes
BARを買うには遅すぎますか?金本位制の価格が60%急騰し、これが次に爆発する仮想通貨になるかもしれない今後の仮想通貨プレセール: 早期投資のチャンスを解き放つ!ETHが9周年を祝い、このイーサリアムレイヤー2ミームコインが爆発する中、イーサリアム価格予測


 Crypto Daily™
 CryptoPotato_News
 DogeHome
 Crypto Daily™
 ETHNews
 Coin Edition
 Crypto Daily™
 BlockchainReporter


