Pepe Price Faces Resistance Within the Falling Wedge
佩佩·普萊斯 (Pepe Price) 在下降楔形內面臨阻力
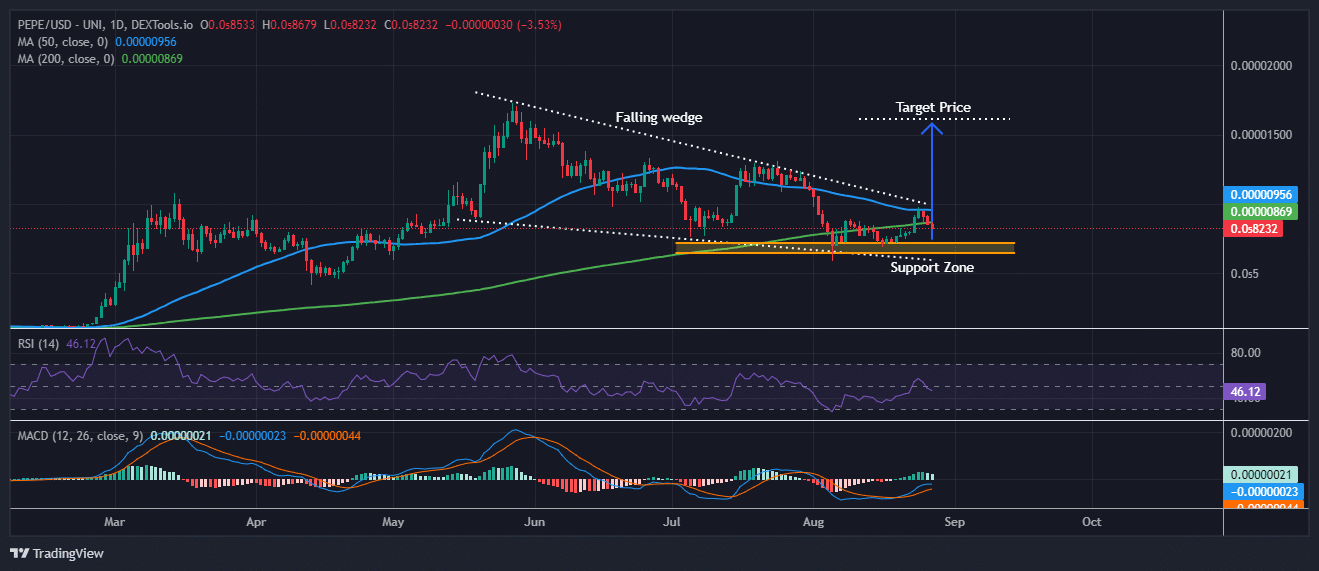
The PEPE/USD trading pair on a daily time frame indicates a potential bullish reversal. A Falling Wedge pattern is evident, typically a bullish signal when appearing in a downtrend.
每日時間框架內的 PEPE/USD 交易對錶示潛在的看漲逆轉。下降楔形形態很明顯,通常是出現在下降趨勢時的看漲訊號。
This pattern shows a consolidation with lower highs and lower lows, indicating a weakening of the selling pressure. A breakout from this wedge could lead to a significant upward move, aligning with the suggested target price.
此形態顯示高點和低點較低的盤整,顯示拋售壓力減弱。突破該楔形可能會導致大幅上漲,與建議的目標價格一致。

PEPE/USD Analysis
PEPE/美元分析
Source: Dextools.io
來源:Dextools.io
Pepe price currently resides within a strong support zone, highlighted in yellow, which has historically attracted buying interest.
佩佩價格目前位於強勁的支撐區域(以黃色突出顯示),該區域歷來吸引了購買興趣。
The recent bounce off this support level further suggests that the downtrend may be losing steam. Additionally, the price is near the 50-day simple moving average (MA), which could act as a key resistance or support level depending on the next movement.
最近從該支撐位的反彈進一步表明下降趨勢可能正在失去動力。此外,價格接近 50 日簡單移動平均線 (MA),根據下一步走勢,該平均線可能成為關鍵阻力位或支撐位。
The 200-day MA, slightly below the current price, suggests that the long-term trend could still be positive.
200 日均線略低於當前價格,顯示長期趨勢仍可能積極。
The Relative Strength Index (RSI) is at 46.07, slightly below the neutral 50 level. This indicates that the market isn't overbought or oversold, providing room for potential upside if buying pressure increases.
相對強弱指數 (RSI) 為 46.07,略低於中性 50 水準。這表明市場並未超買或超賣,如果購買壓力增加,則提供潛在上漲空間。
The Moving Average Convergence Divergence (MACD) indicator shows a recent bearish crossover, with the MACD line below the signal line. However, the shrinking histogram bars suggest that bearish momentum might be waning.
移動平均收斂分歧(MACD)指標顯示近期看跌交叉,MACD 線位於訊號線下方。然而,不斷縮小的直方圖顯示看跌勢頭可能正在減弱。
Pepe Price Poised for a Bull Rally
佩佩·普萊斯 (Pepe Price) 為牛市反彈做好準備
If a breakout occurs, the price could rise toward the target level of $0.00001734. This target aligns with previous highs, suggesting a potential price increase of around 30-50% from the current level, depending on the strength of the breakout.
如果發生突破,價格可能會上漲至 0.00001734 美元的目標水準。該目標與先前的高點一致,表明價格可能會較當前水準上漲 30-50% 左右,具體取決於突破的強度。
However, waiting for confirmation of the breakout above the falling wedge is essential before making any trading decisions, as failure to break the wedge could lead to continued consolidation or even further downside.
然而,在做出任何交易決定之前,等待確認突破下降楔形是至關重要的,因為未能突破該楔形可能會導致持續盤整甚至進一步下跌。
Related Articles:
相關文章:
- Is It Too Late to Buy BAR? Gold Standard Price Soars 60% and This Might Be the Next Crypto to Explode
- Upcoming Crypto Presales: Unlock Early Investment Opportunities!
- Ethereum Price Prediction as ETH Celebrates 9th Birthday and This Ethereum Layer 2 Meme Coin Explodes
現在購買 BAR 太晚了嗎?金本位價格飆升 60%,這可能是下一個爆炸的加密貨幣即將到來的加密貨幣預售:解鎖早期投資機會!


 Coincu
 Optimisus
 Crypto Intelligence
 DogeHome
 Coincu
 Times Tabloid
 CFN
CFN Crypto News Land
 Optimisus


