In the cryptocurrency market, technical analysis emerges as an indicator that investors, especially those in the futures market, must continuously monitor. So, what clues does the technical analysis provide for Dogecoin, which was trading at $0.09408 at the time the article was written? We examine it in detail, along with the important support and resistance levels.
На рынке криптовалют технический анализ выступает в качестве индикатора, за которым инвесторы, особенно на фьючерсном рынке, должны постоянно следить. Итак, какие подсказки дает технический анализ Dogecoin, который на момент написания статьи торговался на уровне $0,09408? Мы рассмотрим его подробно, а также важные уровни поддержки и сопротивления.
Dogecoin Chart Analysis
Анализ графика Dogecoin
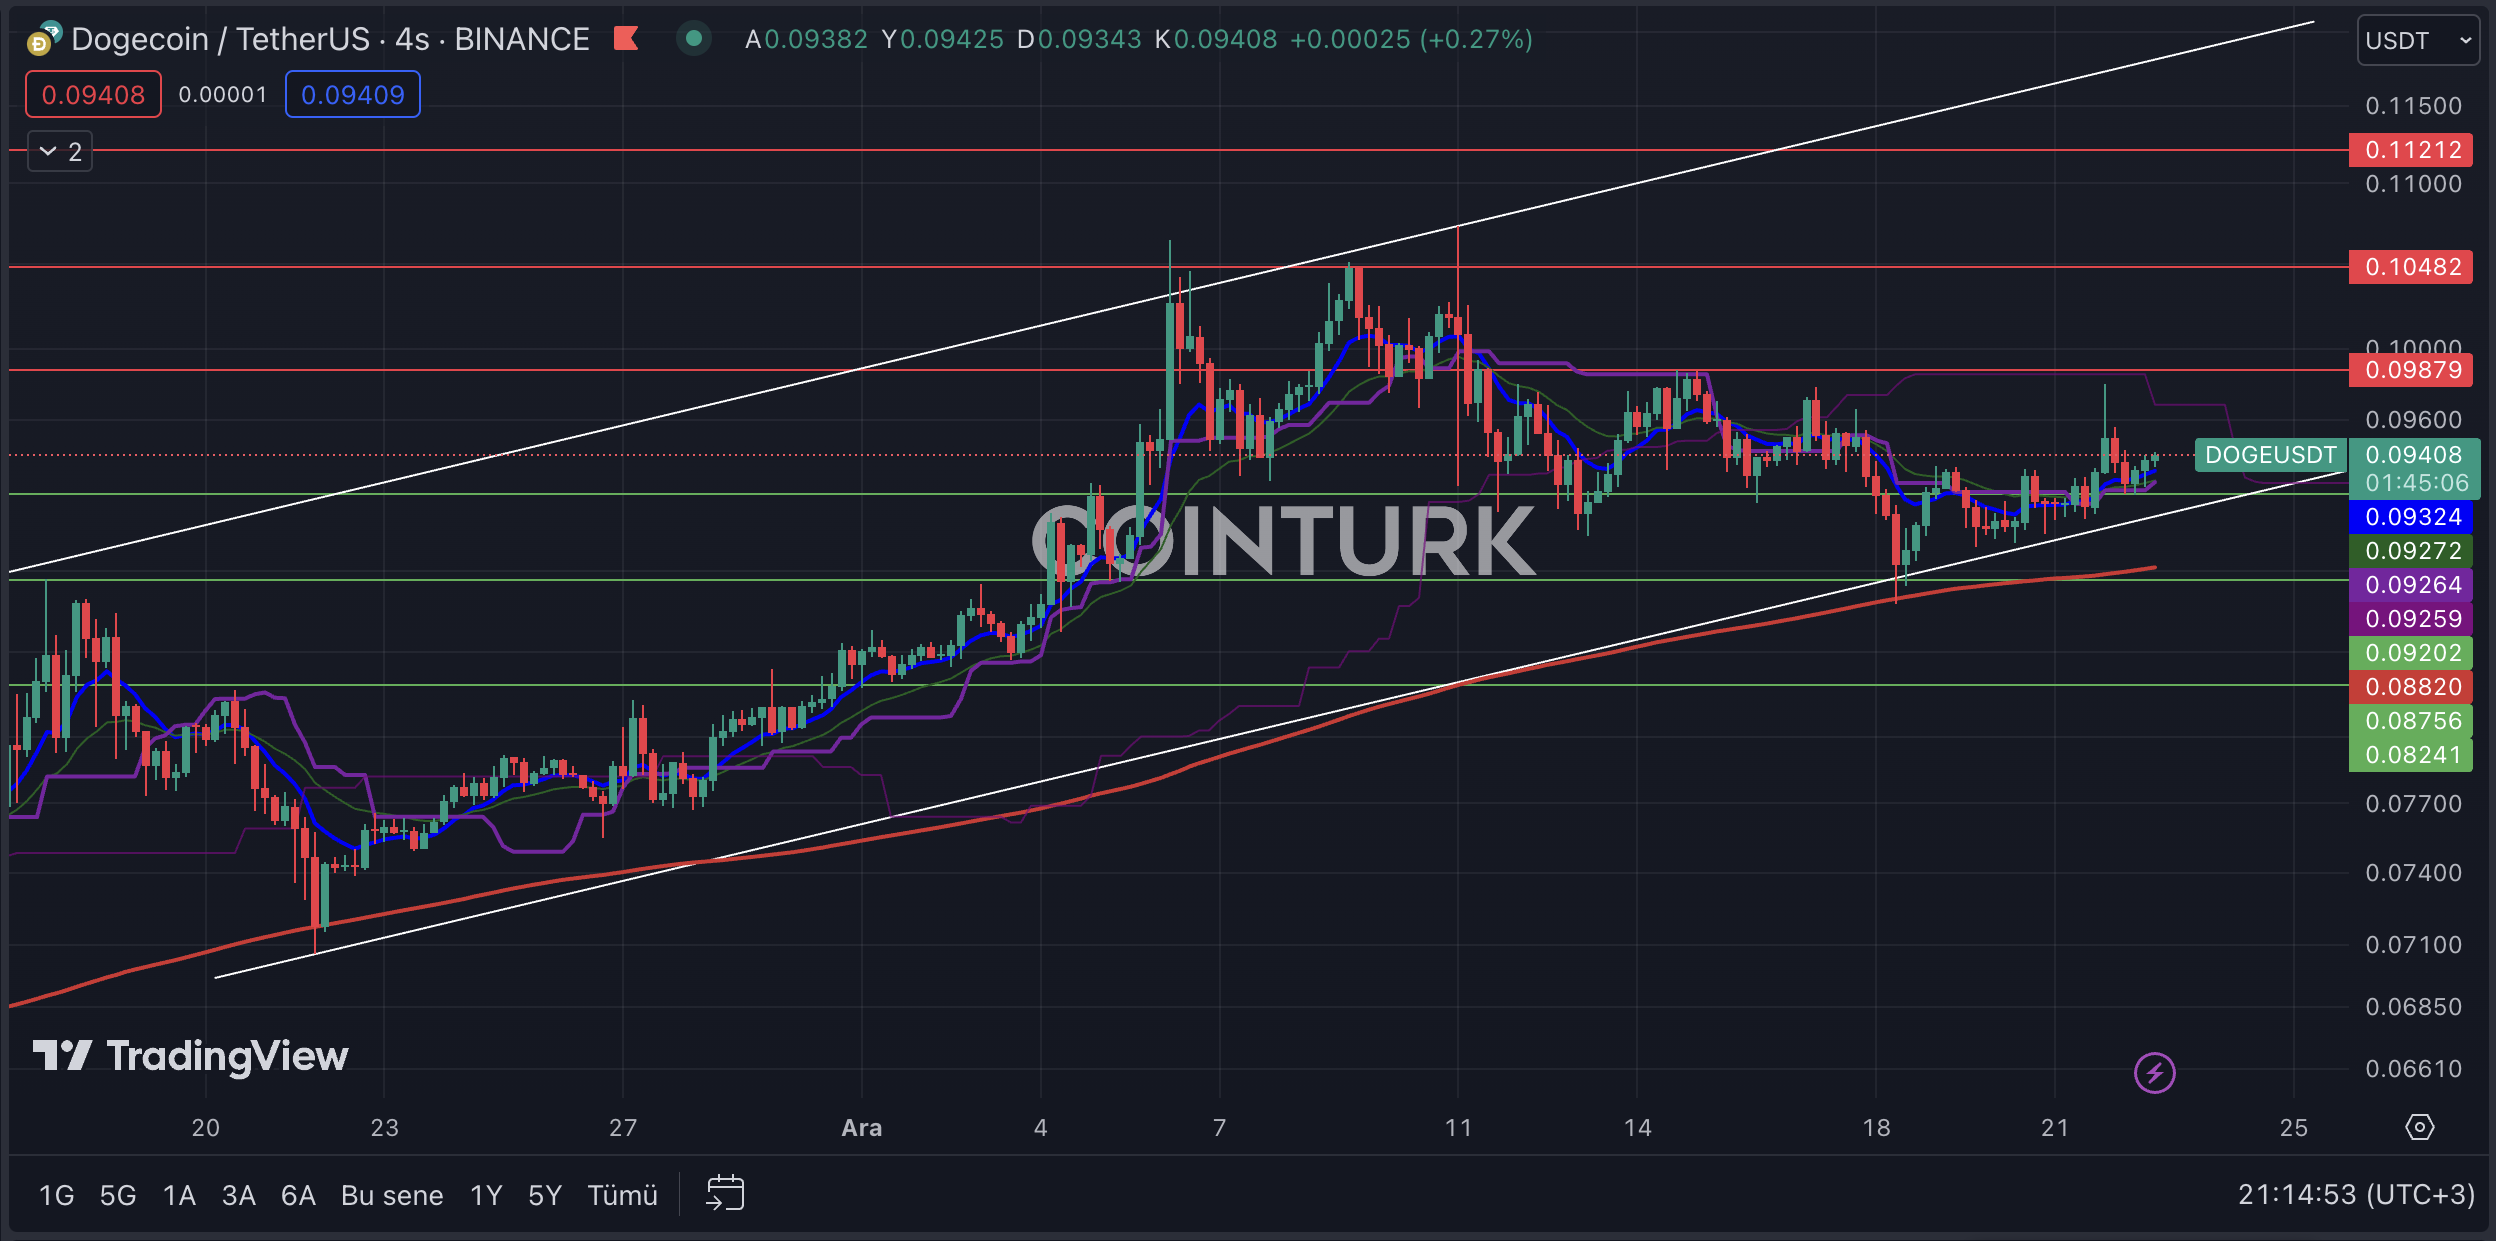
The four-hour Dogecoin chart highlights a rising channel formation. The absence of a support or resistance breakout in the formation structure provides an important clue, especially for futures traders. The intersection of the support line with the EMA 200 (red line) suggests a positive scenario for the price of Dogecoin.
Четырехчасовой график Dogecoin демонстрирует формирование восходящего канала. Отсутствие прорыва поддержки или сопротивления в структуре формации дает важную подсказку, особенно для фьючерсных трейдеров. Пересечение линии поддержки с EMA 200 (красная линия) предполагает позитивный сценарий для цены Dogecoin.
The most important support levels to watch on the Dogecoin chart are; $0.09202, $0.08756, and $0.08241, respectively. Particularly, a four-hour bar closing below the $0.08756 level, which intersects both the formation support line and the EMA 200 level, will cause significant selling pressure on the Dogecoin price.
Наиболее важные уровни поддержки, за которыми следует следить на графике Dogecoin: 0,09202 доллара США, 0,08756 доллара США и 0,08241 доллара США соответственно. В частности, закрытие четырехчасового бара ниже уровня $0,08756, который пересекает как линию поддержки формирования, так и уровень EMA 200, вызовет значительное давление продаж на цену Dogecoin.
The most important resistance levels to watch on the Dogecoin chart are; $0.09879, $0.10482, and $0.11212, respectively. Especially, a four-hour bar closing above the $0.09879 level, which has been a significant barrier since December 11, will accelerate the momentum of the Dogecoin price.
Наиболее важными уровнями сопротивления на графике Dogecoin являются: 0,09879, 0,10482 и 0,11212 долларов соответственно. В частности, закрытие четырехчасового бара выше уровня $0,09879, который был серьезным барьером с 11 декабря, ускорит динамику цены Dogecoin.

Dogecoin Weekly Chart Analysis
Анализ недельного графика Dogecoin
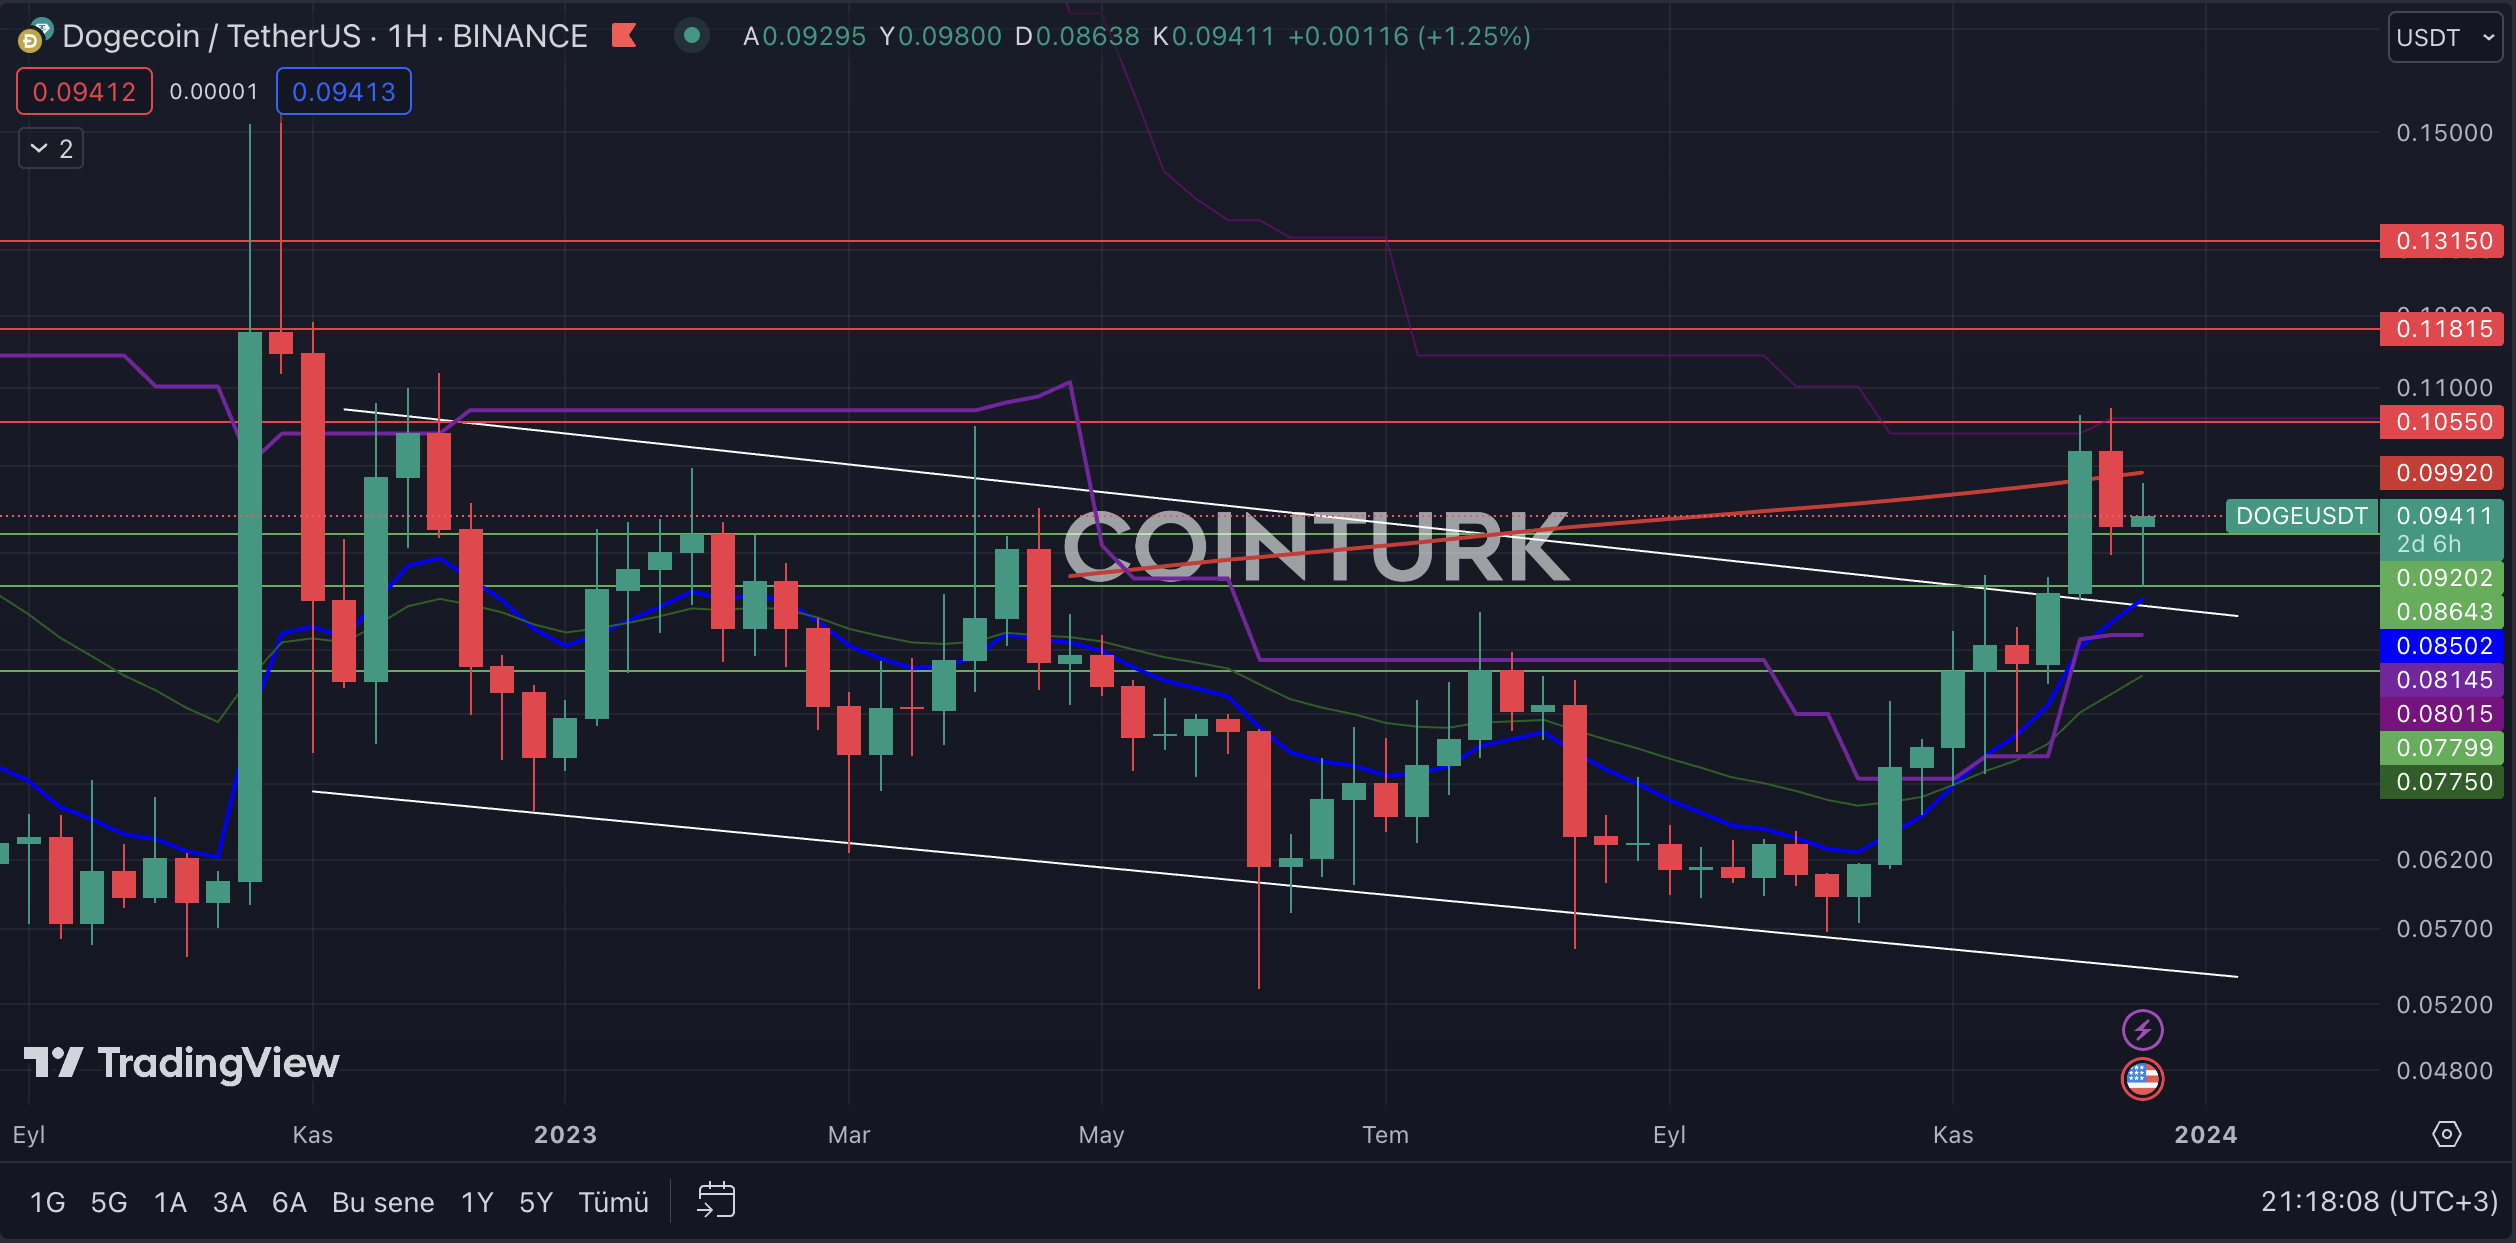
The first notable formation structure in the Dogecoin weekly chart analysis is a descending channel formation. This formation structure successfully completed a resistance breakout in recent weeks, and since then, the Dogecoin price has continued to gain strength. Particularly, the resistance line acting as support reflects a positive process for Dogecoin.
Первой заметной структурой формирования в анализе недельного графика Dogecoin является формирование нисходящего канала. Эта структура формирования успешно завершила прорыв сопротивления в последние недели, и с тех пор цена Dogecoin продолжает набирать силу. В частности, линия сопротивления, выступающая в качестве поддержки, отражает позитивный процесс для Dogecoin.
The most important support levels to watch on the Dogecoin weekly chart are; $0.09202, $0.08643, and $0.07799, respectively. Especially, a weekly bar closing below the $0.08643 level, which intersects with the resistance line, could lead to selling pressure on the Dogecoin price.
Наиболее важные уровни поддержки, за которыми следует следить на недельном графике Dogecoin: 0,09202, 0,08643 и 0,07799 долларов соответственно. В частности, закрытие недельного бара ниже уровня $0,08643, который пересекается с линией сопротивления, может привести к давлению продаж на цену Dogecoin.
The most important resistance levels to watch on the Dogecoin weekly chart are; $0.10550, $0.11815, and $0.13150, respectively. Especially, a weekly bar closing above the $0.10550 level, which has been a significant barrier for the last two weeks, will accelerate the momentum of the Dogecoin price.
Наиболее важные уровни сопротивления, за которыми следует следить на недельном графике Dogecoin: 0,10550, 0,11815 и 0,13150 долларов соответственно. В частности, закрытие недельного бара выше уровня $0,10550, который был значительным барьером в течение последних двух недель, ускорит динамику цены Dogecoin.

Продолжить чтение: https://en.coin-turk.com/dogecoin-technical-anaанализ-overview/


 Thecryptoupdates
 The Bit Journal
 Times Tabloid
 CoinoMedia
 U_Today
 ETHNews
 crypto.news
 CoinPedia News
 CoinoMedia


