

Dogecoin's Long-Term Resilience: Fibonacci Levels and Channel Stability
Technical analysis using Fibonacci retracement and extension levels, alongside rising channel dynamics, helps illuminate Dogecoin's potential future price trajectory. Past accumulation zones within these channels provide valuable insights.
Long-term channel dynamics reveal consistent support for Dogecoin since 2015, with historical price behavior offering a guide to current market stability. The current price near $0.1717 suggests Dogecoin is testing mid-channel support, potentially setting the stage for a move towards higher Fibonacci targets.
On March 12, 2025, experts analyzed Dogecoin's long-term price performance using logarithmic charts and technical analysis, focusing on support levels, Fibonacci tools, and channel dynamics.
Long-Term Channel Dynamics
A recent tweet by crypto analyst Ali Martinez on X highlighted Dogecoin holding a key support level within its long-term channel, reflecting established technical trends and channel behavior. This aligns with broader analysis of historical price movements.
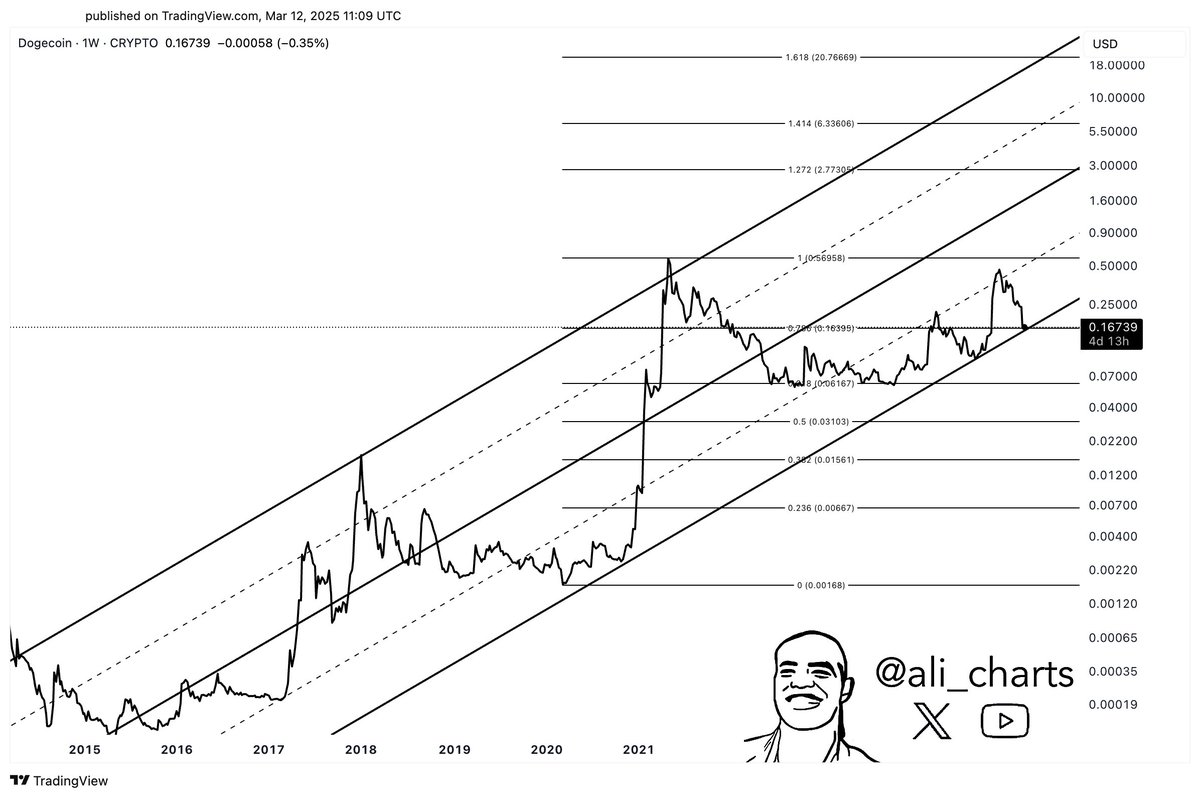
Source: Ali Charts
Dogecoin has maintained a rising channel since 2015. Its lower boundary has consistently acted as reliable support, reinforcing price stability, while the upper boundary has historically coincided with peak market rallies. Analysts observe that historical bull and bear cycles within this channel have shown strong rallies followed by moderate corrections.
Fibonacci Analysis and Support Levels
Significant accumulation zones are marked by Fibonacci retracement levels (0.236, 0.382, and 0.5), historically defining support and resistance. Charts show these levels were active before previous price surges. Furthermore, higher Fibonacci extension levels (1.272, 1.414, and 1.618) suggest potential upward targets if momentum resumes.
The 1.0 Fibonacci level, representing Dogecoin's previous all-time high near $1.05, is considered a critical resistance area. The structure provided by Fibonacci tools helps understand market reactions to historical support and resistance zones.
Market Update and Future Outlook
At press time, Dogecoin trades near $0.1717, close to a key mid-channel support level. Price stability here could lead to a retest of higher zones, potentially around $0.25. However, a break below this level might trigger a return to lower Fibonacci retracement areas between $0.03 and $0.06.
Technical analysis suggests two potential scenarios for Dogecoin's future: a gradual price recovery towards $0.50 and $1.00, or a pullback if current support fails. This analysis offers a balanced perspective consistent with Dogecoin's historical performance.
 DogeHome
 Cointelegraph
 The Coin Republic
 Optimisus
 Coin_Gabbar
 Crypto News Land
 Crypto Front News
 Crypto Daily™


