You can also read this news on COINTURK NEWS: Dogecoin Price Analysis and Market Predictions
您也可以在 COINTURK NEWS 上閱讀此新聞:狗狗幣價格分析和市場預測
Another area that has made a mark in the crypto market recently is memecoin projects. The hype on the Solana network has brought these projects to the attention of crypto investors frequently, enabling many to make significant gains. However, the most valuable memecoin project in the crypto market, Dogecoin, continues to maintain its silence. So, what do the chart analyses say for DOGE? Let’s take a look together.
最近在加密貨幣市場上引人注目的另一個領域是模因幣項目。 Solana 網路上的炒作使這些項目經常引起加密貨幣投資者的注意,使許多人獲得了可觀的收益。然而,加密市場上最有價值的迷因幣項目狗狗幣卻繼續保持沉默。那麼,圖表分析對 DOGE 有何影響呢?我們一起來看看吧。
Dogecoin Four-Hour Chart Analysis
狗狗幣四小時圖分析
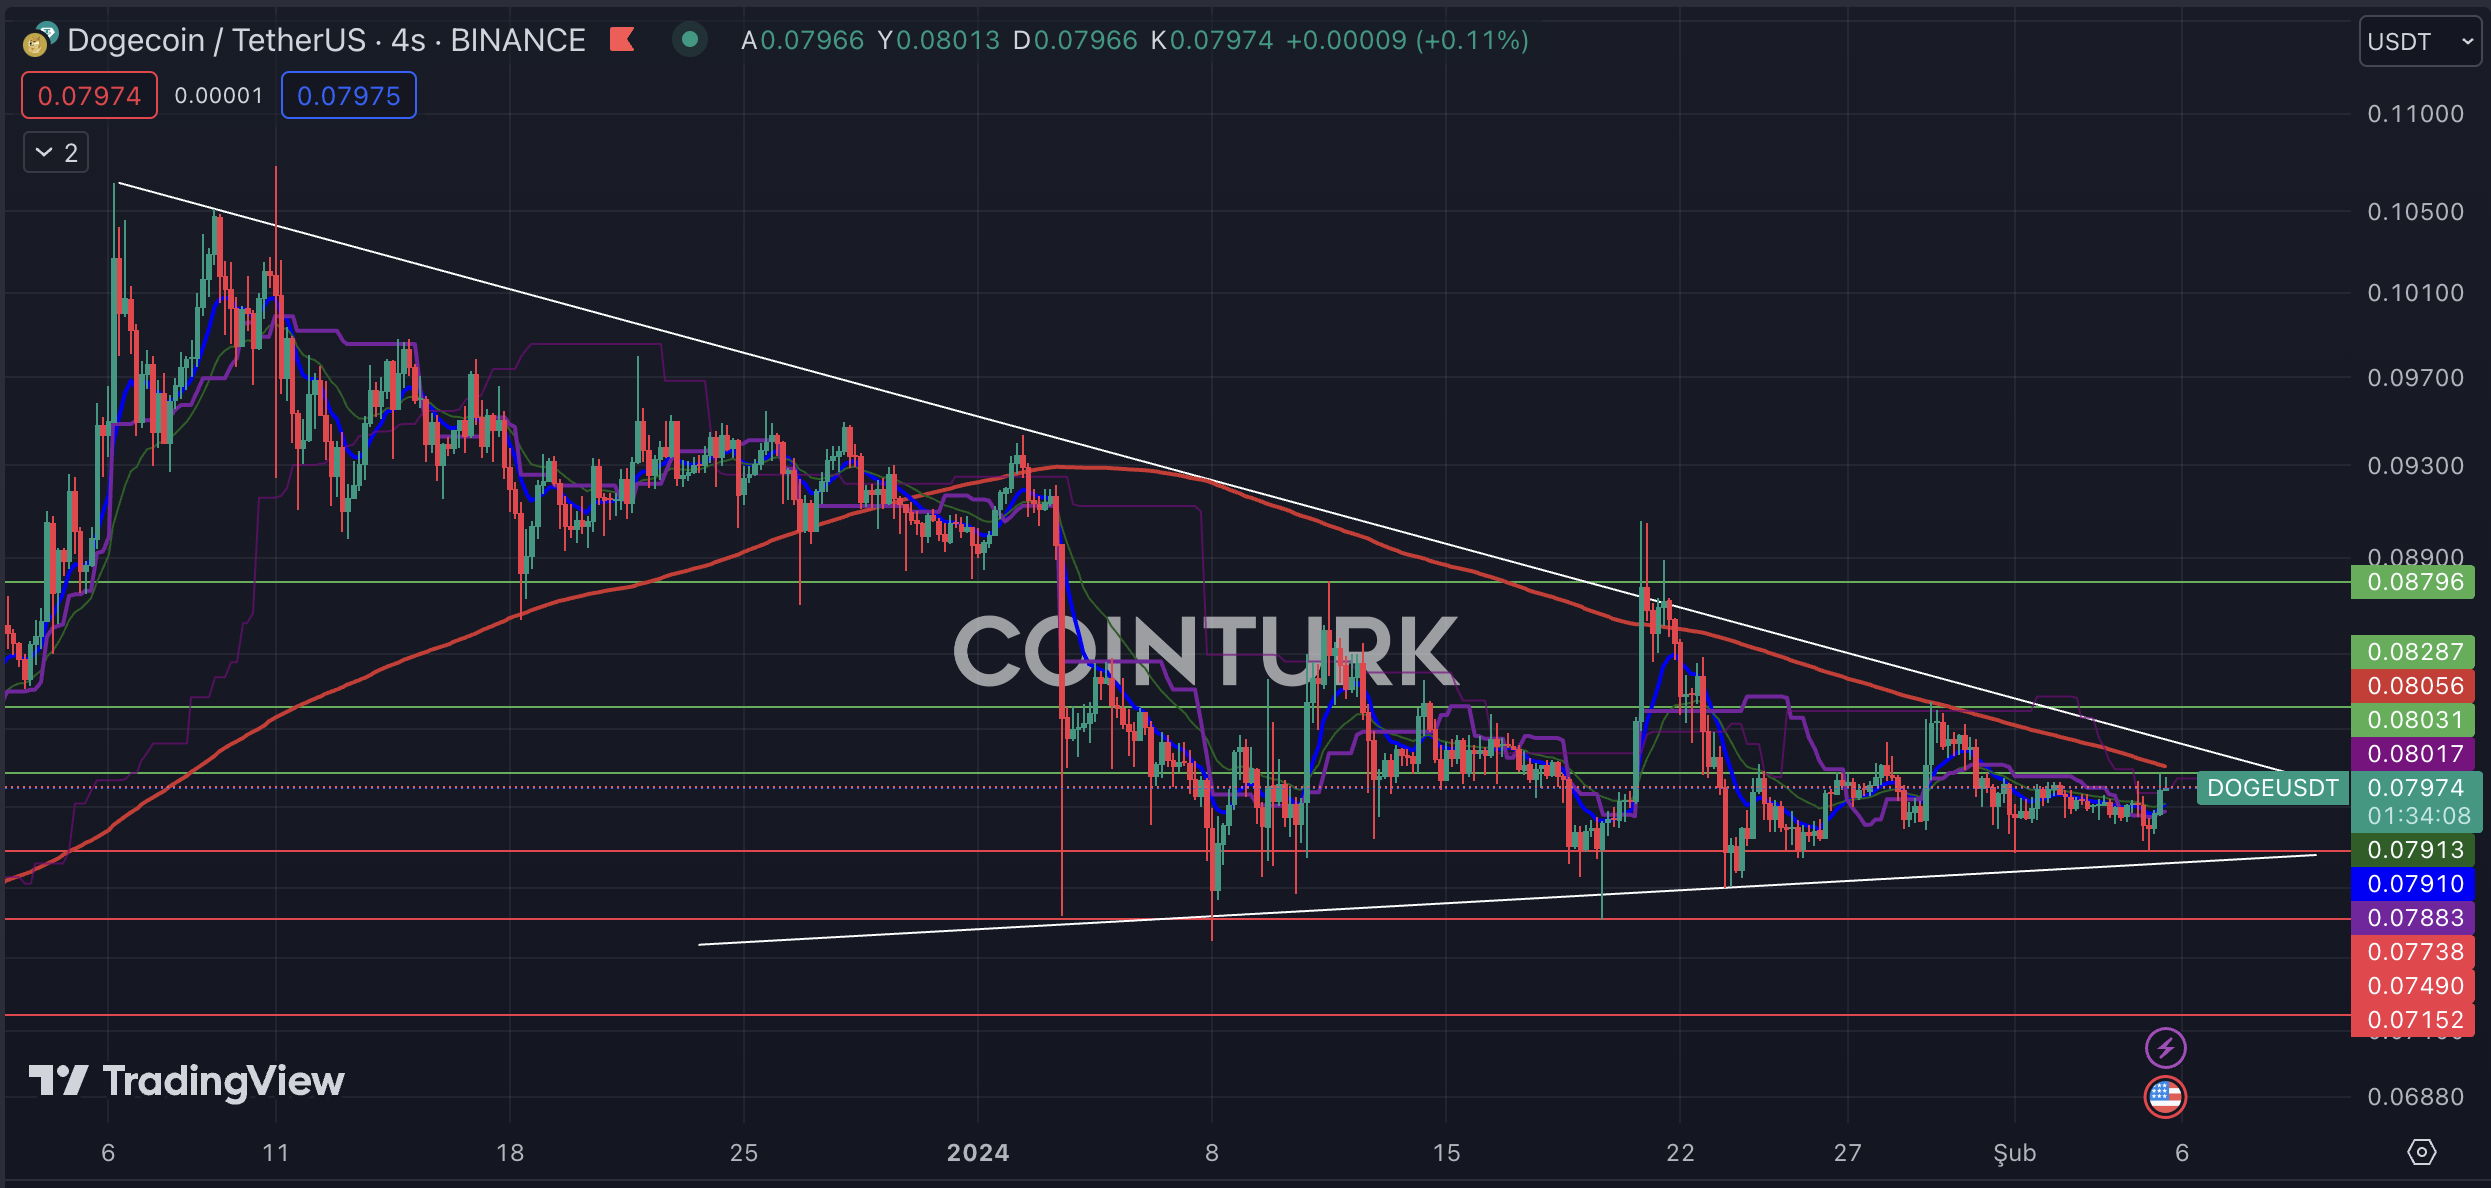
The first noticeable pattern structure in the four-hour DOGE chart is a triangle formation. The absence of a support or resistance breakout in this formation provides important clues to investors. The fact that the EMA 200 (red line) level acts as resistance in the latest bar formations is leading to a negative scenario for the DOGE price.
四小時 DOGE 圖表中第一個值得注意的模式結構是三角形結構。此形態中缺乏支撐或阻力突破為投資人提供了重要線索。 EMA 200(紅線)水平在最新的柱狀結構中充當阻力位,這一事實導致 DOGE 價格出現負面情況。
The most important support levels to watch on the DOGE chart are, in order; 0.07738 / 0.07490 and 0.07152 dollars. Particularly, a four-hour bar closure below the crucial 0.07738 dollar level will subject the DOGE price to selling pressure.
DOGE 圖表上最重要的支撐位依序為: 0.07738 / 0.07490 和 0.07152 美元。特別是,四小時柱線收盤價低於關鍵的 0.07738 美元水準將使 DOGE 價格面臨拋售壓力。
The most important resistance levels to monitor in the four-hour DOGE chart are, in order; 0.08031 / 0.08287 and 0.08796 dollars. Especially, a four-hour bar closure above the 0.08287 dollar level, which intersects with the formation resistance line, will significantly accelerate DOGE’s price and favor an upward trend.
四小時 DOGE 圖表中需要監控的最重要阻力位依序為: 0.08031 / 0.08287 和 0.08796 美元。特別是,四小時柱線收於與形成阻力線相交的 0.08287 美元水平上方,將顯著加速 DOGE 的價格並有利於上漲趨勢。

Dogecoin Weekly Chart Analysis
狗狗幣每週圖表分析
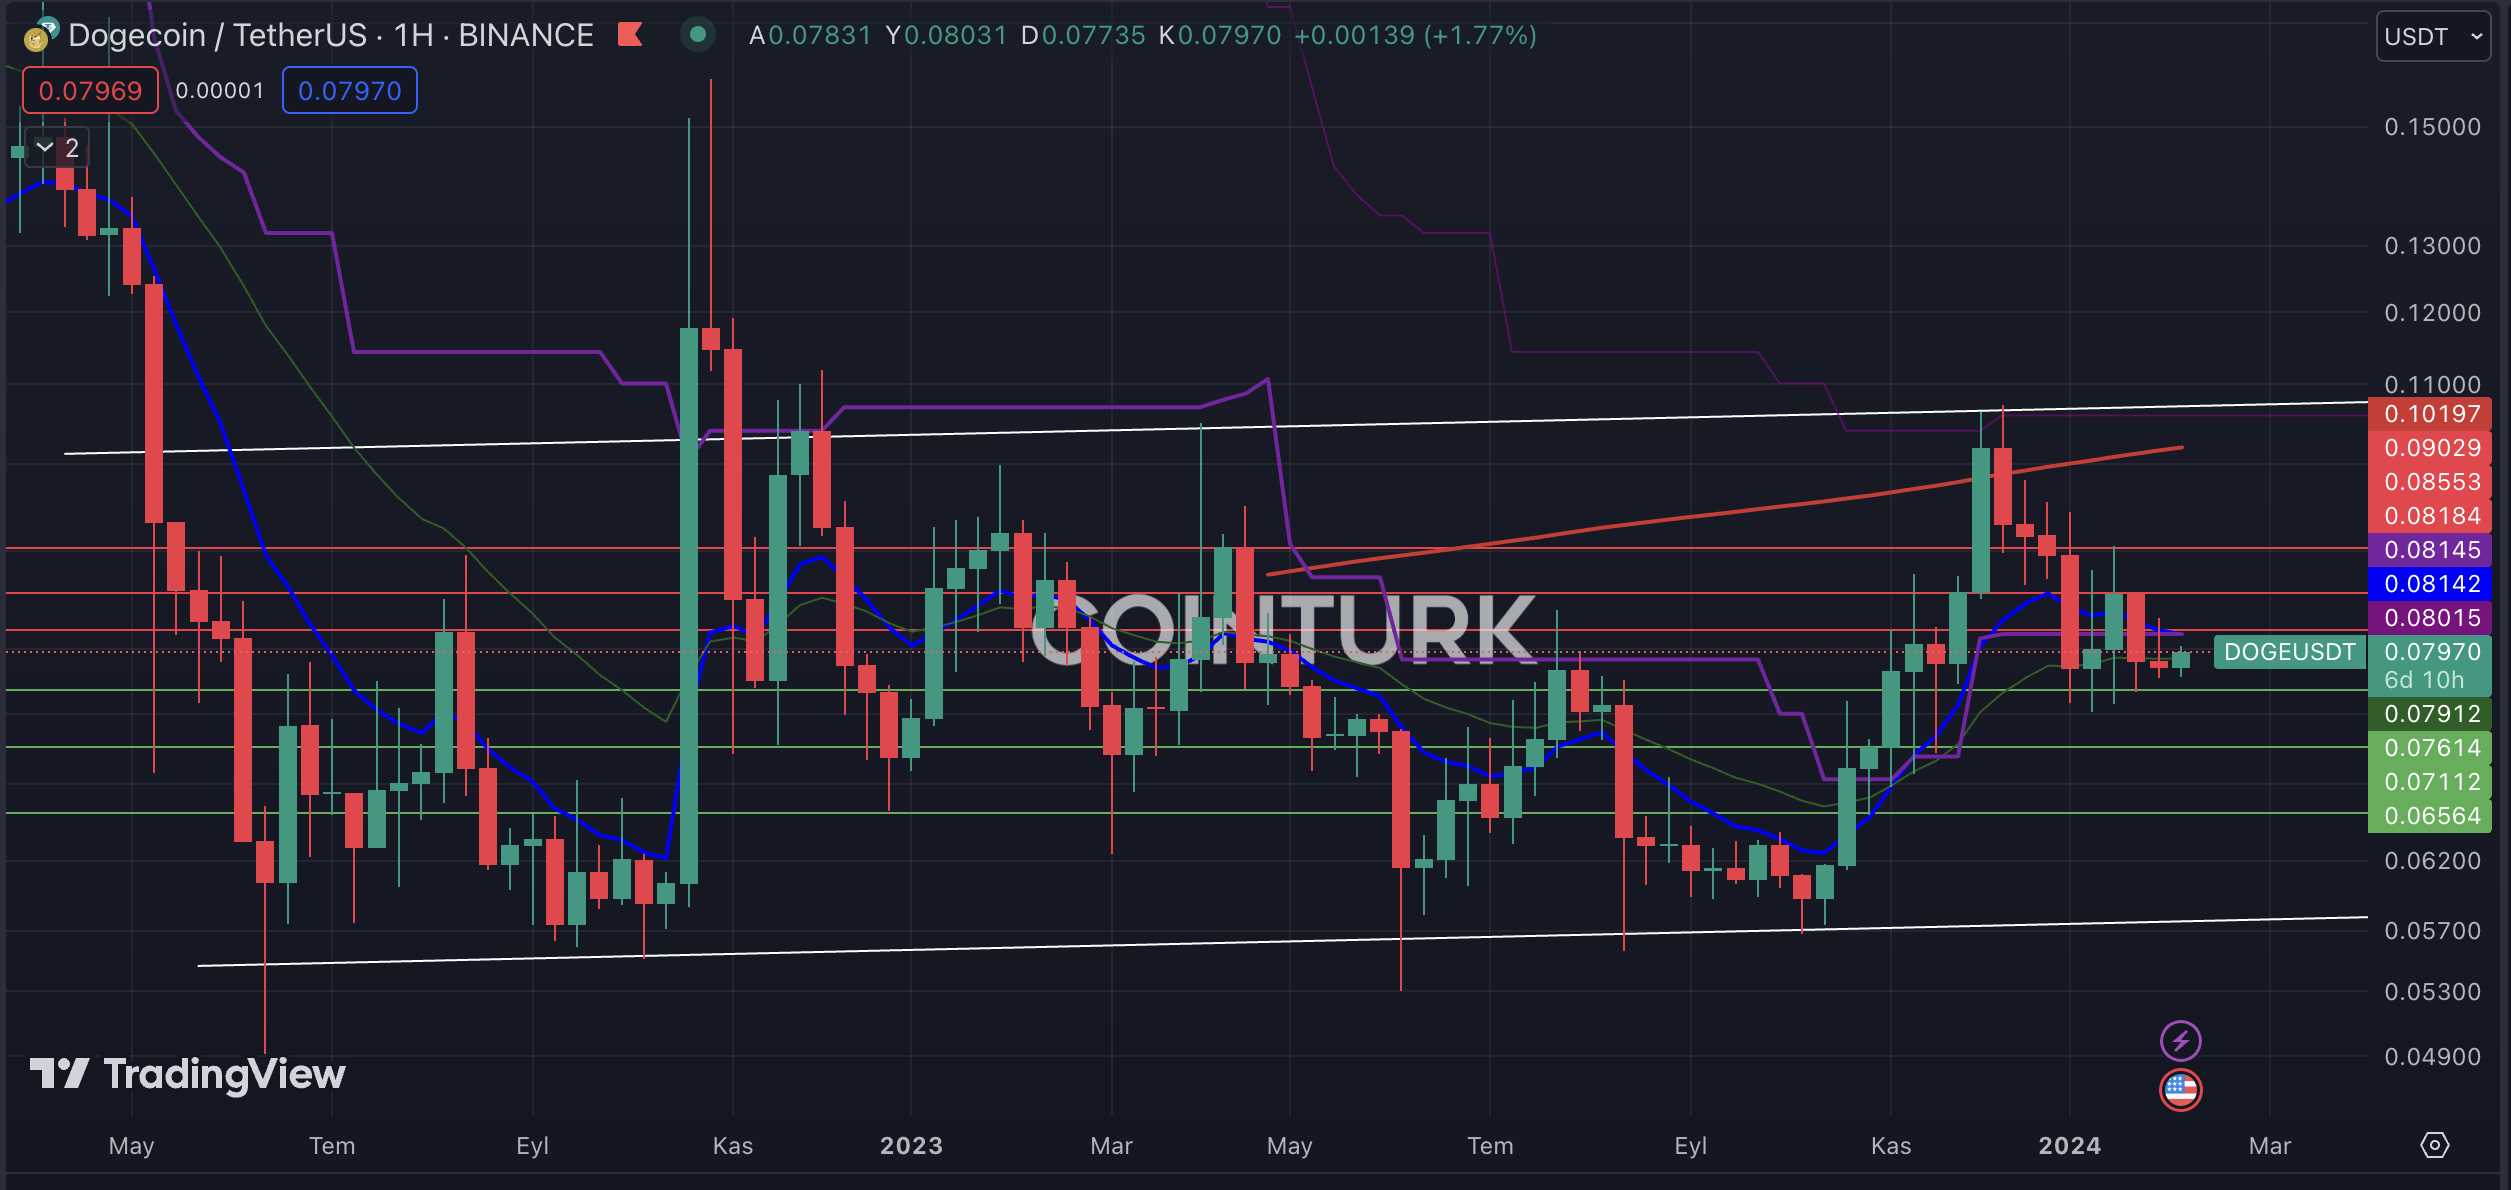
The first noticeable pattern structure in the weekly DOGE chart is a rectangle formation. This pattern has provided investors with important clues several times, as evidenced by the resistance breakout that occurred only once during the rise in November 2023. The recent uptrend momentum seeing the EMA 200 level as a resistance has led to selling pressure.
DOGE 週線圖中第一個值得注意的形態結構是矩形結構。這種模式多次為投資者提供了重要線索,2023 年 11 月上漲過程中僅發生過一次阻力突破就證明了這一點。近期將 EMA 200 水平視為阻力的上升趨勢導致了拋售壓力。
The most important support levels for DOGE to monitor are, in order; 0.07614 / 0.07112 and 0.06564 dollars. Particularly, a weekly bar closure below the vital 0.07614 dollar level in recent weeks could lead to a long-term loss of momentum for the DOGE price.
DOGE 要監控的最重要的支撐位依序為: 0.07614 / 0.07112 和 0.06564 美元。特別是,最近幾週每週收盤價低於重要的 0.07614 美元水平可能會導致 DOGE 價格長期失去動力。
The most important resistance levels for DOGE are, in order; 0.08184 / 0.08553 and 0.09029 dollars. Especially, a weekly bar closure above the 0.08184 dollar level, which has not been surpassed in the last two weeks, will help DOGE gain momentum.
DOGE 最重要的阻力位依序為: 0.08184 / 0.08553 和 0.09029 美元。特別是,週線收在 0.08184 美元水平之上(過去兩週尚未突破),將有助於 DOGE 獲得動力。

The post first appeared on COINTURK NEWS: Dogecoin Price Analysis and Market Predictions
該貼文首次出現在 COINTURK 新聞:狗狗幣價格分析和市場預測


 Crypto Daily™
 Crypto Daily™
 DogeHome
 TheCoinrise Media
 Thecoinrepublic.com
 TheCoinrise Media
 TheCoinrise Media
 Cryptopolitan_News


