You can also read this news on COINTURK NEWS: Dogecoin Price Analysis and Market Predictions
COINTURK NEWS でもこのニュースを読むことができます: Dogecoin 価格分析と市場予測
Another area that has made a mark in the crypto market recently is memecoin projects. The hype on the Solana network has brought these projects to the attention of crypto investors frequently, enabling many to make significant gains. However, the most valuable memecoin project in the crypto market, Dogecoin, continues to maintain its silence. So, what do the chart analyses say for DOGE? Let’s take a look together.
最近暗号通貨市場で名を残したもう 1 つの分野は、ミームコイン プロジェクトです。 Solana ネットワーク上の誇大広告により、これらのプロジェクトは頻繁に仮想通貨投資家の注目を集め、多くの投資家が大きな利益を得ることができました。しかし、仮想通貨市場で最も価値のあるミームコインプロジェクトであるドージコインは沈黙を守り続けている。それでは、チャート分析はDOGEについて何を示しているのでしょうか?一緒に見てみましょう。
Dogecoin Four-Hour Chart Analysis
ドージコイン4時間足チャート分析
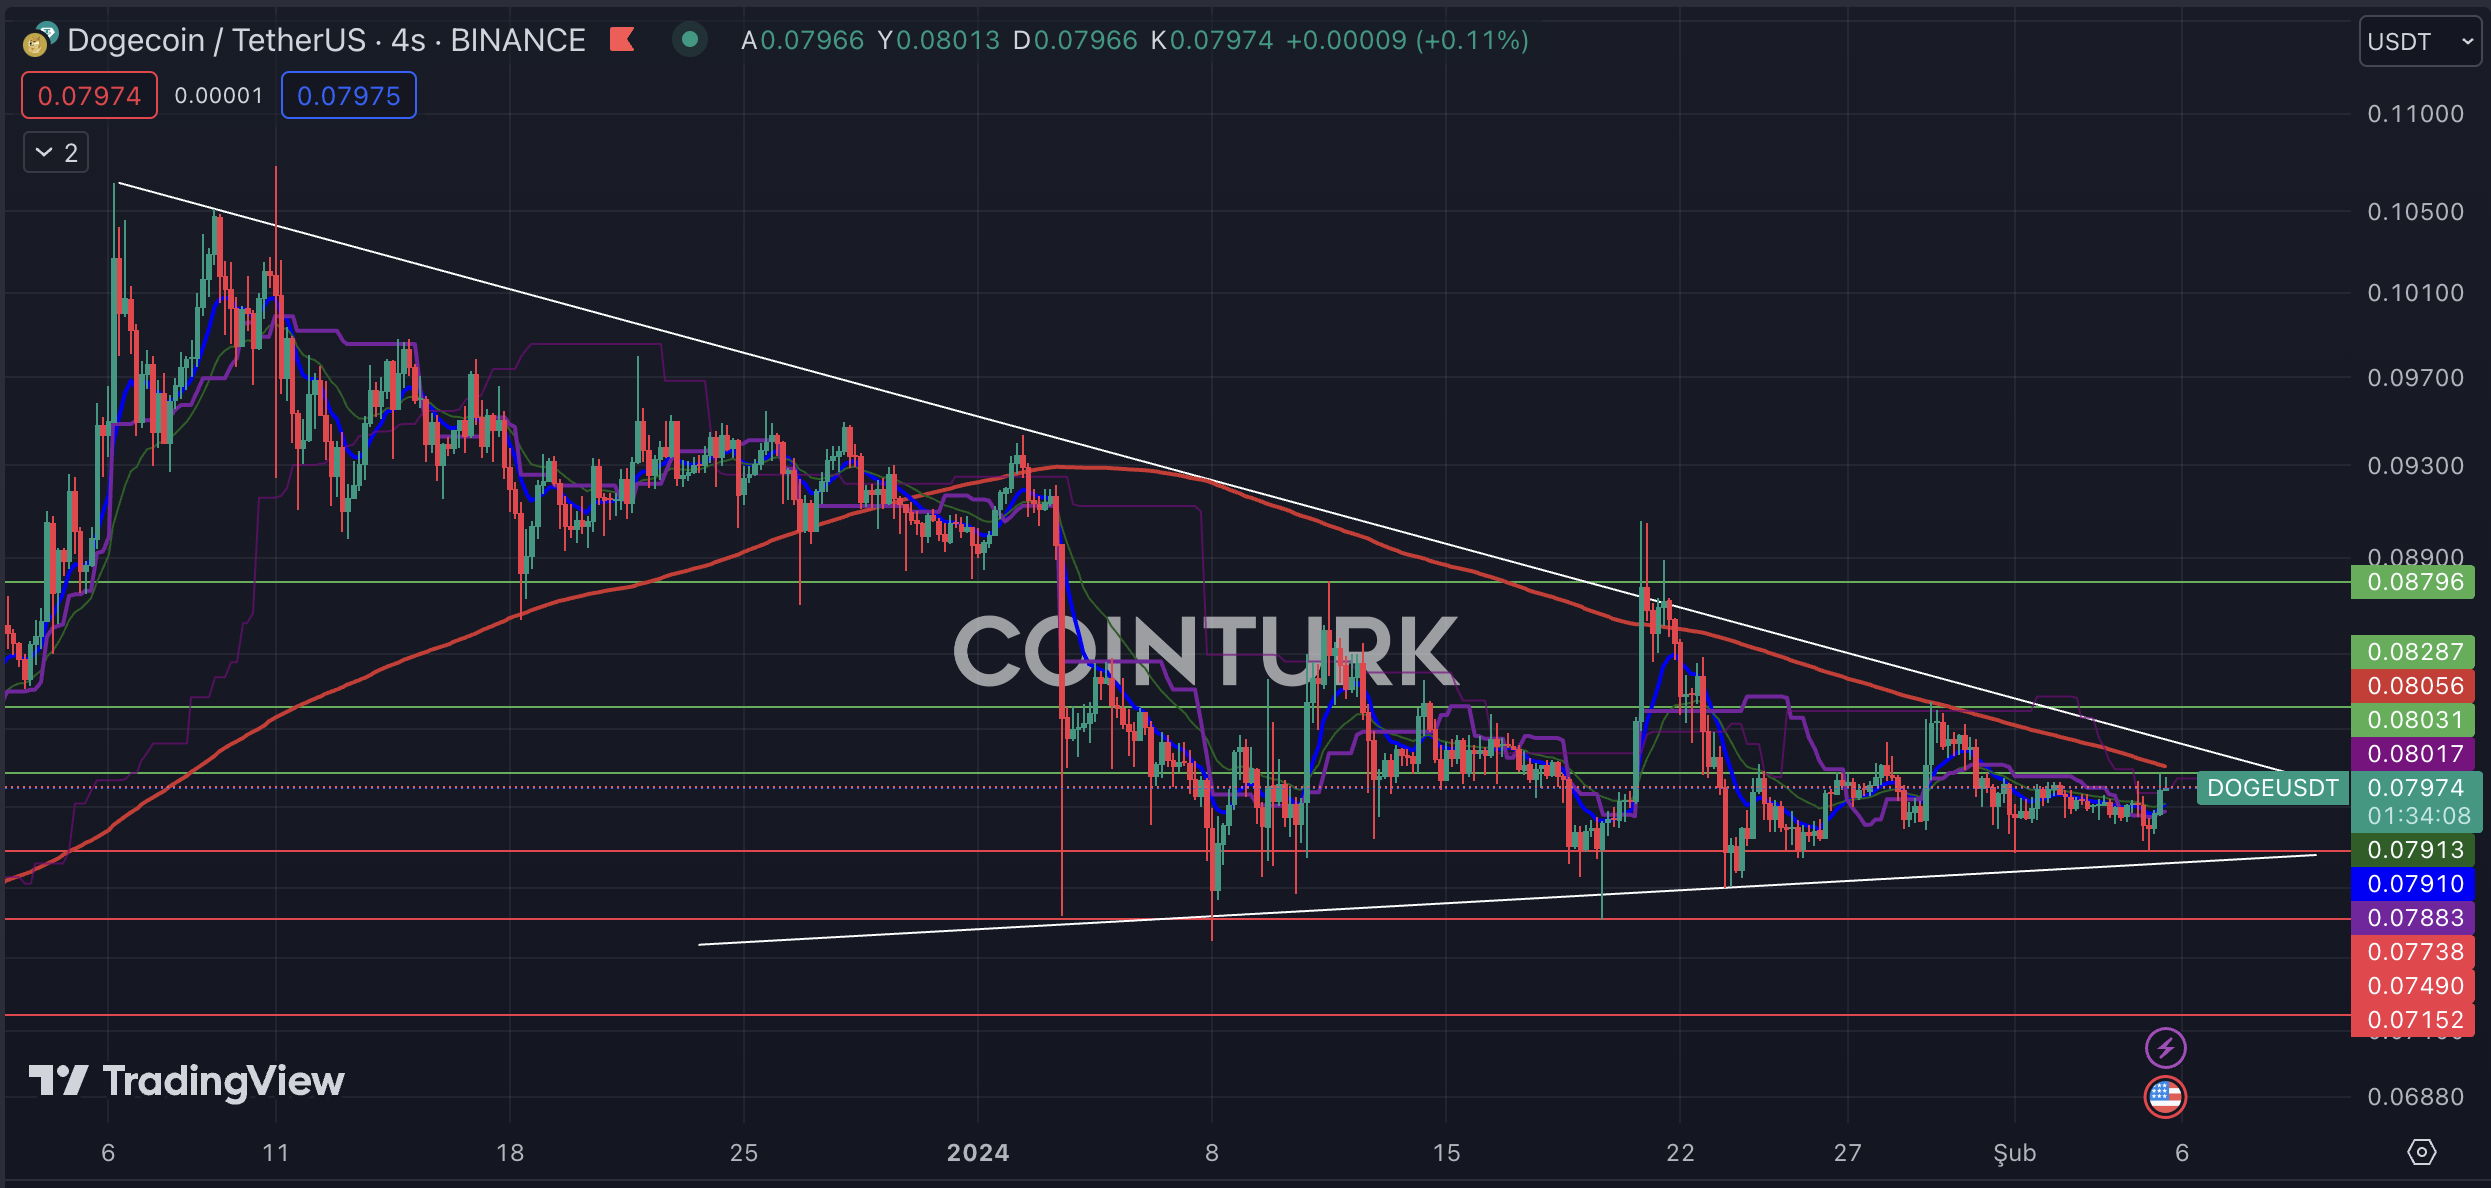
The first noticeable pattern structure in the four-hour DOGE chart is a triangle formation. The absence of a support or resistance breakout in this formation provides important clues to investors. The fact that the EMA 200 (red line) level acts as resistance in the latest bar formations is leading to a negative scenario for the DOGE price.
4 時間足 DOGE チャートの最初の顕著なパターン構造は、トライアングル フォーメーションです。このフォーメーションにサポートまたはレジスタンスのブレイクアウトがないことは、投資家に重要な手がかりを提供します。 EMA 200 (赤い線) レベルが最新の足形成における抵抗として機能するという事実は、DOGE 価格のネガティブなシナリオにつながっています。
The most important support levels to watch on the DOGE chart are, in order; 0.07738 / 0.07490 and 0.07152 dollars. Particularly, a four-hour bar closure below the crucial 0.07738 dollar level will subject the DOGE price to selling pressure.
DOGE チャートで注目すべき最も重要なサポート レベルは、順番に次のとおりです。 0.07738 / 0.07490 と 0.07152 ドル。特に、重要な0.07738ドルレベルを下回る4時間足の終値は、DOGE価格に売り圧力の影響を受けることになる。
The most important resistance levels to monitor in the four-hour DOGE chart are, in order; 0.08031 / 0.08287 and 0.08796 dollars. Especially, a four-hour bar closure above the 0.08287 dollar level, which intersects with the formation resistance line, will significantly accelerate DOGE’s price and favor an upward trend.
4 時間の DOGE チャートで監視する最も重要な抵抗レベルは、次の順序です。 0.08031 / 0.08287 と 0.08796 ドル。特に、フォーメーションレジスタンスラインと交差する0.08287ドルレベルを超える4時間足の終値は、DOGEの価格を大幅に加速させ、上昇トレンドを促進するでしょう。
Dogecoin Weekly Chart Analysis
ドージコインの週間チャート分析
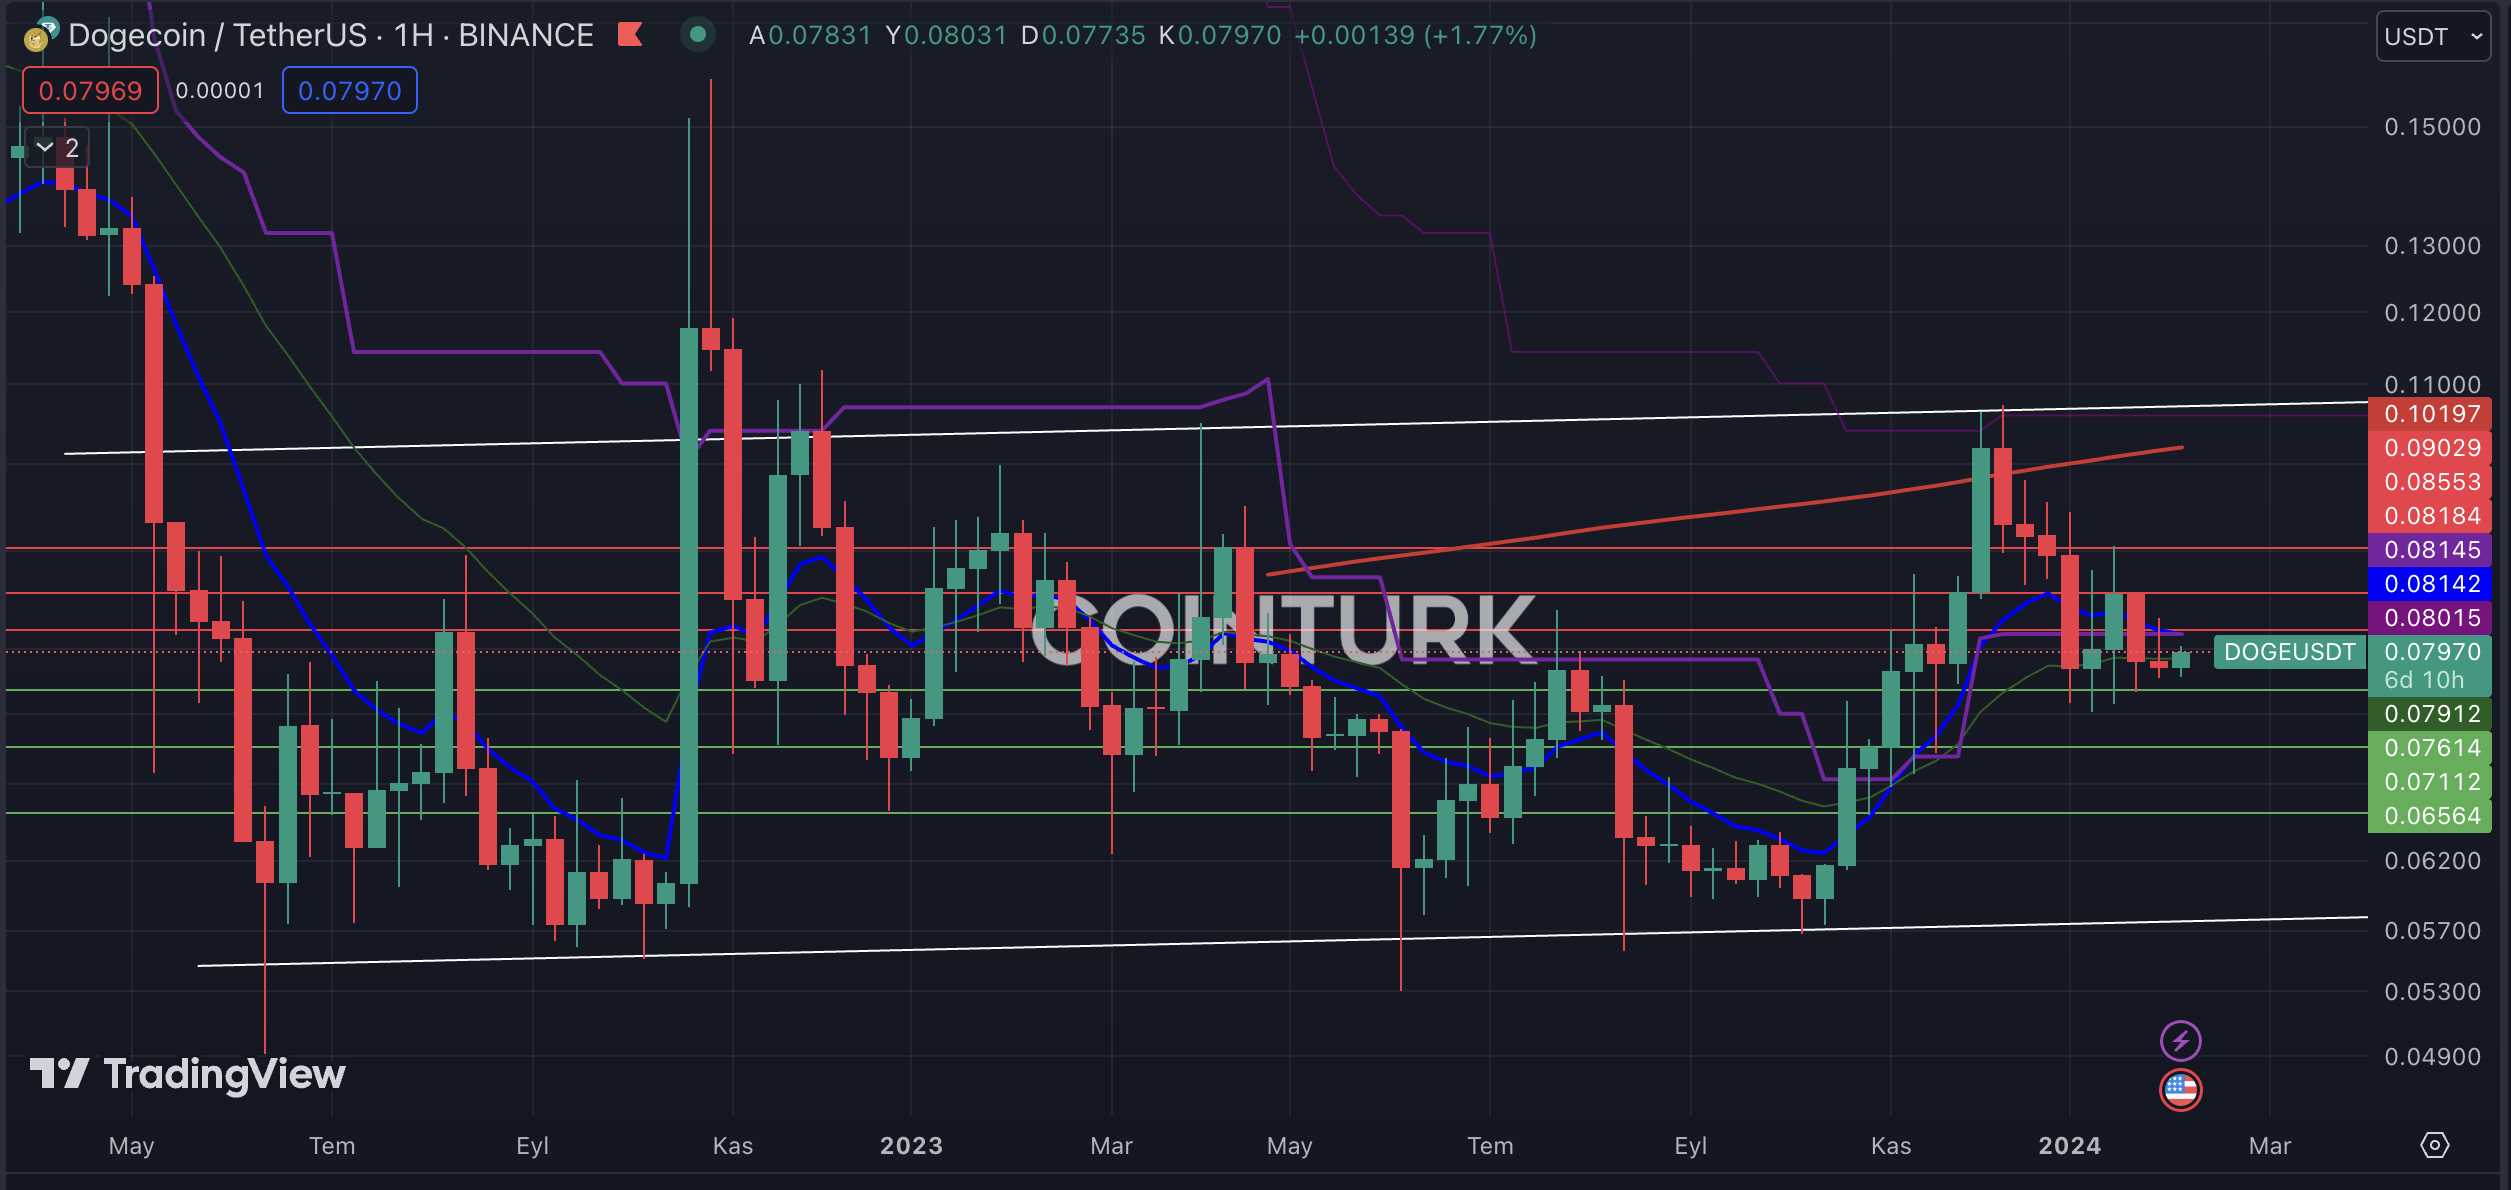
The first noticeable pattern structure in the weekly DOGE chart is a rectangle formation. This pattern has provided investors with important clues several times, as evidenced by the resistance breakout that occurred only once during the rise in November 2023. The recent uptrend momentum seeing the EMA 200 level as a resistance has led to selling pressure.
週次 DOGE チャートで最初に注目すべきパターン構造は、長方形の形成です。このパターンは、2023年11月の上昇中に一度だけ発生した抵抗線の突破によって証明されるように、投資家に重要な手がかりを何度も提供してきた。EMA 200レベルを抵抗線と見なす最近の上昇トレンドの勢いは、売り圧力につながった。
The most important support levels for DOGE to monitor are, in order; 0.07614 / 0.07112 and 0.06564 dollars. Particularly, a weekly bar closure below the vital 0.07614 dollar level in recent weeks could lead to a long-term loss of momentum for the DOGE price.
DOGE が監視する最も重要なサポート レベルは、順番に次のとおりです。 0.07614 / 0.07112 と 0.06564 ドル。特に、ここ数週間の週足終値が重要な0.07614ドルの水準を下回ると、DOGE価格の長期的な勢いの喪失につながる可能性がある。
The most important resistance levels for DOGE are, in order; 0.08184 / 0.08553 and 0.09029 dollars. Especially, a weekly bar closure above the 0.08184 dollar level, which has not been surpassed in the last two weeks, will help DOGE gain momentum.
DOGE の最も重要な抵抗レベルは次のとおりです。 0.08184 / 0.08553 と 0.09029 ドル。特に、過去2週間で超えられていない0.08184ドルレベルを超える週足終値は、DOGEの勢いを増すのに役立つだろう。
The post first appeared on COINTURK NEWS: Dogecoin Price Analysis and Market Predictions
この投稿は COINTURK NEWS に最初に掲載されました: ドージコインの価格分析と市場予測


 ETHNews
 Bitop Exchange
 CoinPedia News
 DogeHome
 ItsBitcoinWorld
 Cryptopolitan_News
 U_Today
 Cryptopolitan_News
 DT News


