

Bitcoin (BTC) rallied from $81,500 on March 4th, with bulls attempting to push the price above $90,000 on March 5th. However, some analysts remain cautious about Bitcoin's short-term prospects. A March 3rd Bitfinex market report suggested Bitcoin might encounter "significant resistance" at $94,000.
比特幣(BTC)從3月4日的$ 81,500起來,公牛試圖將3月5日以上的價格提高到90,000美元以上。 但是,一些分析師對比特幣的短期前景保持謹慎。 3月3日的Bitfinex市場報告表明,比特幣可能會遇到“明顯的阻力”,為94,000美元。
Further caution was voiced by CryptoQuant contributor XBTManager, who in a Quicktake post predicted continued Bitcoin consolidation. Therefore, risky trades should be avoided in the coming months. The analyst indicated a favorable buying opportunity would arise when short-term holders (those holding less than 155 days) begin selling, and long-term holders start accumulating.
加密貢獻者XBTManager表示了進一步的謹慎,後者在Quicktake帖子中預測了比特幣持續合併。 因此,應在未來幾個月內避免冒險交易。 分析師表示,當短期持有人(持有少於155天)開始銷售時,將會出現有利的購買機會,並且長期持有人開始積累。
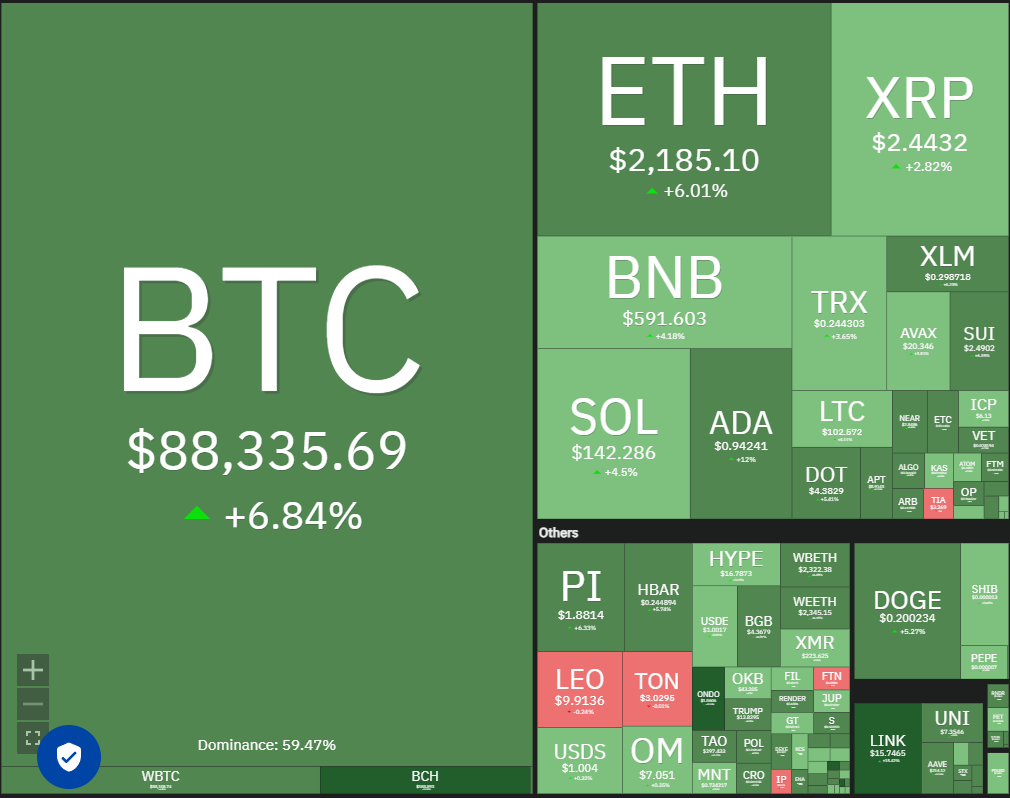
Despite near-term price uncertainty, investor confidence in Bitcoin's long-term potential remains strong. Mexican billionaire Ricardo Salinas, in a Bloomberg interview, revealed that 70% of his investment portfolio is allocated to Bitcoin-related assets, with the remaining 30% in gold and gold mining companies.
儘管價格近期不確定性,但投資者對比特幣長期潛力的信心仍然很強。 墨西哥億萬富翁里卡多·薩利納斯(Ricardo Salinas)在彭博(Bloomberg)的一次採訪中透露,他的70%的投資組合被分配給了與比特幣相關的資產,其餘30%用於黃金和黃金礦業公司。
This analysis examines critical support and resistance levels for Bitcoin and other leading cryptocurrencies.
該分析檢查了比特幣和其他領先的加密貨幣的關鍵支持和阻力水平。
Bitcoin Price Analysis
比特幣價格分析
Bitcoin appears to be forming a symmetrical triangle pattern, suggesting indecision between buyers and sellers.
比特幣似乎正在形成一種對稱的三角形模式,這表明買賣雙方之間的猶豫不決。
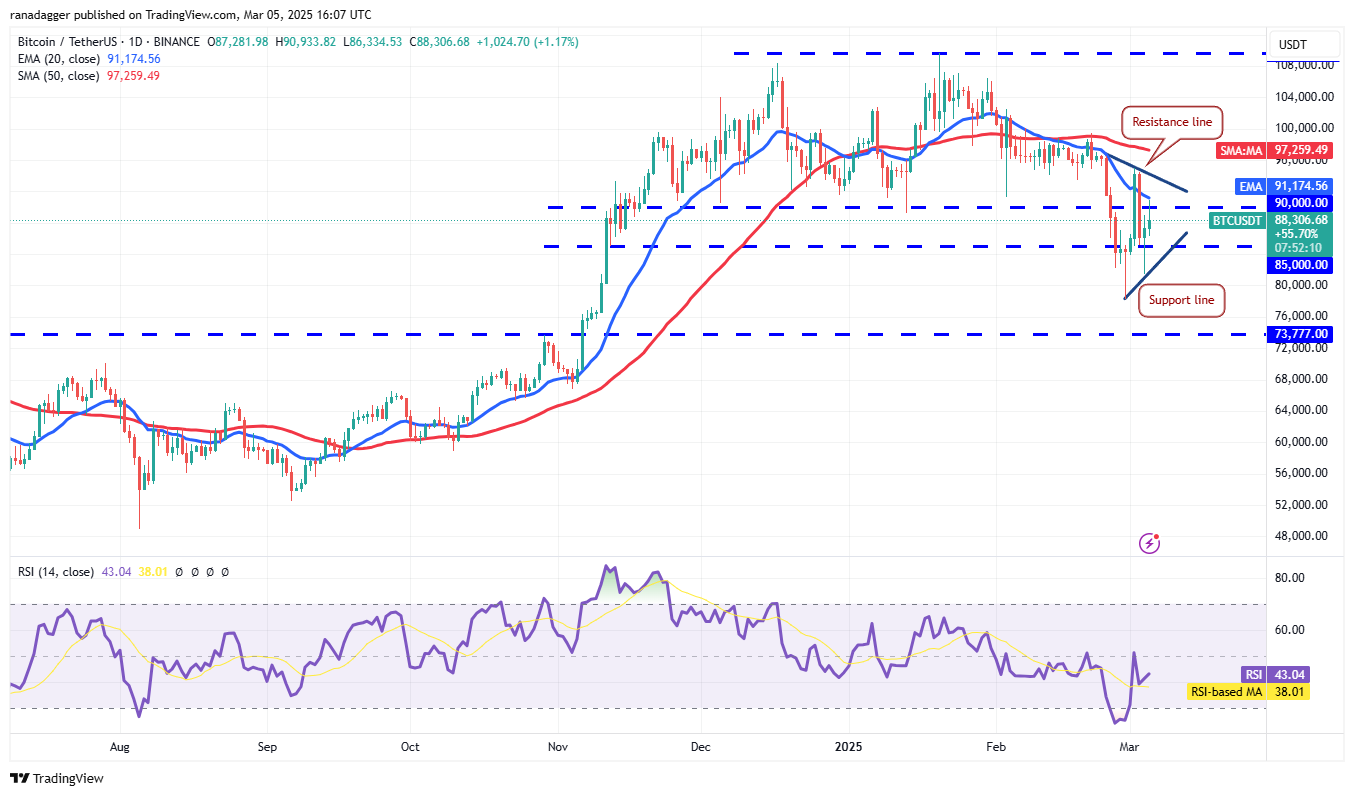
The BTC/USDT pair reached the 20-day exponential moving average ($91,174), a key resistance level. A decisive break above this EMA would signal reduced selling pressure, potentially leading to a push above the triangle's resistance line and towards the 50-day simple moving average ($97,259). A close above the 50-day SMA would confirm bullish momentum.
BTC/USDT對達到了20天的指數移動平均線(91,174美元),這是一個關鍵阻力水平。 超出此EMA的決定性突破將表明降低銷售壓力,這可能導致超過三角電阻線的推動力,並朝著50天的簡單移動平均線(97,259美元)。 在50天的SMA上方的近距離將確認看漲的勢頭。
Conversely, a sharp decline from the 20-day EMA, breaking below the triangle pattern, would negate this optimistic outlook. This could trigger a retest of the February 28th intraday low of $78,258.
相反,從20天的EMA急劇下降,突破了三角形的模式,將否定這種樂觀的前景。 這可能會觸發2月28日的盤中低點78,258美元的重新測試。
Ether Price Analysis
以太價格分析
Ether (ETH) dipped below $2,000 on March 4th, but strong buying at lower levels, evident in the long lower wick of the candlestick, suggests bullish support.
Ether(ETH)在3月4日下降到2,000美元以下,但在燭台的長下游燈芯中很明顯地以較低的水平購買,表示支持。
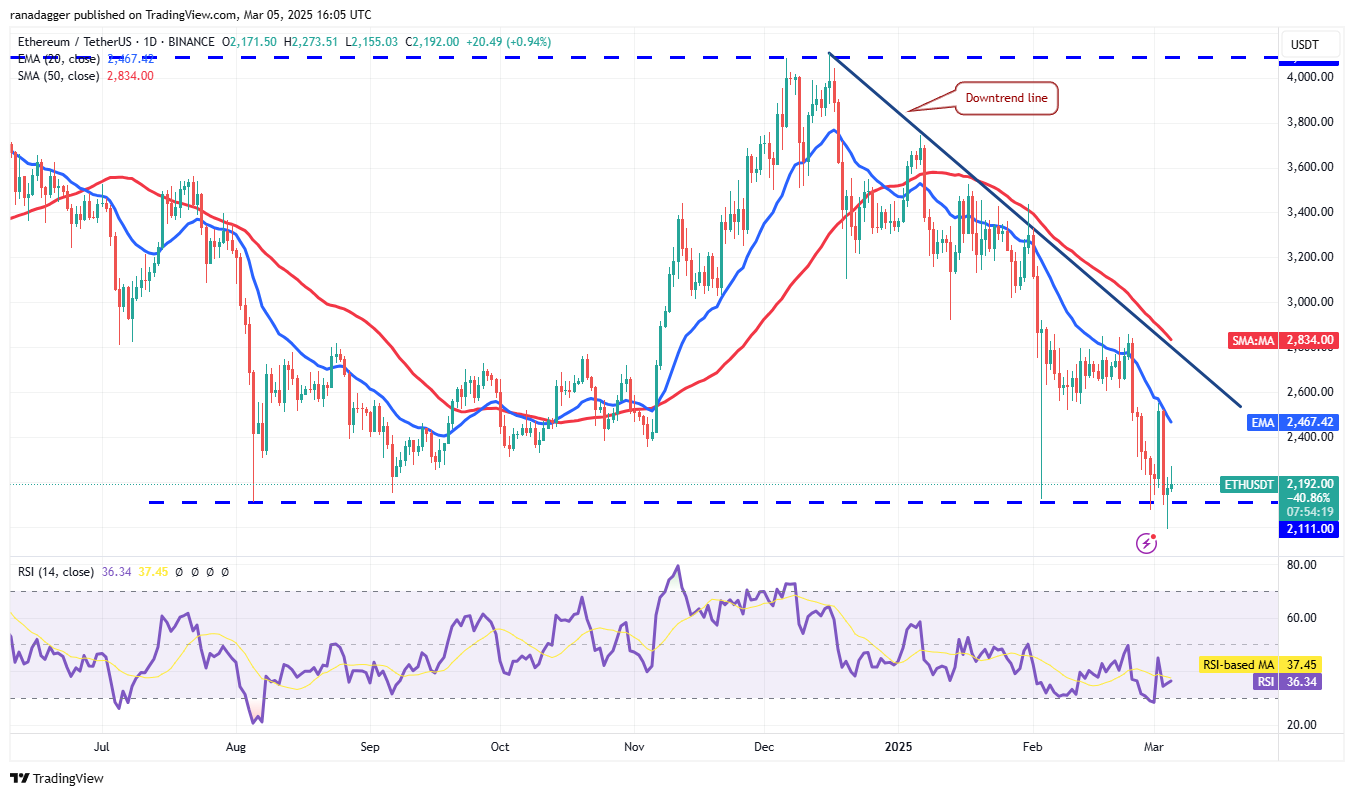
However, the recovery faces resistance at the 20-day EMA ($2,467) and the downtrend line. A reversal from these resistance levels could push the ETH/USDT pair back below $2,111, potentially leading to a drop to $1,750.
但是,恢復在20天EMA($ 2,467)和下降趨勢線時面臨阻力。 從這些阻力水平上逆轉可能會將ETH/USDT對推回2,111美元以下,可能導致跌至1,750美元。
A close above the downtrend line would signal weakening bearish pressure, potentially paving the way for a rally towards $3,400.
在下降線上方的接近,這表明削弱了看跌壓力,有可能為集會鋪平到3,400美元。
XRP Price Analysis
XRP價格分析
XRP (XRP) has been trading within a descending channel for several days, indicating a range-bound market with buying near support and selling near resistance.
XRP(XRP)已經在降頻道內進行了幾天的交易,這表明範圍內的市場幾乎可以購買並接近電阻。
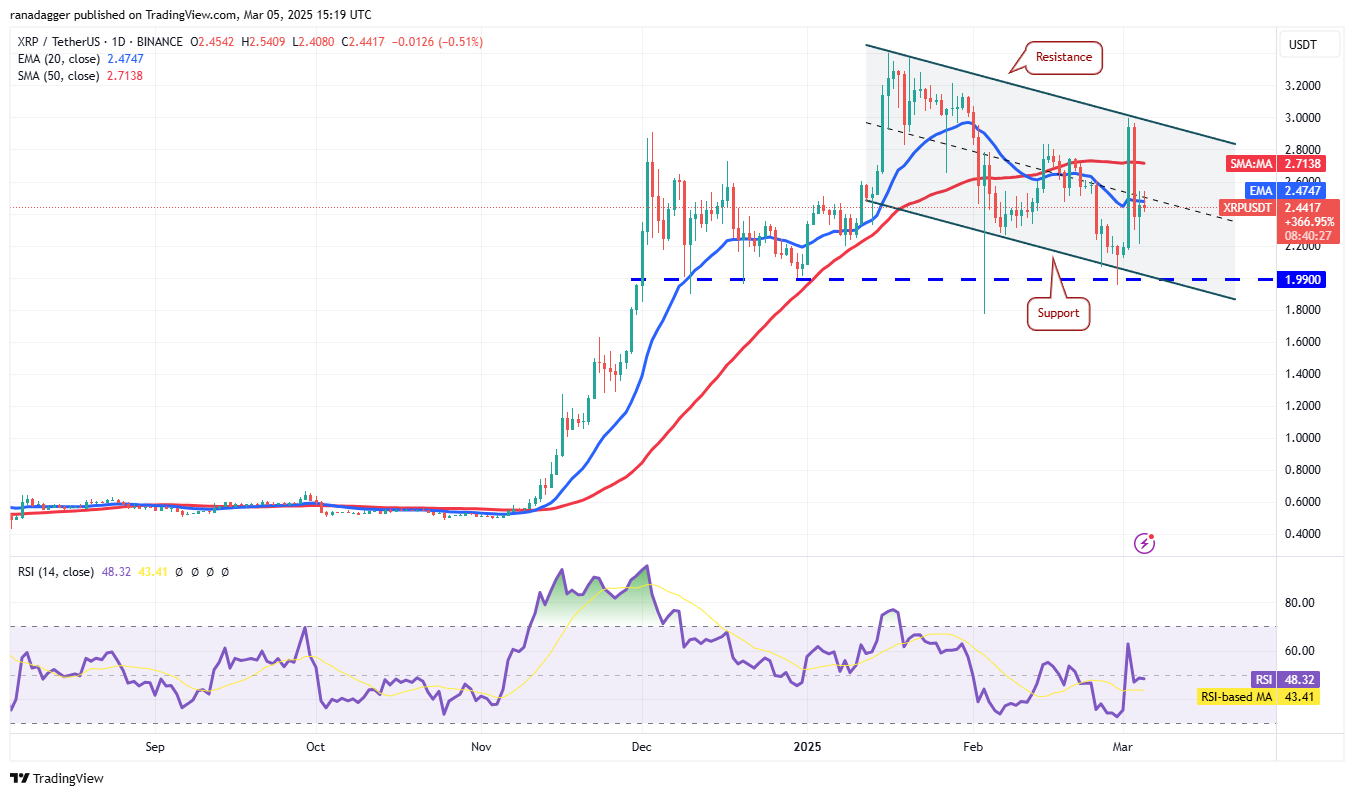
Both moving averages are flattening, and the RSI is near the midpoint, suggesting a balance between supply and demand. Holding above the 20-day EMA ($2.47) could propel the XRP/USDT pair towards the channel's resistance line. A break and close above the channel would signal a potential rally to $3.40.
兩個移動平均值都在變平,RSI接近中點,表明供應和需求之間保持平衡。 在20天的EMA($ 2.47)上保持持有,可以將XRP/USDT對推向頻道的阻力線。 突破並在頻道上方關閉,可能會指示潛在的集會為$ 3.40。
Conversely, a decline from the 20-day EMA, breaking below $2.53, would suggest bearish dominance. A break and close below $1.99 could accelerate selling, potentially leading to a drop to $1.27.
相反,從20天的EMA下降(低於2.53美元)將暗示看跌優勢。 休息時間低於$ 1.99的售價可能會加速銷售,可能導致下降至1.27美元。
BNB Price Analysis
BNB價格分析
BNB (BNB) broke below the $557 support on March 4th, but the bears failed to sustain lower prices.
BNB(BNB)在3月4日的支持下打破了557美元的支持,但熊隊未能維持較低的價格。

Bulls are attempting a recovery, but this is likely to face selling pressure at the 20-day EMA ($619). A sharp decline from the 20-day EMA would indicate negative sentiment and selling on rallies, increasing the risk of a break below $546 and a potential drop to $500.
公牛正在嘗試恢復,但這很可能在20天EMA(619美元)的銷售壓力上。與20天的EMA相比,急劇下降將表明對集會上的負面情緒和銷售,將休息的風險降至546美元以下,並可能下降到500美元。
Conversely, a sustained move above the 50-day SMA ($646) would invalidate the bearish outlook, potentially leading to a rally to $686.
相反,超過50天的SMA(646美元)的持續移動將使看跌前景無效,這可能導致集會至686美元。
Solana Price Analysis
Solana價格分析
Strong buying at the $125 support level in Solana (SOL) is evident from the long lower wick on the March 4th candlestick.
從3月4日的燭台上的較長的下Wick可以明顯看出,Solana(SOL)的125美元支持水平的強勁購買是明顯的。
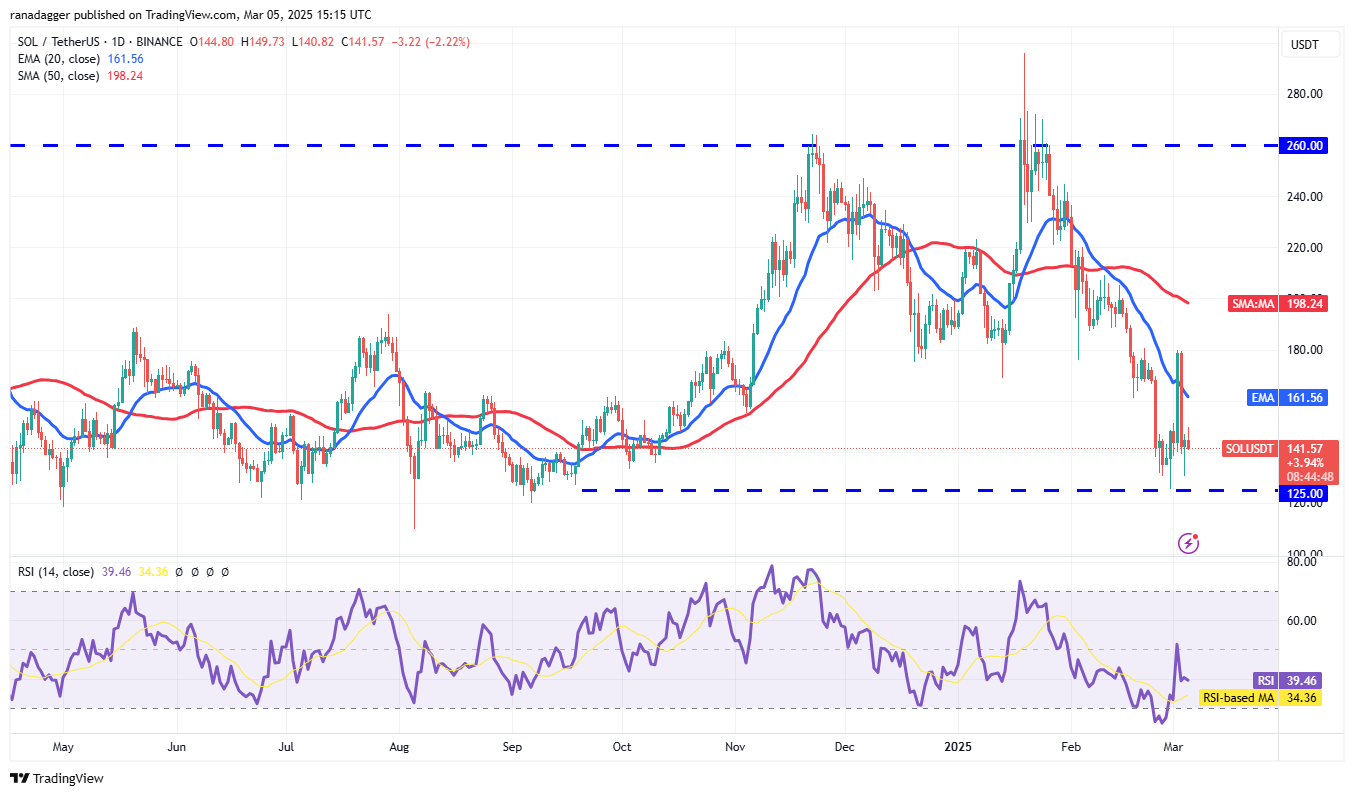
Minor resistance lies at $151. Breaking this level could push the SOL/USDT pair towards the 20-day EMA ($161). However, sellers are expected to defend the zone between the 20-day EMA and $180. A reversal from this zone could lead to sideways trading between $180 and $125.
較小的阻力為151美元。 打破此水平可能會將Sol/USDT對推向20天EMA($ 161)。 但是,預計賣方將捍衛20天EMA至180美元之間的區域。 從該區域逆轉可能會導致側向交易,在180美元至125美元之間。
A break below $125, however, would signal weakness, potentially leading to a decline to $110 and then $100.
然而,低於125美元的休息時間會表明弱點,可能導致下降至110美元,然後下降100美元。
Cardano Price Analysis
Cardano價格分析
Cardano (ADA) has experienced significant volatility recently, reflecting a struggle between bulls and bears.
Cardano(ADA)最近經歷了重大波動,反映了公牛與熊之間的鬥爭。
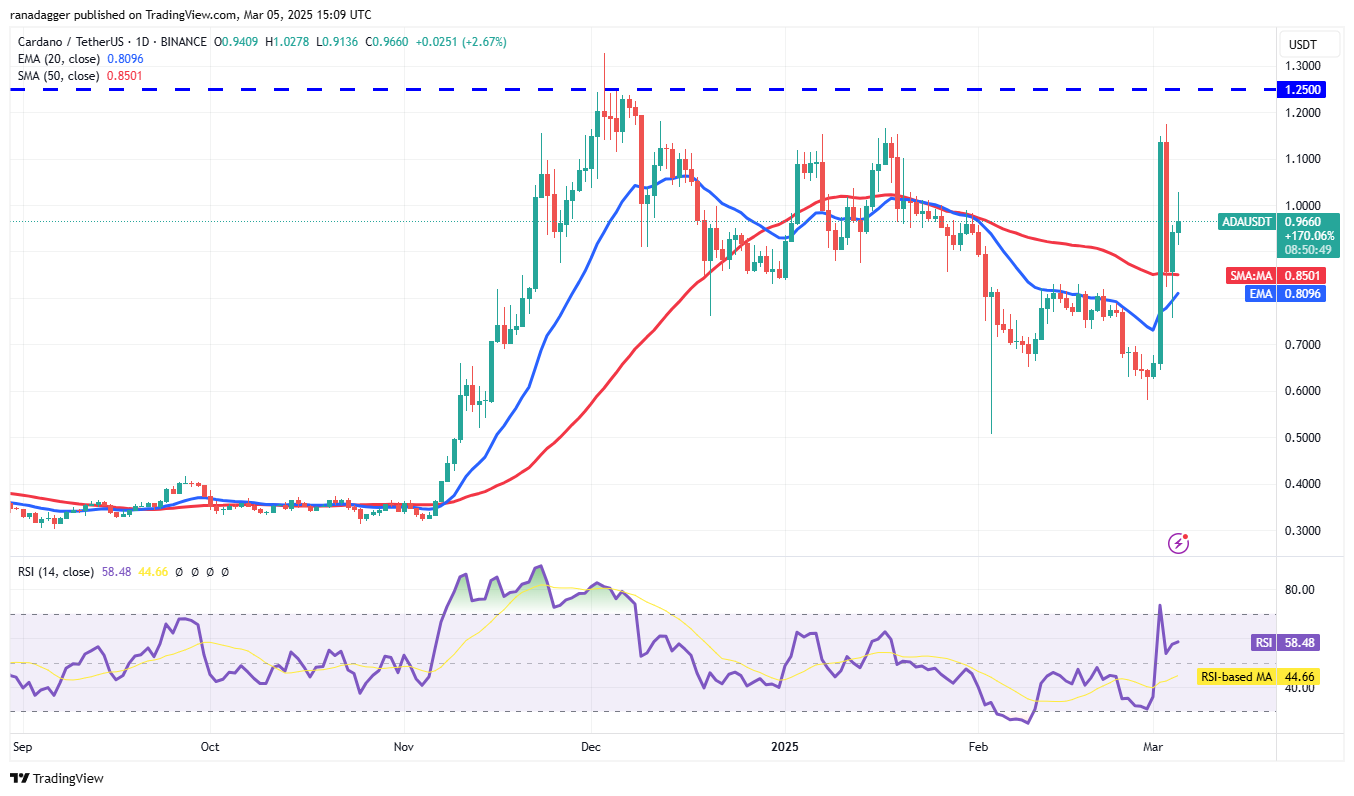
The ADA/USDT pair bounced off the 20-day EMA ($0.80) on March 4th, suggesting buying interest at lower levels. Holding above $1 could lead to another attempt to push the price to $1.25.
ADA/USDT對在3月4日彈跳了20天EMA(0.80美元),這表明在較低水平上購買了利息。 持有以上$ 1的價格可能會導致另一次將價格提高到1.25美元。
High volatility often precedes range compression. Failure to hold above $1 would suggest selling on rallies, potentially confining the pair to a range between the 20-day EMA and $1.
高波動率通常先於範圍壓縮。 如果不持有1美元以上的售價,則建議在集會上出售,這可能會將兩人限制在20天EMA至1美元之間的範圍。
Dogecoin Price Analysis
Dogecoin價格分析
Dogecoin (DOGE) reversed from the 20-day EMA ($0.23) on March 3rd and broke below the support line.
Dogecoin(Doge)於3月3日從20天的EMA(0.23美元)扭轉,並在支撐線下方摔倒。
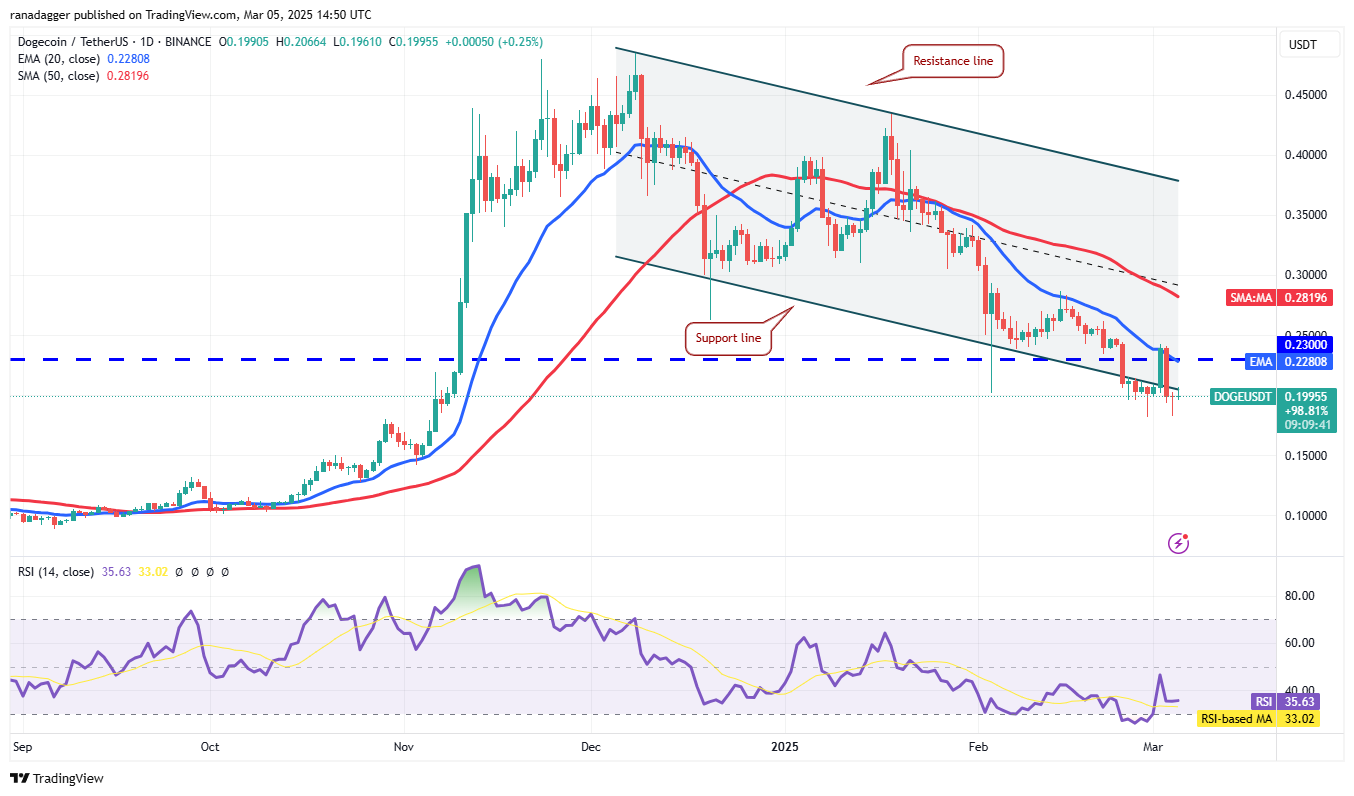
The bulls prevented a drop below the $0.18 support. A successful push and sustain above the 20-day EMA could indicate that the channel break was a bear trap, potentially leading to a rally to the 50-day SMA ($0.28).
公牛阻止了低於0.18美元的支撐。 超過20天EMA的成功推動和維持可能表明,頻道斷裂是一個熊陷阱,有可能導致50天SMA的集會(0.28美元)。
Conversely, a break and close below $0.18 could trigger further declines to $0.14 and eventually to the $0.10 support level.
相反,休息時間低於$ 0.18,可能會觸發進一步下降到0.14美元,最終達到0.10美元的支持水平。
Pi Price Analysis
PI價格分析
Pi (PI) experienced a significant rally from $0.10 on February 20th to $3 on February 26th, showcasing strong buying pressure.
PI(PI)從2月20日的0.10美元到2月26日的3美元進行了重大集會,這表明了強烈的購買壓力。
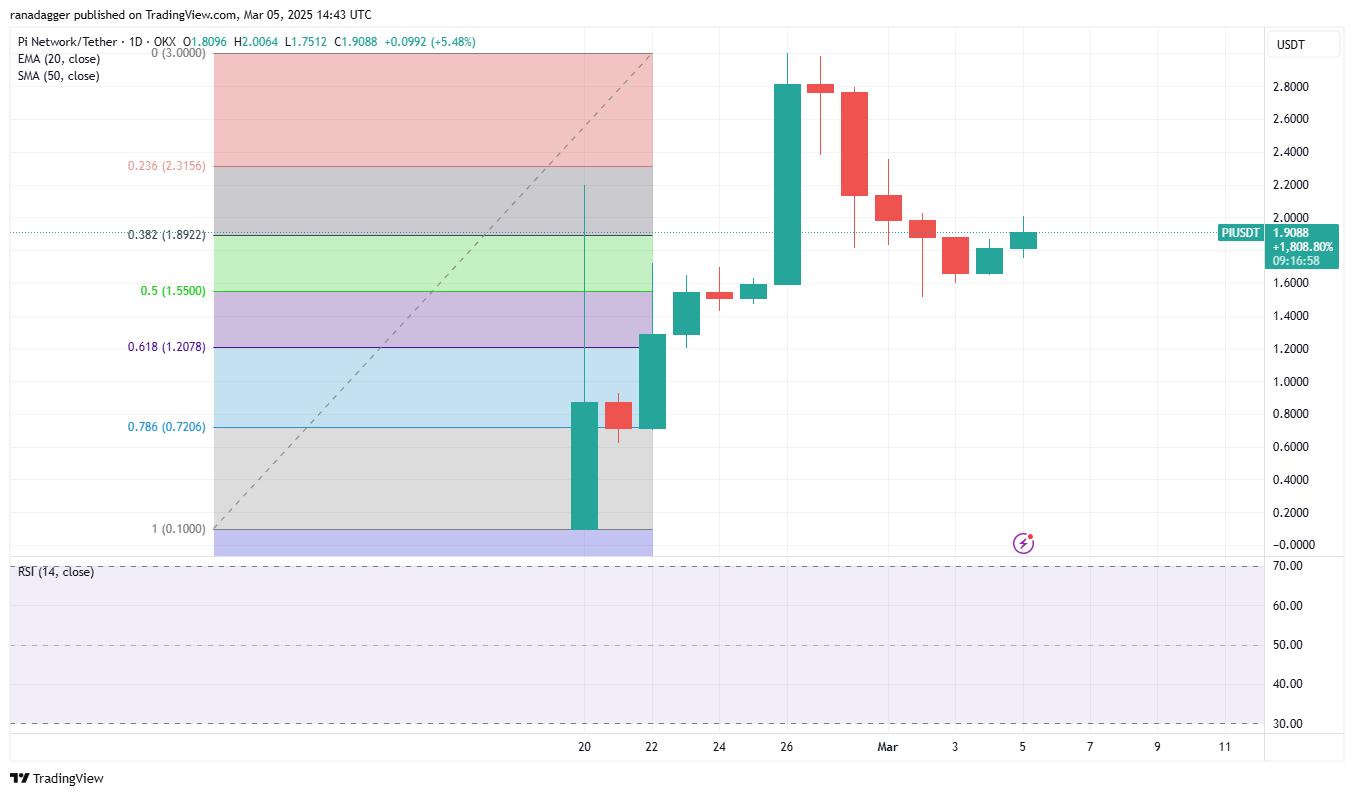
Profit-taking subsequently pulled the price down, with the PI/USDT pair finding support at the 50% Fibonacci retracement level of $1.55. A recovery attempt is anticipated towards $2.38 and then $2.80. A break and close above $3 would signal a resumption of the uptrend towards $4.45.
獲利隨後將價格降低,PI/USDT對以1.55美元的價格為50%的Fibonacci反回接回收水平。 預計恢復嘗試將以2.38美元,然後是2.80美元。 休息時間超過3美元,這表明將上升趨勢恢復到4.45美元。
However, bears may attempt to push the price below the $1.55 support, potentially leading to a drop to the 61.8% retracement level of $1.20.
但是,熊可能試圖將價格提高到1.55美元以下,可能導致61.8%的回收水平為1.20美元。
Hedera Price Analysis
Hedera價格分析
Hedera (HBAR) has traded between moving averages for the past three days, indicating indecision.
Hedera(HBAR)在過去三天之間在移動平均值之間進行了交易,表明猶豫不決。
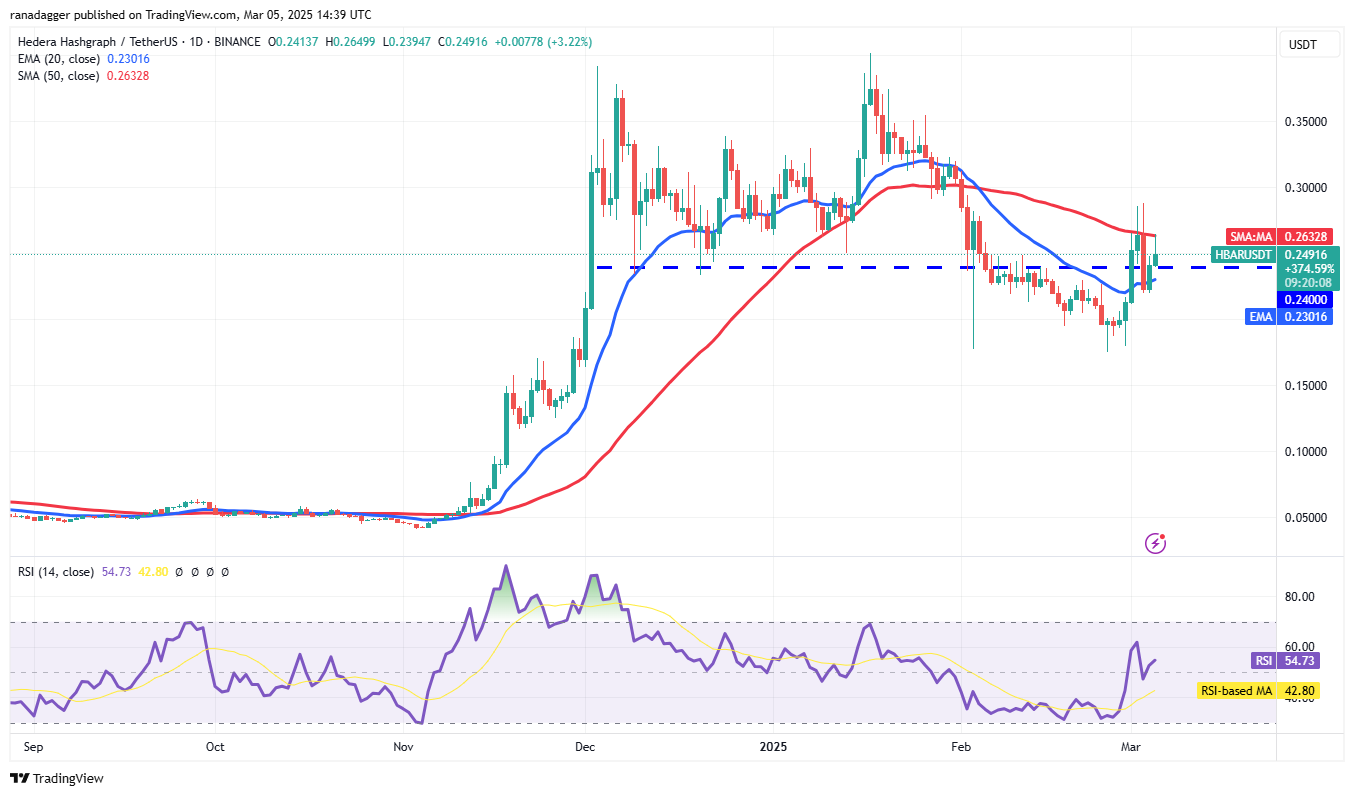
The 20-day EMA ($0.23) is showing signs of upward movement, and the RSI is slightly above the midpoint, suggesting a minor bullish advantage. A break and close above the 50-day SMA ($0.26) could initiate a rally to $0.32 and potentially $0.35.
20天的EMA(0.23美元)顯示出向上運動的跡象,RSI略高於中點,這表明是小的看漲優勢。 突破並關閉50天SMA(0.26美元)可能會引發漲幅為0.32美元,並可能為0.35美元。
Conversely, a break and close below $0.22 would suggest bearish control, potentially leading to a drop to $0.17, a key support level.
相反,休息時間低於$ 0.22,這表明看跌控制權,可能導致$ 0.17,這是一個關鍵支持水平。
Chainlink Price Analysis
連鎖價格分析
Chainlink (LINK) fell below the support line of its descending channel on March 4th, but buying at lower levels is evident in the long lower wick of the candlestick.
Chainlink(Link)在3月4日的下降頻道的支撐線以下,但在燭台的長下游中,以較低水平的價格購買。
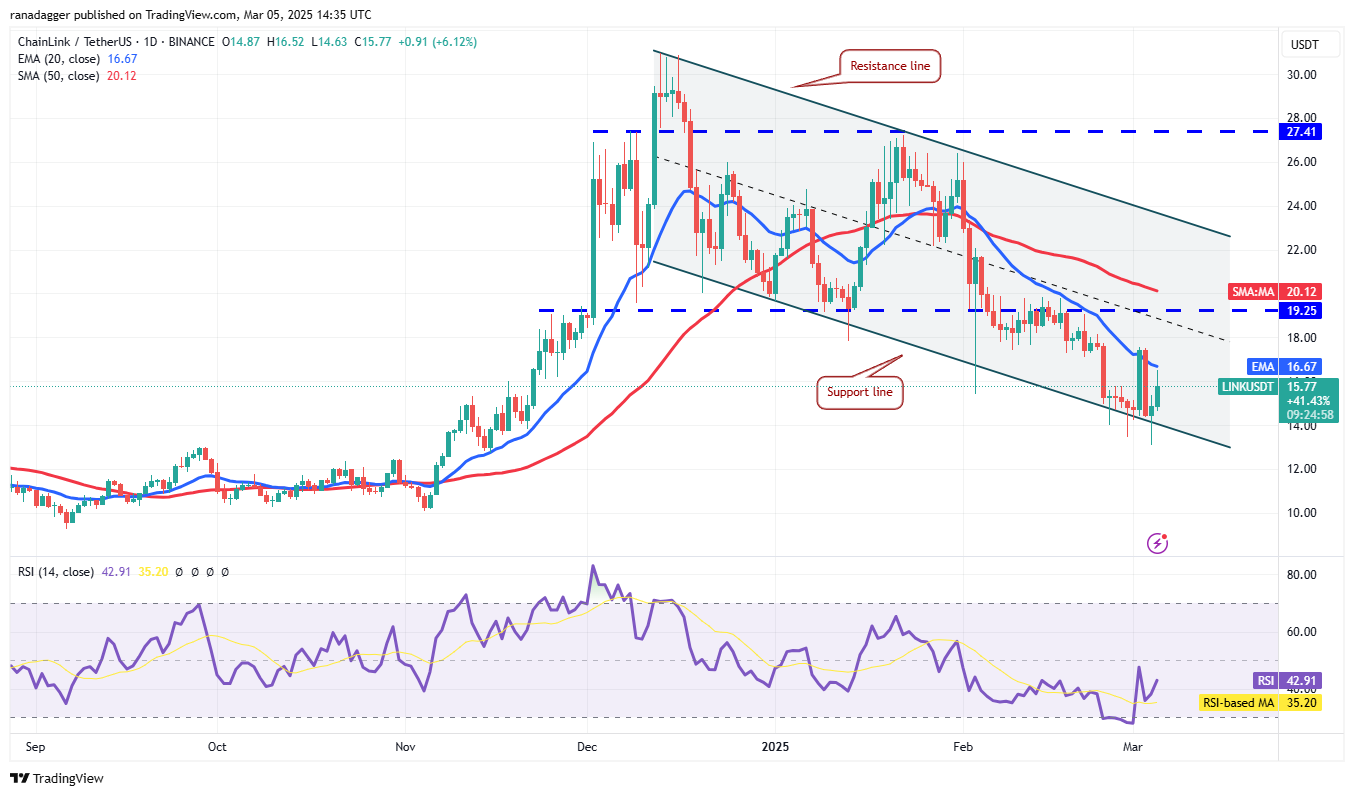
Bulls need to push and maintain the price above the 20-day EMA ($16.67) to reduce selling pressure. This could lead to a rise towards the 50-day SMA ($20.12), a likely strong resistance level.
公牛需要將價格推高超過20天EMA(16.67美元)以減少銷售壓力。 這可能會導致50天SMA(20.12美元)的上升,這可能是強大的阻力水平。
Conversely, a decline from the current level and a close below the support line would signal continued bearish control, potentially accelerating selling below $13.08 and pushing the pair towards $10.
相反,從目前的水平下降,在支撐線以下的關閉水平下降將表示持續看跌控制,可能會加速銷售以下$ 13.08,並將這對夫婦推向10美元。
Disclaimer: This article does not provide financial advice. All investment and trading decisions involve risk, and readers should conduct their own thorough research before making any investment choices.
免責聲明:本文不提供財務建議。 所有投資和交易決策都涉及風險,讀者應在做出任何投資選擇之前進行自己的徹底研究。
 The Coin Republic
 BlockchainReporter
 TheCoinrise Media
 BlockchainReporter
 DogeHome
 CFN
CFN Cointelegraph
 CFN
CFN


