

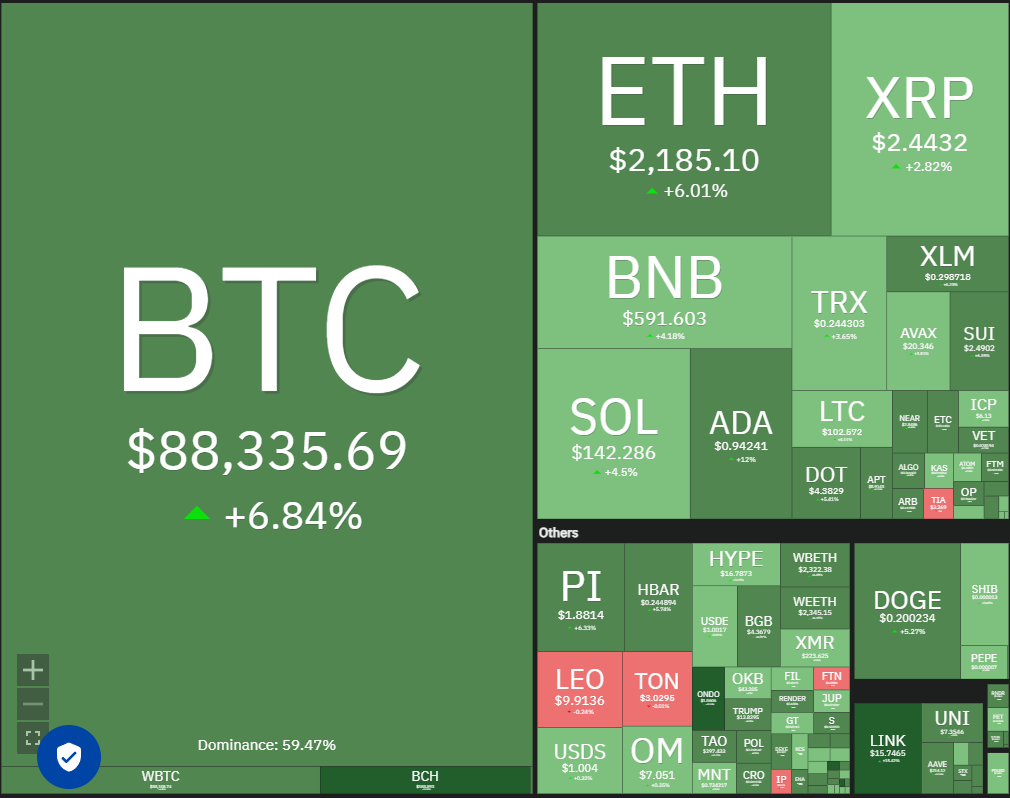
Bitcoin (BTC) rallied from $81,500 on March 4th, with bulls attempting to push the price above $90,000 on March 5th. However, some analysts remain cautious about Bitcoin's short-term prospects. A March 3rd Bitfinex market report suggested Bitcoin might encounter "significant resistance" at $94,000.
ビットコイン(BTC)は3月4日の81,500ドルから集まり、ブルズは3月5日に90,000ドルを超える価格をプッシュしようとしました。 ただし、一部のアナリストは、ビットコインの短期的な見通しについて慎重であり続けています。 3月3日のBitfinex市場レポートは、ビットコインが94,000ドルで「重大な抵抗」に遭遇する可能性があることを示唆しています。
Further caution was voiced by CryptoQuant contributor XBTManager, who in a Quicktake post predicted continued Bitcoin consolidation. Therefore, risky trades should be avoided in the coming months. The analyst indicated a favorable buying opportunity would arise when short-term holders (those holding less than 155 days) begin selling, and long-term holders start accumulating.
Cryptoquant Contributor Xbtmanagerによってさらに注意が払われました。Xbtmanagerは、Quicktakeの投稿で、継続的なビットコインの統合を予測しました。 したがって、今後数か月以内に危険な取引を避ける必要があります。 アナリストは、短期保有者(155日未満の保有者)が販売を開始し、長期保有者が蓄積を開始すると、好意的な購入機会が生じることを示しました。
Despite near-term price uncertainty, investor confidence in Bitcoin's long-term potential remains strong. Mexican billionaire Ricardo Salinas, in a Bloomberg interview, revealed that 70% of his investment portfolio is allocated to Bitcoin-related assets, with the remaining 30% in gold and gold mining companies.
短期的な価格の不確実性にもかかわらず、ビットコインの長期的な可能性に対する投資家の信頼は引き続き強い。 ブルームバーグのインタビューで、メキシコの億万長者のリカルド・サリナスは、投資ポートフォリオの70%がビットコイン関連の資産に割り当てられており、残りの30%が金と金の採掘会社に割り当てられていることを明らかにしました。
This analysis examines critical support and resistance levels for Bitcoin and other leading cryptocurrencies.
この分析では、ビットコインおよびその他の主要な暗号通貨の重要なサポートと抵抗レベルを調べます。
Bitcoin Price Analysis
ビットコインの価格分析
Bitcoin appears to be forming a symmetrical triangle pattern, suggesting indecision between buyers and sellers.
ビットコインは対称的な三角形のパターンを形成しているようで、買い手と売り手の間の優柔不断を示唆しています。
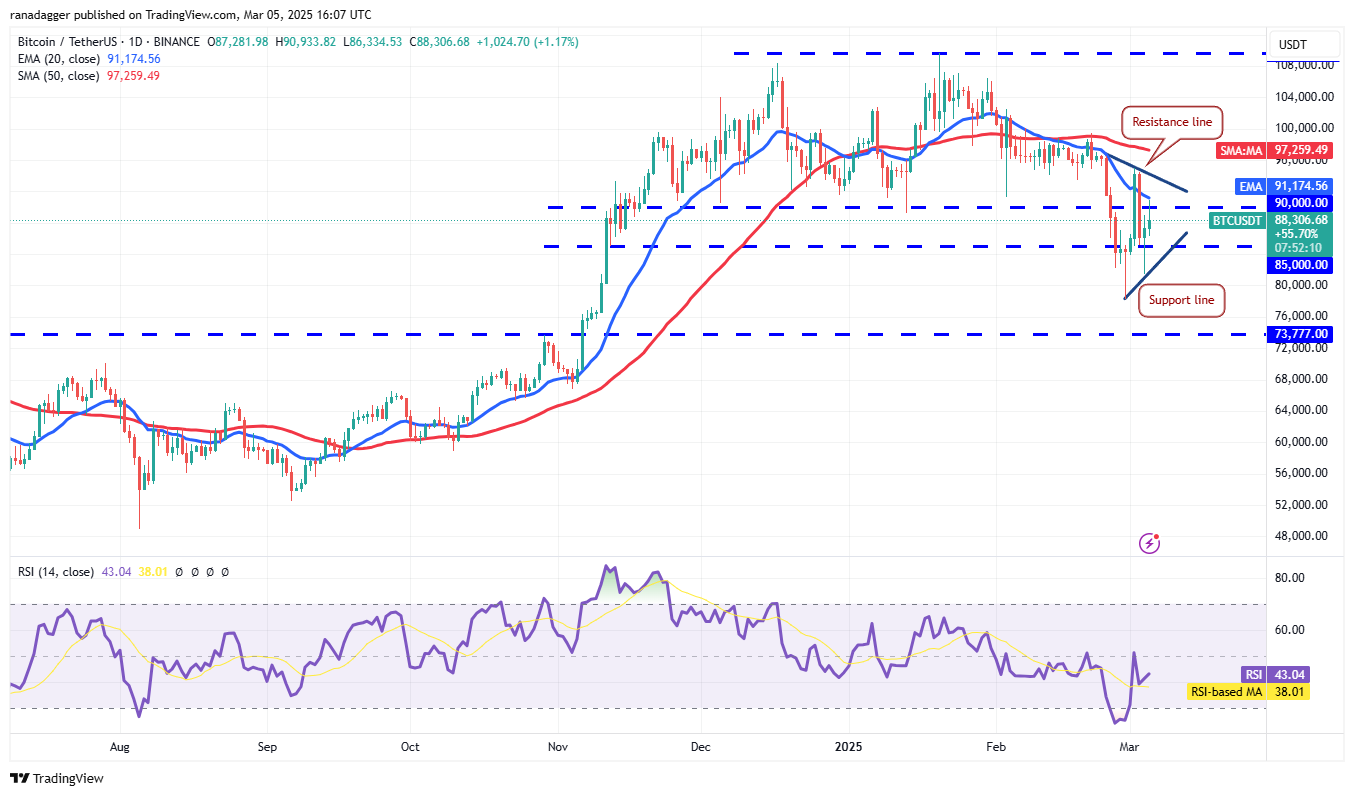
The BTC/USDT pair reached the 20-day exponential moving average ($91,174), a key resistance level. A decisive break above this EMA would signal reduced selling pressure, potentially leading to a push above the triangle's resistance line and towards the 50-day simple moving average ($97,259). A close above the 50-day SMA would confirm bullish momentum.
BTC/USDTペアは、主要な抵抗レベルである20日間の指数移動平均(91,174ドル)に達しました。 このEMAを上回る決定的なブレークは、販売圧力の低下を示す、潜在的に三角形の抵抗ラインを上回り、50日間の単純な移動平均(97,259ドル)に向かってプッシュすることになります。 50日間のSMAを超えると、強気の勢いが確認されます。
Conversely, a sharp decline from the 20-day EMA, breaking below the triangle pattern, would negate this optimistic outlook. This could trigger a retest of the February 28th intraday low of $78,258.
逆に、トライアングルパターンを下回る20日間のEMAからの急激な減少は、この楽観的な見通しを否定するでしょう。 これにより、2月28日以降の低値が78,258ドルの再テストをトリガーする可能性があります。
Ether Price Analysis
エーテル価格分析
Ether (ETH) dipped below $2,000 on March 4th, but strong buying at lower levels, evident in the long lower wick of the candlestick, suggests bullish support.
エーテル(ETH)は3月4日に2,000ドルを下回りましたが、ろうそく足の長い芯で明らかな低いレベルでの強い購入は、強気の支持を示唆しています。
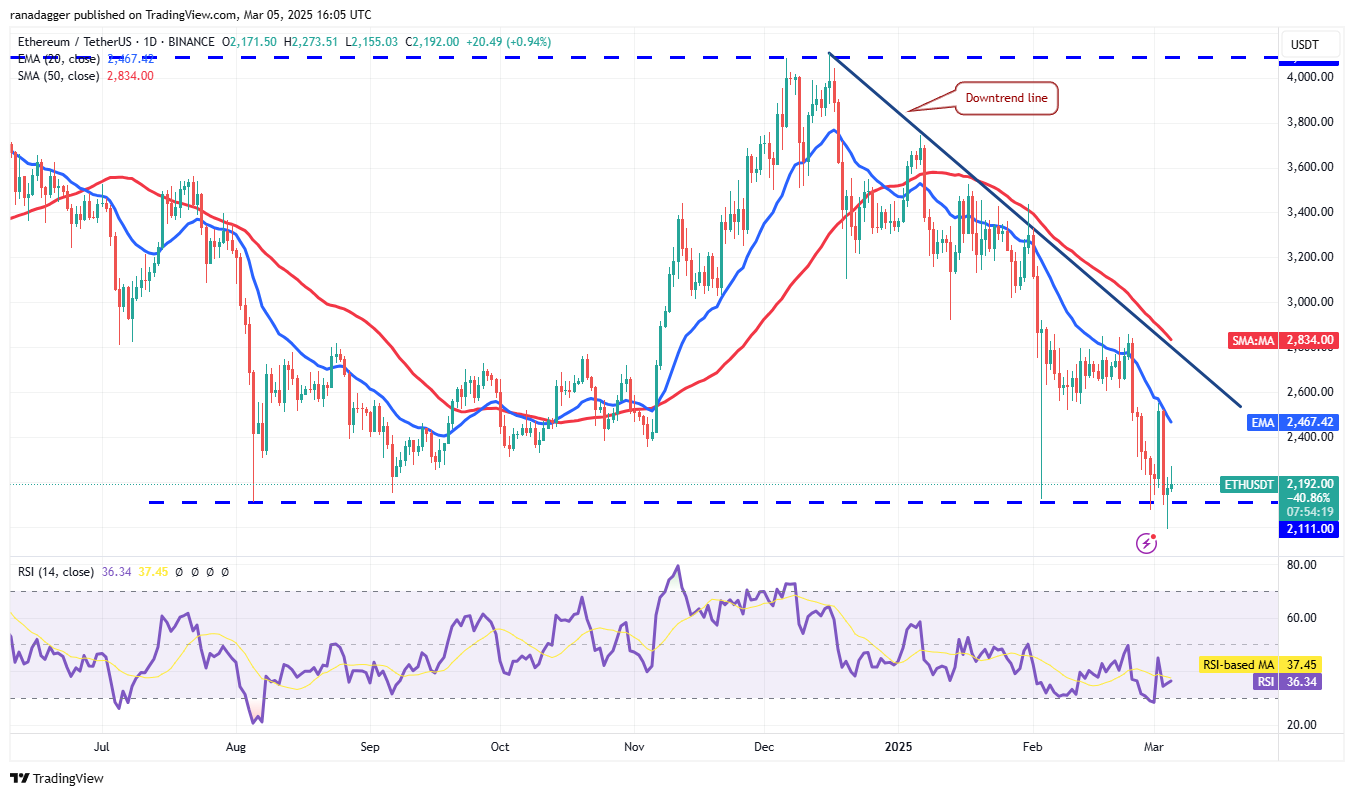
However, the recovery faces resistance at the 20-day EMA ($2,467) and the downtrend line. A reversal from these resistance levels could push the ETH/USDT pair back below $2,111, potentially leading to a drop to $1,750.
ただし、回復は、20日間のEMA(2,467ドル)と下降トレンドラインで抵抗に直面しています。 これらの抵抗レベルからの逆転により、ETH/USDTペアが2,111ドルを下回る可能性があり、潜在的に1,750ドルに低下する可能性があります。
A close above the downtrend line would signal weakening bearish pressure, potentially paving the way for a rally towards $3,400.
下降トレンドラインの上にあると、弱気の圧力が弱まり、3,400ドルへの集会への道が開かれる可能性があります。
XRP Price Analysis
XRP価格分析
XRP (XRP) has been trading within a descending channel for several days, indicating a range-bound market with buying near support and selling near resistance.
XRP(XRP)は数日間降順チャネル内で取引されており、サポートに近い購入と抵抗に近い販売を行う範囲に縛られた市場を示しています。
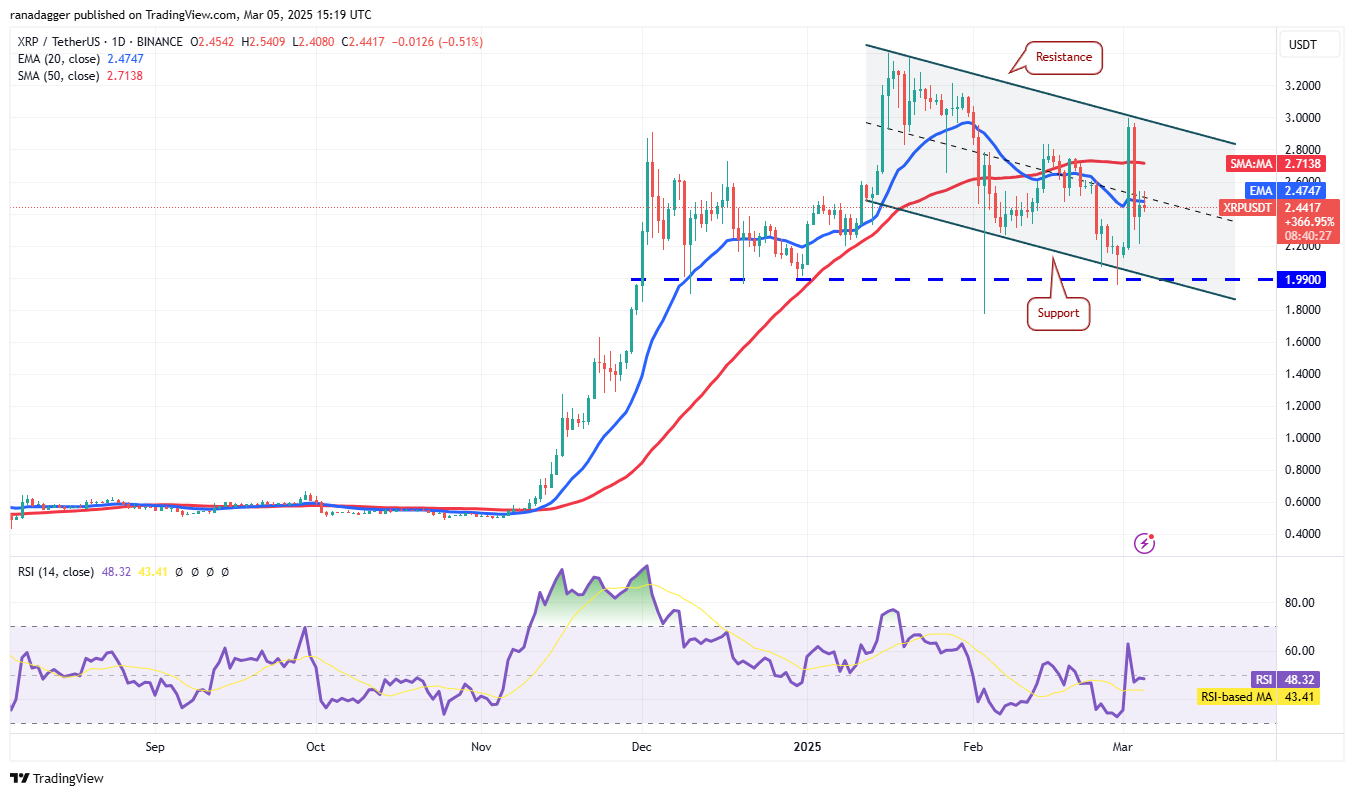
Both moving averages are flattening, and the RSI is near the midpoint, suggesting a balance between supply and demand. Holding above the 20-day EMA ($2.47) could propel the XRP/USDT pair towards the channel's resistance line. A break and close above the channel would signal a potential rally to $3.40.
両方の移動平均が平坦化されており、RSIは中間点に近く、需要と供給のバランスを示唆しています。 20日間のEMA(2.47ドル)の上に保持すると、XRP/USDTペアをチャネルの抵抗ラインに向けて推進する可能性があります。 チャンネルの上にブレークとクローズを閉じると、潜在的な集会が3.40ドルになります。
Conversely, a decline from the 20-day EMA, breaking below $2.53, would suggest bearish dominance. A break and close below $1.99 could accelerate selling, potentially leading to a drop to $1.27.
逆に、2.53ドルを下回る20日間のEMAからの減少は、弱気の支配を示唆しています。 ブレークと$ 1.99を下回ると、販売が加速し、1.27ドルに低下する可能性があります。
BNB Price Analysis
BNB価格分析
BNB (BNB) broke below the $557 support on March 4th, but the bears failed to sustain lower prices.
BNB(BNB)は3月4日に557ドルのサポートを下回りましたが、ベアーズは低価格を維持できませんでした。

Bulls are attempting a recovery, but this is likely to face selling pressure at the 20-day EMA ($619). A sharp decline from the 20-day EMA would indicate negative sentiment and selling on rallies, increasing the risk of a break below $546 and a potential drop to $500.
ブルズは回復を試みていますが、これは20日間のEMA(619ドル)で販売圧力に直面する可能性があります。 20日間のEMAからの急激な減少は、ネガティブな感情と集会での販売を示し、546ドルを下回る休憩のリスクを高め、500ドルになる可能性があります。
Conversely, a sustained move above the 50-day SMA ($646) would invalidate the bearish outlook, potentially leading to a rally to $686.
逆に、50日間のSMA($ 646)を超える持続的な動きは、弱気の見通しを無効にし、潜在的に686ドルの集会につながる可能性があります。
Solana Price Analysis
ソラナ価格分析
Strong buying at the $125 support level in Solana (SOL) is evident from the long lower wick on the March 4th candlestick.
Solana(SOL)の125ドルのサポートレベルでの強力な購入は、3月4日のろうそく足の長い低いウィックから明らかです。
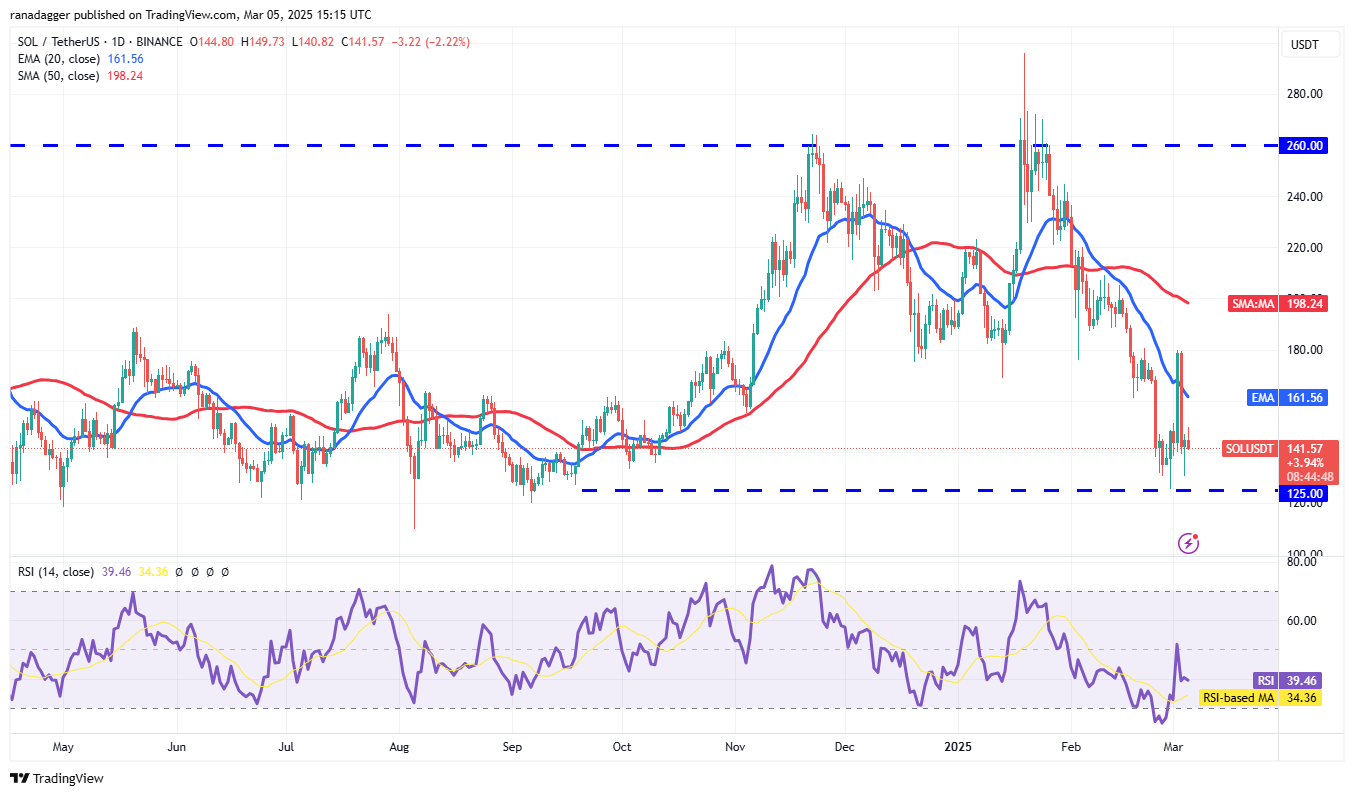
Minor resistance lies at $151. Breaking this level could push the SOL/USDT pair towards the 20-day EMA ($161). However, sellers are expected to defend the zone between the 20-day EMA and $180. A reversal from this zone could lead to sideways trading between $180 and $125.
軽度の抵抗は151ドルです。 このレベルを破ると、Sol/USDTペアが20日間のEMA(161ドル)に向かって押します。 ただし、売り手は20日間のEMAと180ドルの間のゾーンを守ることが期待されています。 このゾーンからの逆転は、180ドルから125ドルの間で横向きの取引につながる可能性があります。
A break below $125, however, would signal weakness, potentially leading to a decline to $110 and then $100.
ただし、125ドルを下回るブレークは、衰弱を示し、潜在的に110ドルに減少し、その後100ドルになります。
Cardano Price Analysis
カルダノ価格分析
Cardano (ADA) has experienced significant volatility recently, reflecting a struggle between bulls and bears.
カルダノ(ADA)は最近、雄牛とクマの間の闘争を反映して、かなりのボラティリティを経験しています。
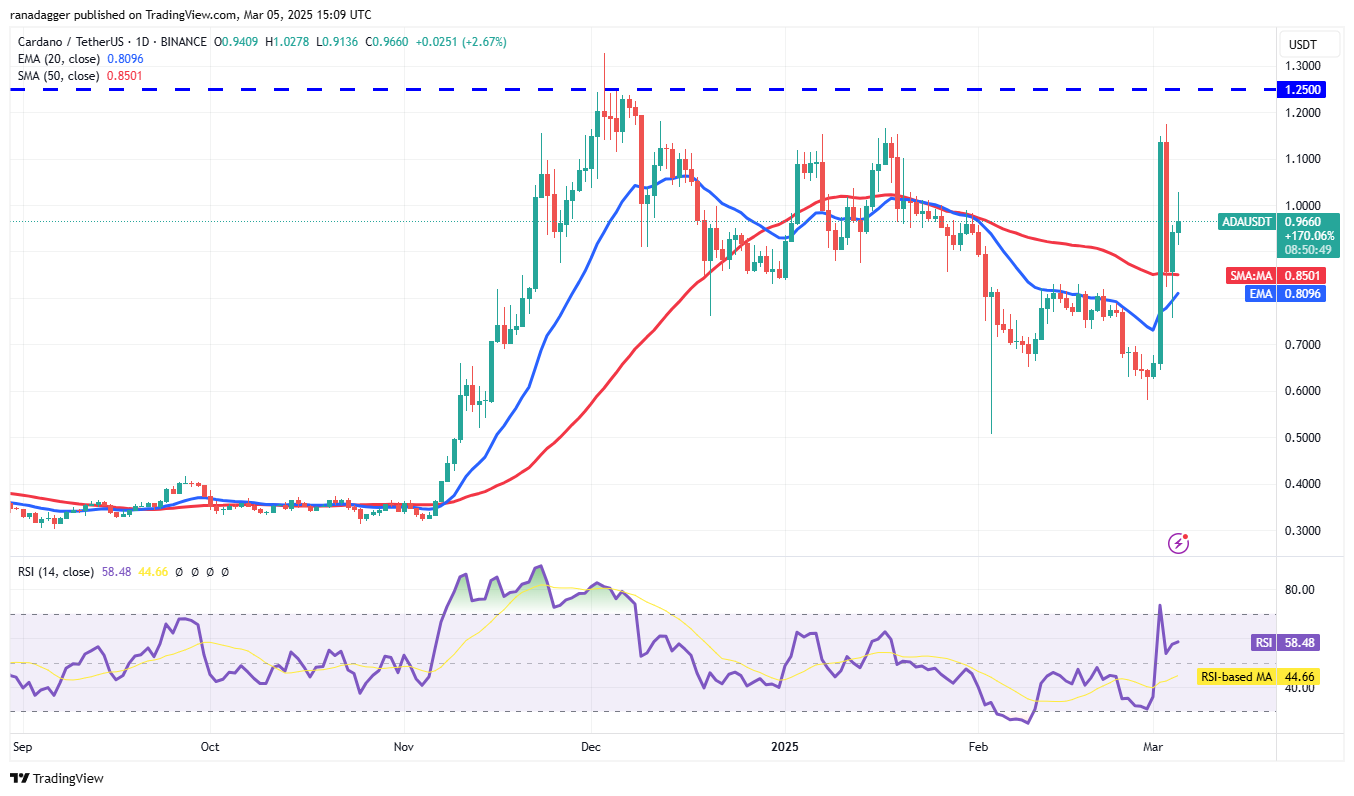
The ADA/USDT pair bounced off the 20-day EMA ($0.80) on March 4th, suggesting buying interest at lower levels. Holding above $1 could lead to another attempt to push the price to $1.25.
ADA/USDTペアは、3月4日に20日間のEMA($ 0.80)から跳ね返り、より低いレベルでの購入を示唆しています。 1ドルを超えると、価格を1.25ドルに押し上げる別の試みにつながる可能性があります。
High volatility often precedes range compression. Failure to hold above $1 would suggest selling on rallies, potentially confining the pair to a range between the 20-day EMA and $1.
多くの場合、高揮発性は範囲圧縮に先行します。 1ドルを超えることができないと、集会での販売が示唆され、ペアが20日間のEMAと1ドルの間の範囲に限定される可能性があります。
Dogecoin Price Analysis
Dogecoin価格分析
Dogecoin (DOGE) reversed from the 20-day EMA ($0.23) on March 3rd and broke below the support line.
Dogecoin(Doge)は、3月3日に20日間のEMA($ 0.23)から逆転し、サポートラインの下を壊しました。
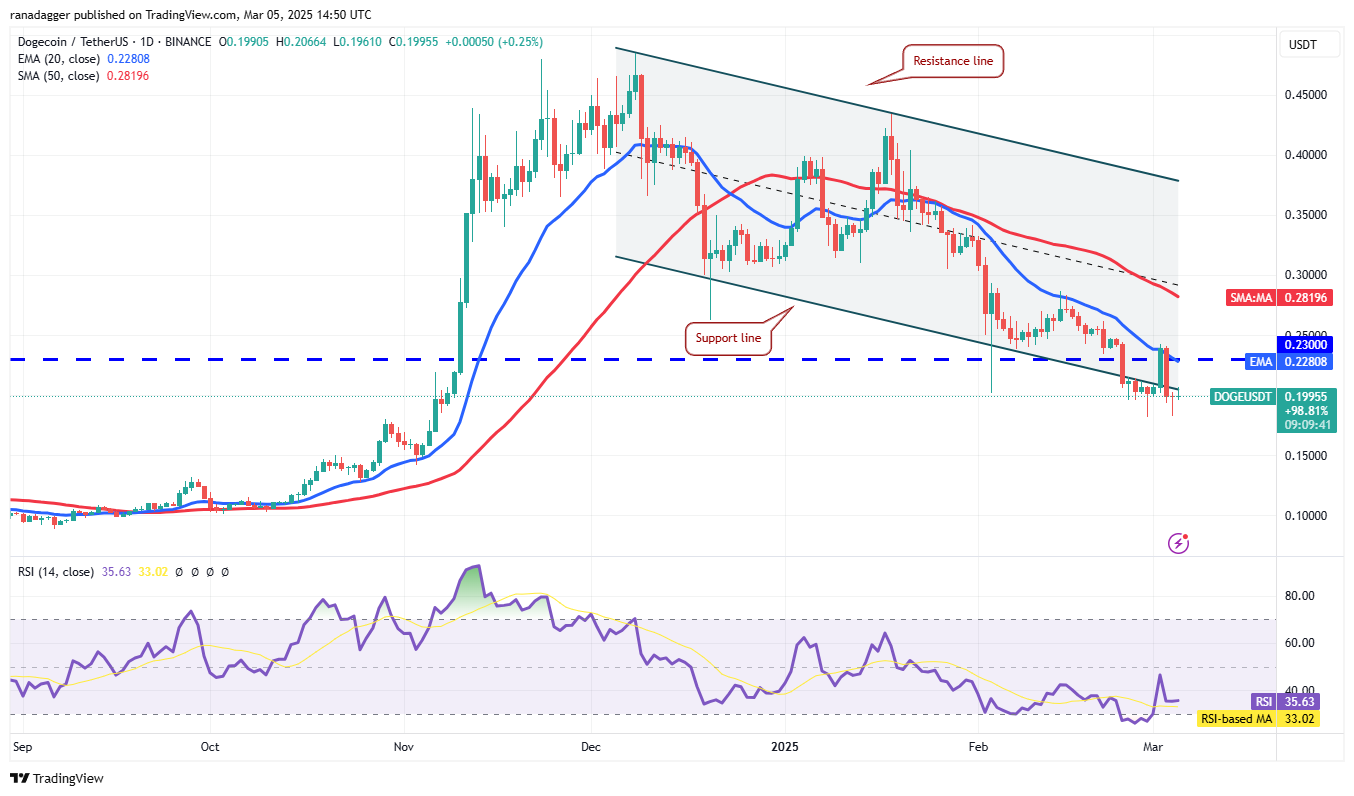
The bulls prevented a drop below the $0.18 support. A successful push and sustain above the 20-day EMA could indicate that the channel break was a bear trap, potentially leading to a rally to the 50-day SMA ($0.28).
ブルズは、0.18ドルのサポートを下回る低下を防ぎました。 20日間のEMAを超える成功したプッシュと維持は、チャンネルの破損がクマのtrapであることを示しており、50日間のSMA(0.28ドル)への集会につながる可能性があります。
Conversely, a break and close below $0.18 could trigger further declines to $0.14 and eventually to the $0.10 support level.
逆に、$ 0.18を下回るブレークとクローズは、さらに0.14ドルに減少し、最終的には0.10ドルのサポートレベルに引き起こされる可能性があります。
Pi Price Analysis
PI価格分析
Pi (PI) experienced a significant rally from $0.10 on February 20th to $3 on February 26th, showcasing strong buying pressure.
PI(PI)は、2月20日の0.10ドルから2月26日に3ドルに大きな集会を経験し、強い購入圧力を示しました。
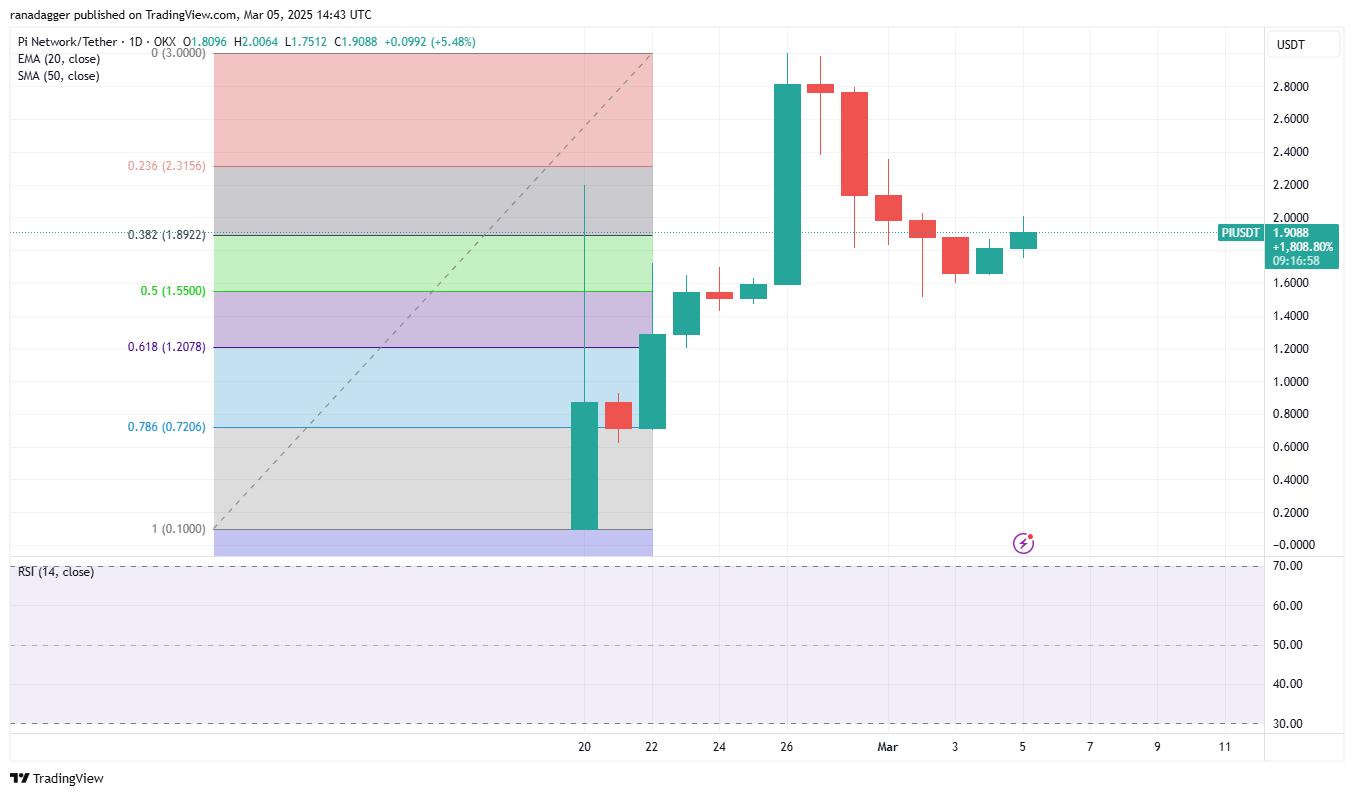
Profit-taking subsequently pulled the price down, with the PI/USDT pair finding support at the 50% Fibonacci retracement level of $1.55. A recovery attempt is anticipated towards $2.38 and then $2.80. A break and close above $3 would signal a resumption of the uptrend towards $4.45.
その後、利益を上げると価格が引き下げられ、PI/USDTペアが1.55ドルの50%Fibonacciリトレースメントレベルでサポートを見つけました。 回復の試みは2.38ドル、その後2.80ドルになると予想されます。 休憩と$ 3を超えると、上昇トレンドの再開が4.45ドルになることを示しています。
However, bears may attempt to push the price below the $1.55 support, potentially leading to a drop to the 61.8% retracement level of $1.20.
ただし、ベアーズは価格を1.55ドル以下のサポートを下回ろうとする可能性があり、潜在的に61.8%のリトレースメントレベル1.20ドルに低下することになります。
Hedera Price Analysis
ヘデラ価格分析
Hedera (HBAR) has traded between moving averages for the past three days, indicating indecision.
Hedera(HBAR)は、過去3日間の移動平均の間で取引されており、優柔不断を示しています。
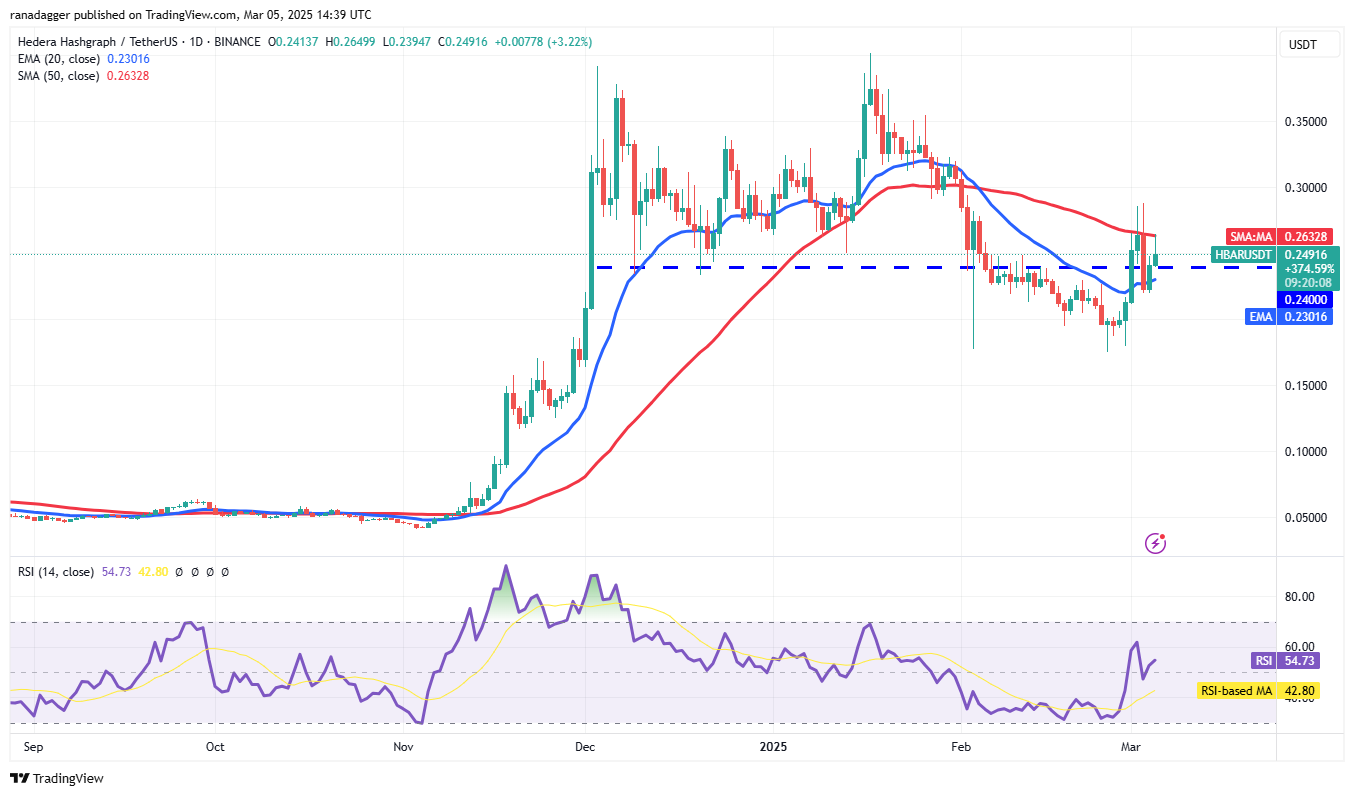
The 20-day EMA ($0.23) is showing signs of upward movement, and the RSI is slightly above the midpoint, suggesting a minor bullish advantage. A break and close above the 50-day SMA ($0.26) could initiate a rally to $0.32 and potentially $0.35.
20日間のEMA(0.23ドル)は上向きの動きの兆候を示しており、RSIは中間点をわずかに上回っており、軽度の強気の利点を示唆しています。 50日間のSMA(0.26ドル)を超えるブレークとクローズは、ラリーを0.32ドル、潜在的に0.35ドルに開始する可能性があります。
Conversely, a break and close below $0.22 would suggest bearish control, potentially leading to a drop to $0.17, a key support level.
逆に、$ 0.22を下回るブレークとクローズは、ひげの制御を示唆し、主要なサポートレベルである0.17ドルに低下する可能性があります。
Chainlink Price Analysis
チェーンリンク価格分析
Chainlink (LINK) fell below the support line of its descending channel on March 4th, but buying at lower levels is evident in the long lower wick of the candlestick.
ChainLink(リンク)は3月4日に下降チャネルのサポートラインの下に落ちましたが、低いレベルでの購入は、ろうそく足の長い芯で明らかです。
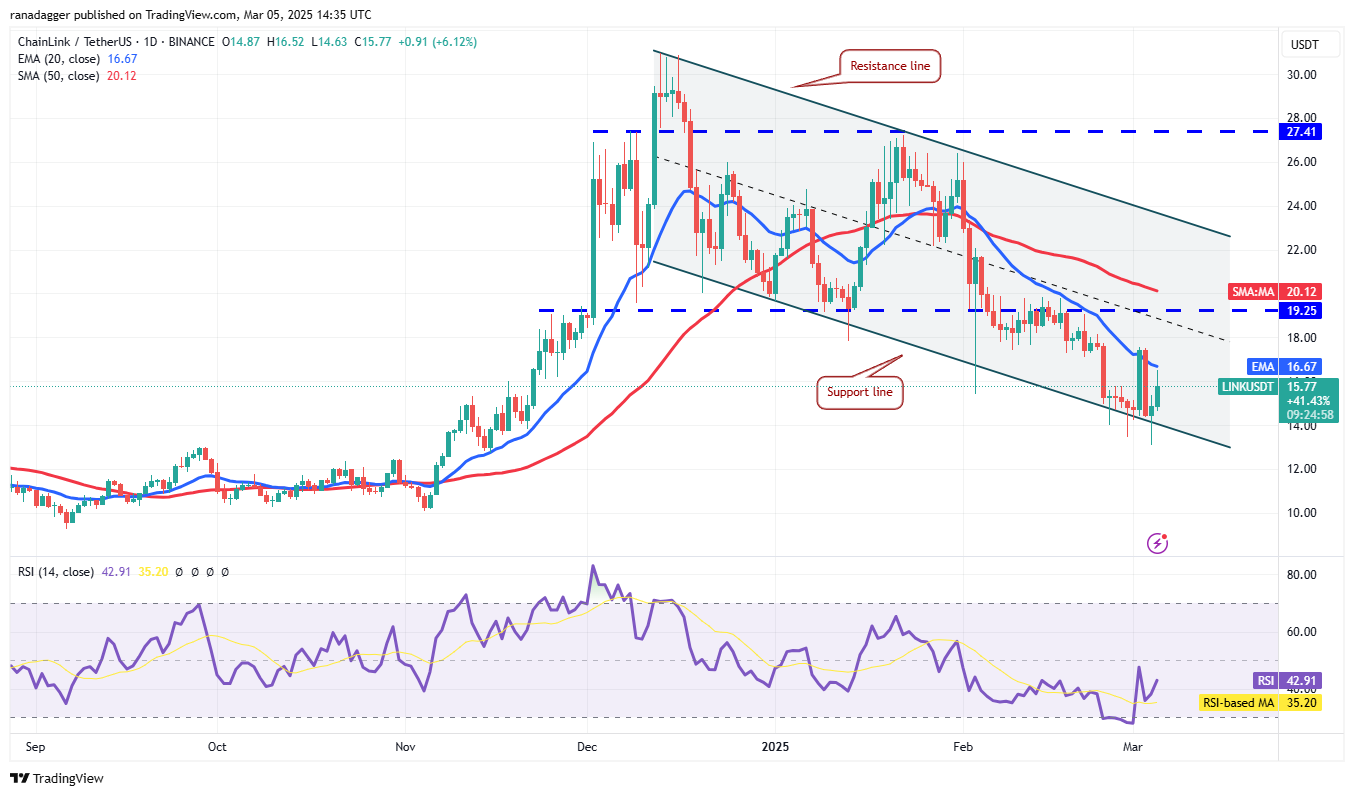
Bulls need to push and maintain the price above the 20-day EMA ($16.67) to reduce selling pressure. This could lead to a rise towards the 50-day SMA ($20.12), a likely strong resistance level.
ブルズは、販売圧力を減らすために、20日間のEMA(16.67ドル)を超える価格をプッシュおよび維持する必要があります。 これにより、50日間のSMA(20.12ドル)に向かって上昇する可能性があります。これは、抵抗レベルが強い可能性があります。
Conversely, a decline from the current level and a close below the support line would signal continued bearish control, potentially accelerating selling below $13.08 and pushing the pair towards $10.
逆に、現在のレベルからの減少とサポートラインの下に近いと、継続的な弱気制御が示され、13.08ドルを下回る販売を加速し、ペアを10ドルに押し進める可能性があります。
Disclaimer: This article does not provide financial advice. All investment and trading decisions involve risk, and readers should conduct their own thorough research before making any investment choices.
免責事項:この記事では、財政的なアドバイスは提供されていません。 すべての投資と取引の決定にはリスクが含まれ、読者は投資を選択する前に独自の徹底的な調査を行う必要があります。
 The Coin Republic
 BlockchainReporter
 TheCoinrise Media
 BlockchainReporter
 DogeHome
 CFN
CFN Cointelegraph
 CFN
CFN


