

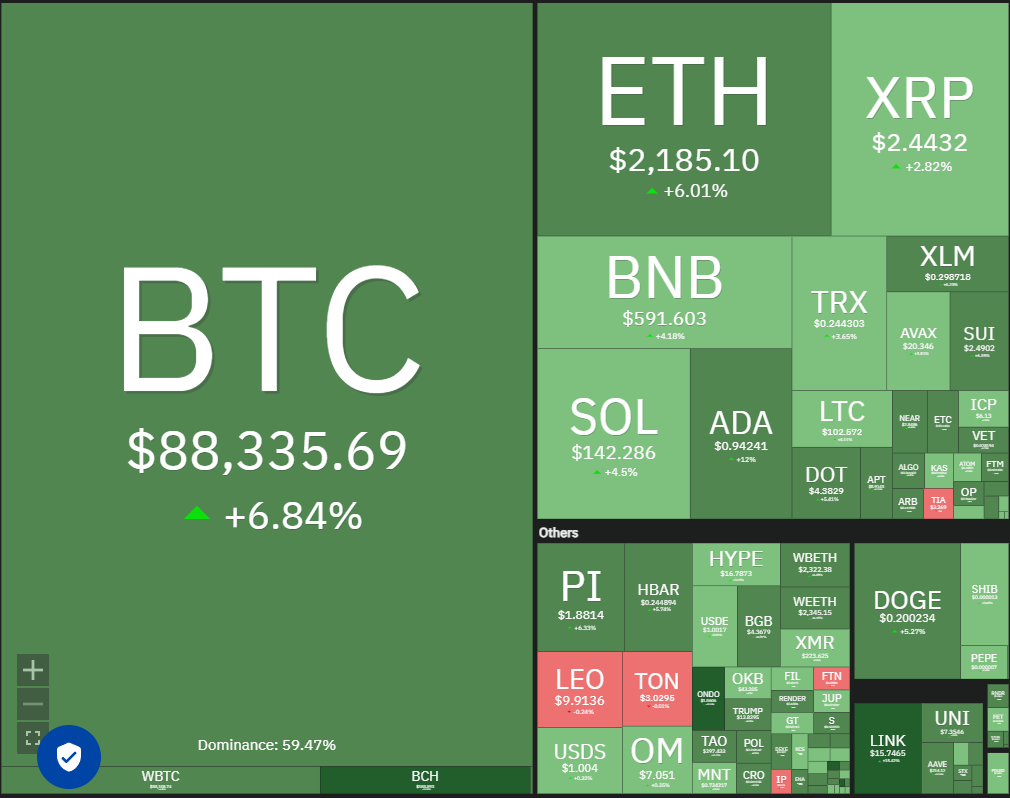
Bitcoin (BTC) rallied from $81,500 on March 4th, with bulls attempting to push the price above $90,000 on March 5th. However, some analysts remain cautious about Bitcoin's short-term prospects. A March 3rd Bitfinex market report suggested Bitcoin might encounter "significant resistance" at $94,000.
Bitcoin (BTC)은 3 월 4 일 81,500 달러에서 3 월 5 일에 90,000 달러 이상을 추진하려고 시도했습니다. 그러나 일부 분석가들은 Bitcoin의 단기 전망에 대해 신중합니다. 3 월 3 일 Bitfinex Market 보고서에 따르면 Bitcoin은 94,000 달러의 "상당한 저항"이 발생할 수 있다고 제안했습니다.
Further caution was voiced by CryptoQuant contributor XBTManager, who in a Quicktake post predicted continued Bitcoin consolidation. Therefore, risky trades should be avoided in the coming months. The analyst indicated a favorable buying opportunity would arise when short-term holders (those holding less than 155 days) begin selling, and long-term holders start accumulating.
Cryptoquant 기고자 XBTManager는 추가주의를 기울였으며, Quicktake Post에서 지속적인 비트 코인 통합을 예측했습니다. 따라서 앞으로 몇 달 안에 위험한 거래를 피해야합니다. 애널리스트는 단기 소지자 (155 일 미만의 사람들)가 판매를 시작하고 장기 보유자가 축적되기 시작할 때 유리한 구매 기회가 발생했다고 밝혔다.
Despite near-term price uncertainty, investor confidence in Bitcoin's long-term potential remains strong. Mexican billionaire Ricardo Salinas, in a Bloomberg interview, revealed that 70% of his investment portfolio is allocated to Bitcoin-related assets, with the remaining 30% in gold and gold mining companies.
단기 가격 불확실성에도 불구하고 Bitcoin의 장기 잠재력에 대한 투자자의 신뢰는 여전히 강력합니다. 블룸버그 인터뷰에서 멕시코 억만 장자 리카르도 살리나스 (Ricardo Salinas)는 투자 포트폴리오의 70%가 비트 코인 관련 자산에 할당되었으며 나머지는 금 및 금 채굴 회사에서 30%를 할당한다고 밝혔다.
This analysis examines critical support and resistance levels for Bitcoin and other leading cryptocurrencies.
이 분석은 비트 코인 및 기타 주요 암호 화폐의 중요한 지원 및 저항 수준을 검사합니다.
Bitcoin Price Analysis
비트 코인 가격 분석
Bitcoin appears to be forming a symmetrical triangle pattern, suggesting indecision between buyers and sellers.
비트 코인은 대칭 삼각형 패턴을 형성하여 구매자와 판매자 간의 불확실성을 시사합니다.
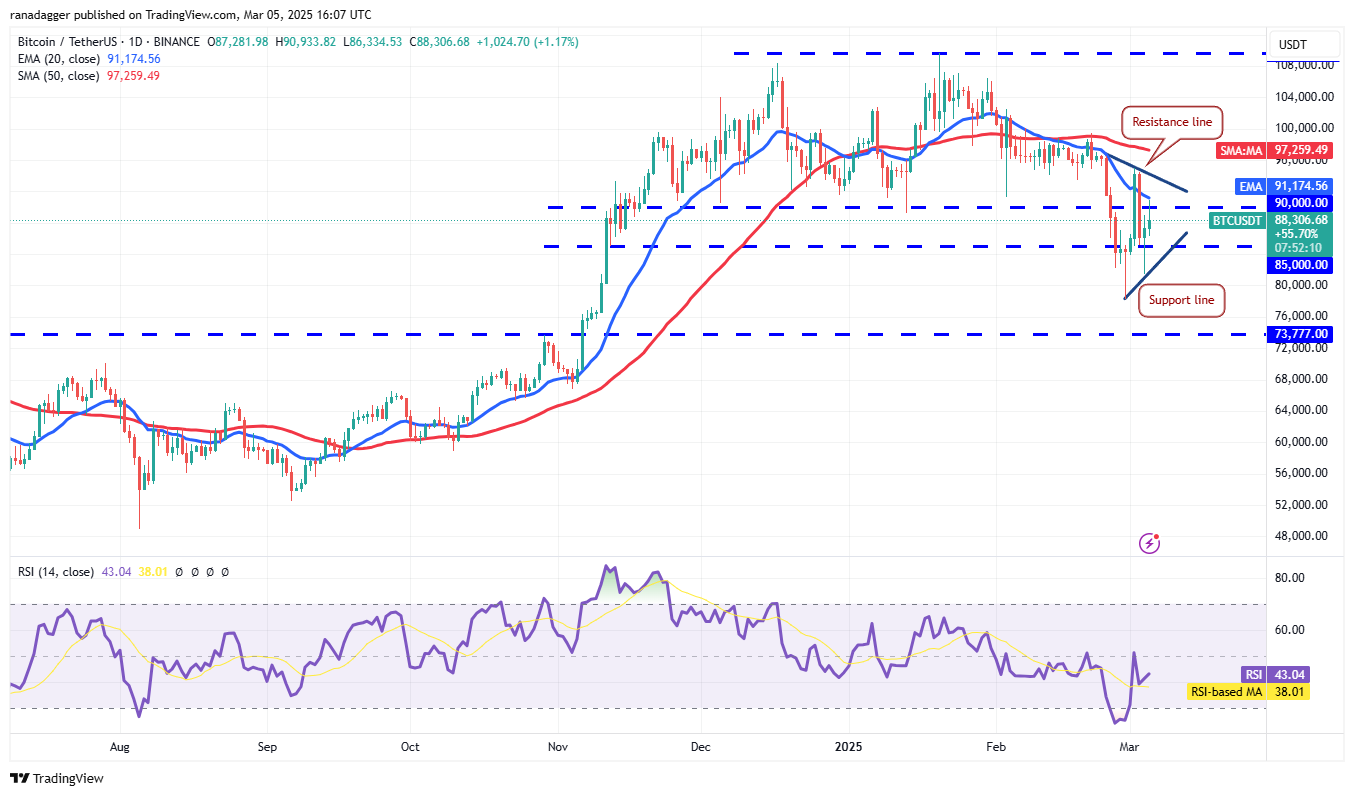
The BTC/USDT pair reached the 20-day exponential moving average ($91,174), a key resistance level. A decisive break above this EMA would signal reduced selling pressure, potentially leading to a push above the triangle's resistance line and towards the 50-day simple moving average ($97,259). A close above the 50-day SMA would confirm bullish momentum.
BTC/USDT 쌍은 주요 저항 수준 인 20 일 지수 이동 평균 ($ 91,174)에 도달했습니다. 이 EMA 위의 결정적인 휴식은 판매 압력 감소를 알리며, 잠재적으로 삼각형의 저항 라인 위의 50 일 간단한 이동 평균 ($ 97,259)을 향해 푸시를 일으킬 수 있습니다. 50 일간의 SMA 이상은 강세의 추진력을 확인할 것입니다.
Conversely, a sharp decline from the 20-day EMA, breaking below the triangle pattern, would negate this optimistic outlook. This could trigger a retest of the February 28th intraday low of $78,258.
반대로, 삼각형 패턴 아래로 나뉘어 진 20 일 EMA의 급격한 감소는이 낙관적 전망을 무효화 할 것입니다. 이로 인해 2 월 28 일은 78,258 달러의 최저치가 다시 시작될 수 있습니다.
Ether Price Analysis
에테르 가격 분석
Ether (ETH) dipped below $2,000 on March 4th, but strong buying at lower levels, evident in the long lower wick of the candlestick, suggests bullish support.
에테르 (ETH)는 3 월 4 일에 2,000 달러 이하로 떨어졌지만 촛대의 길고 하위 심지에서 분명한 낮은 수준에서 강력한 구매는 강세의지지를 시사합니다.
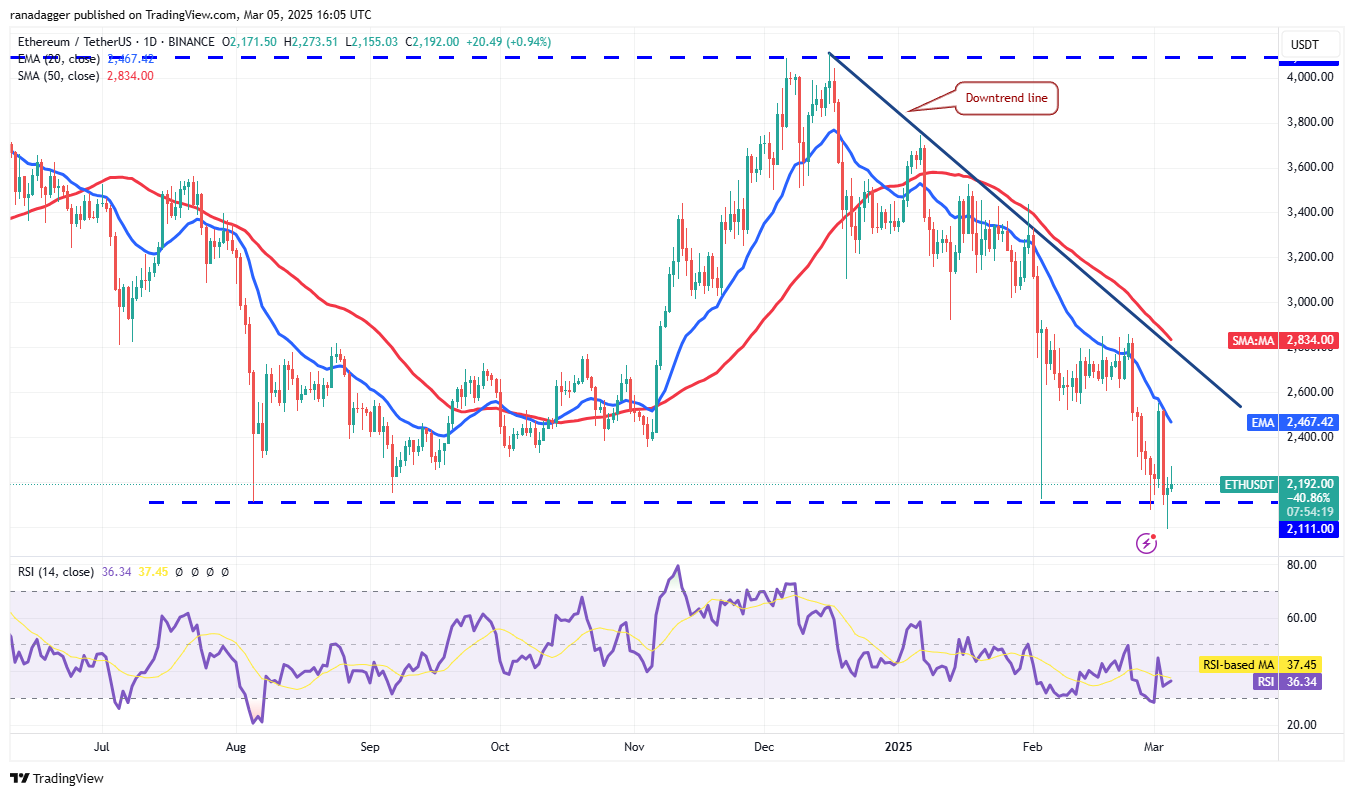
However, the recovery faces resistance at the 20-day EMA ($2,467) and the downtrend line. A reversal from these resistance levels could push the ETH/USDT pair back below $2,111, potentially leading to a drop to $1,750.
그러나 회복은 20 일 EMA ($ 2,467)와 다운 트렌드 라인에서 저항에 직면 해 있습니다. 이러한 저항 수준의 반전은 ETH/USDT 쌍을 $ 2,111 미만으로 밀어 올릴 수있어 잠재적으로 $ 1,750로 떨어질 수 있습니다.
A close above the downtrend line would signal weakening bearish pressure, potentially paving the way for a rally towards $3,400.
다운 트렌드 라인 위의 가까운 곳은 약세 약세 압력을 알리고 잠재적으로 3,400 달러로 집회의 길을 열어 줄 수 있습니다.
XRP Price Analysis
XRP 가격 분석
XRP (XRP) has been trading within a descending channel for several days, indicating a range-bound market with buying near support and selling near resistance.
XRP (XRP)는 며칠 동안 내림차순 채널 내에서 거래를 해왔으며, 거의 지원을 구매하고 거의 저항을 판매하는 범위 바운드 시장을 나타냅니다.
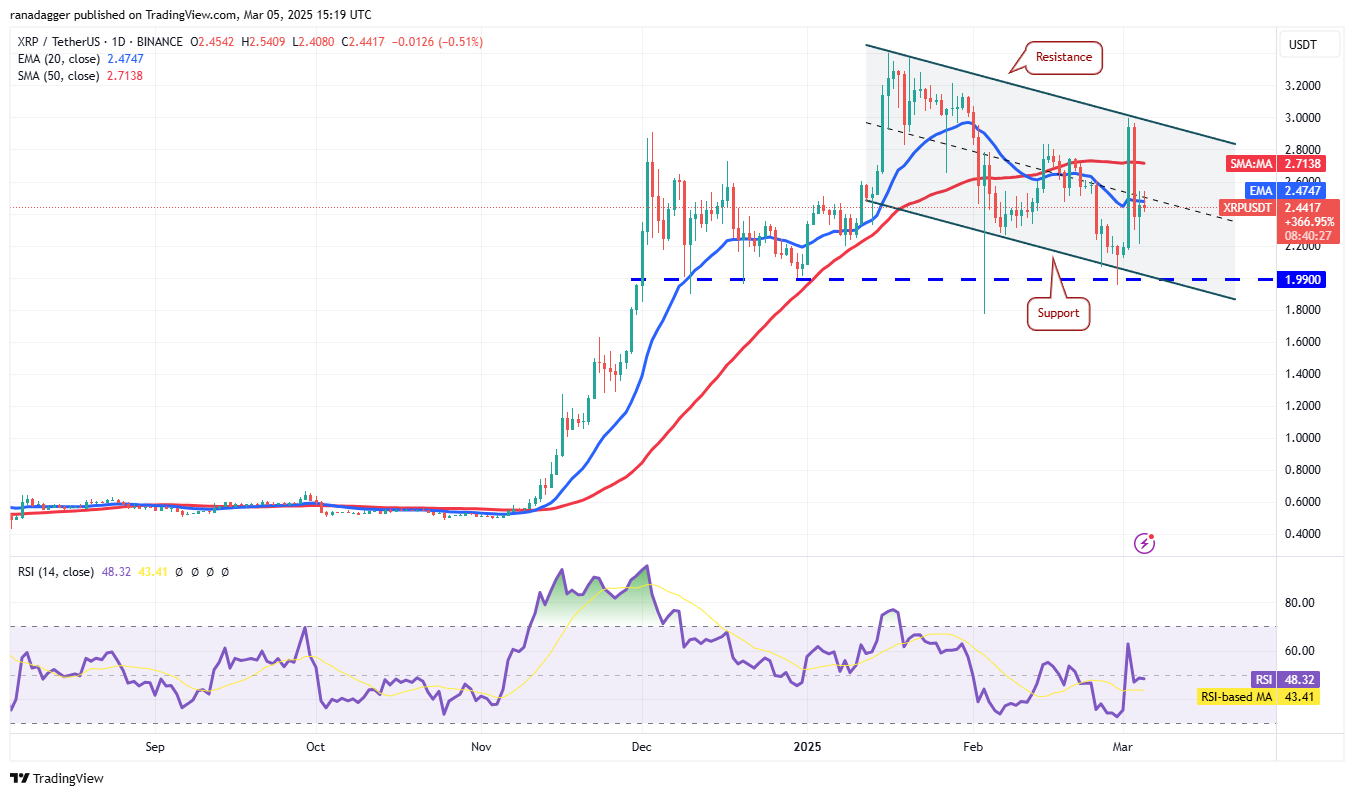
Both moving averages are flattening, and the RSI is near the midpoint, suggesting a balance between supply and demand. Holding above the 20-day EMA ($2.47) could propel the XRP/USDT pair towards the channel's resistance line. A break and close above the channel would signal a potential rally to $3.40.
이동 평균은 모두 평평하고 RSI는 중간 점에 가까워서 수요와 수요 사이의 균형을 시사합니다. 20 일 EMA ($ 2.47)를 유지하면 XRP/USDT 쌍이 채널의 저항 라인을 향해 추진할 수 있습니다. 채널 위의 휴식과 마감은 잠재적 랠리를 $ 3.40으로 신호합니다.
Conversely, a decline from the 20-day EMA, breaking below $2.53, would suggest bearish dominance. A break and close below $1.99 could accelerate selling, potentially leading to a drop to $1.27.
반대로, $ 2.53 미만으로 20 일 동안 EMA의 감소는 약세의 지배력을 암시 할 것입니다. 1.99 달러 이하의 휴식과 마감은 판매를 가속화 할 수있어 잠재적으로 $ 1.27로 떨어질 수 있습니다.
BNB Price Analysis
BNB 가격 분석
BNB (BNB) broke below the $557 support on March 4th, but the bears failed to sustain lower prices.
BNB (BNB)는 3 월 4 일에 557 달러의 지원보다 낮았지만 곰은 더 낮은 가격을 유지하지 못했습니다.

Bulls are attempting a recovery, but this is likely to face selling pressure at the 20-day EMA ($619). A sharp decline from the 20-day EMA would indicate negative sentiment and selling on rallies, increasing the risk of a break below $546 and a potential drop to $500.
황소는 회복을 시도하고 있지만 20 일 EMA (619 달러)에서 압력을 판매 할 가능성이 높습니다. 20 일 EMA의 급격한 감소는 부정적인 감정과 집회에 판매되는 것을 나타내며, 546 달러 미만의 휴식의 위험이 증가하고 잠재적 인 하락은 $ 500으로 증가 할 것입니다.
Conversely, a sustained move above the 50-day SMA ($646) would invalidate the bearish outlook, potentially leading to a rally to $686.
반대로, 50 일 SMA (646 달러)를 넘어 지속적인 움직임은 약세 전망을 무효화하여 잠재적으로 686 달러로 이어질 것입니다.
Solana Price Analysis
Solana 가격 분석
Strong buying at the $125 support level in Solana (SOL) is evident from the long lower wick on the March 4th candlestick.
Solana (Sol)의 $ 125 지원 수준에서 강력한 구매는 3 월 4 일 촛대의 Long Lower Wick에서 분명합니다.
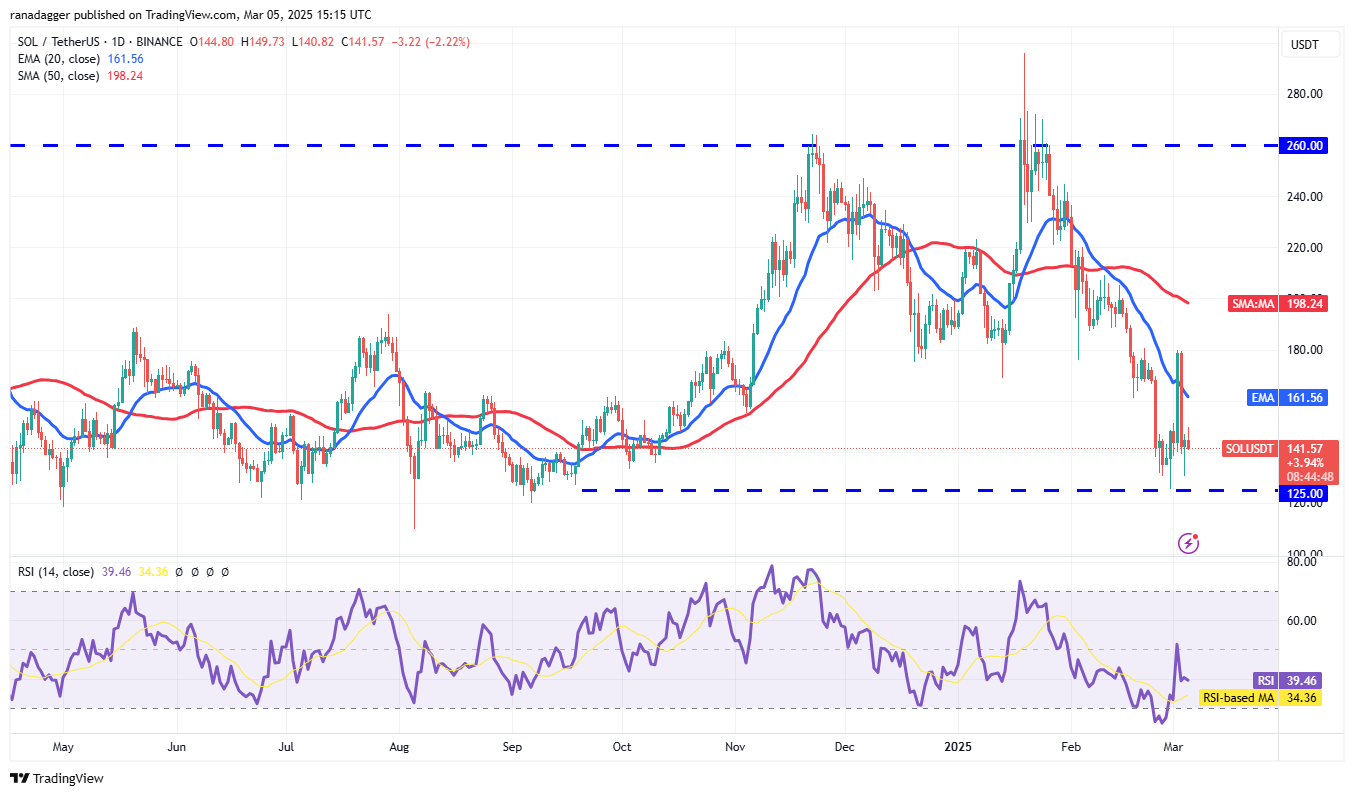
Minor resistance lies at $151. Breaking this level could push the SOL/USDT pair towards the 20-day EMA ($161). However, sellers are expected to defend the zone between the 20-day EMA and $180. A reversal from this zone could lead to sideways trading between $180 and $125.
경미한 저항은 $ 151에 있습니다. 이 수준을 깨뜨리면 SOL/USDT 쌍이 20 일 EMA ($ 161)를 향해 밀어 넣을 수 있습니다. 그러나 판매자는 20 일 EMA와 $ 180 사이의 구역을 방어 할 것으로 예상됩니다. 이 구역의 반전은 $ 180에서 $ 125 사이의 옆으로 거래 될 수 있습니다.
A break below $125, however, would signal weakness, potentially leading to a decline to $110 and then $100.
그러나 $ 125 미만의 휴식은 약점을 알리면 잠재적으로 $ 110, $ 100로 감소 할 수 있습니다.
Cardano Price Analysis
Cardano 가격 분석
Cardano (ADA) has experienced significant volatility recently, reflecting a struggle between bulls and bears.
Cardano (ADA)는 최근 황소와 곰 사이의 투쟁을 반영하여 상당한 변동성을 경험했습니다.
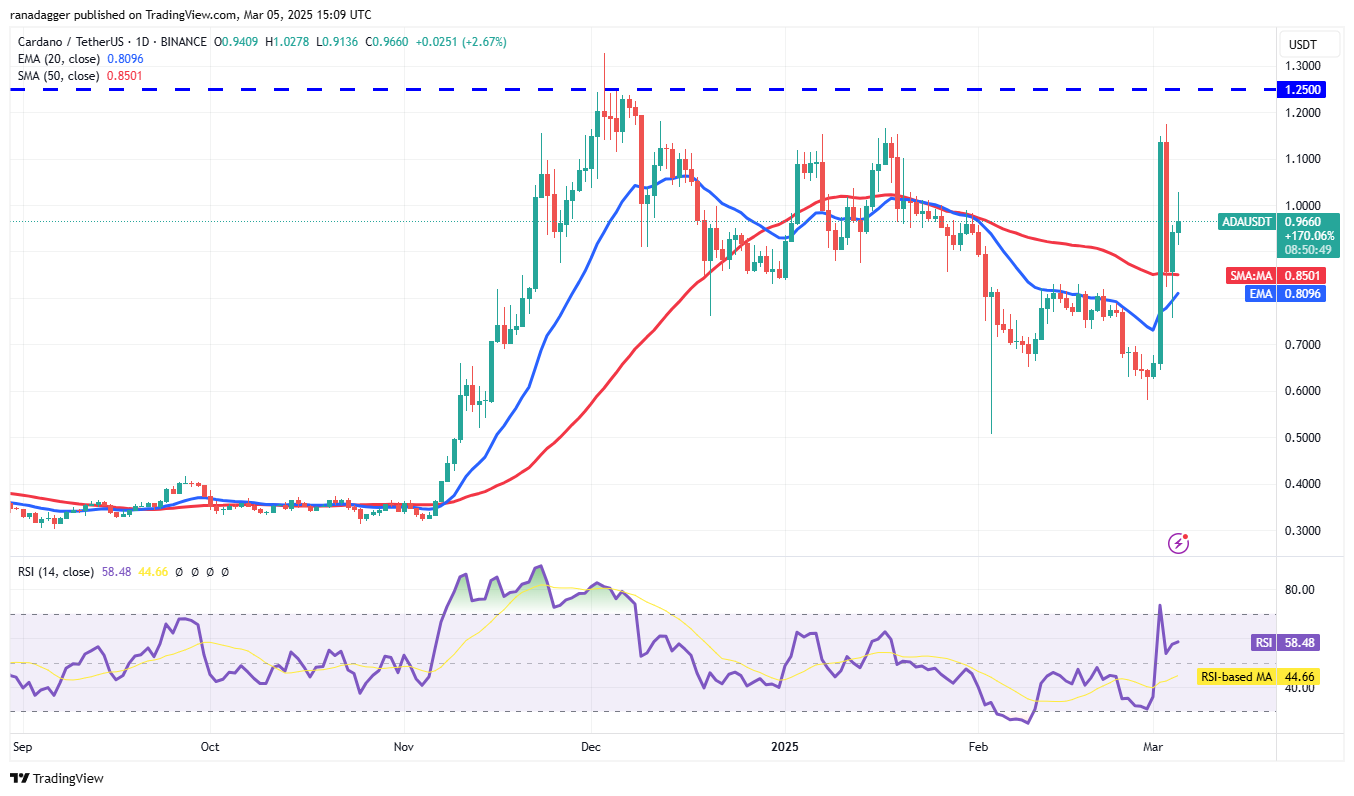
The ADA/USDT pair bounced off the 20-day EMA ($0.80) on March 4th, suggesting buying interest at lower levels. Holding above $1 could lead to another attempt to push the price to $1.25.
ADA/USDT 쌍은 3 월 4 일에 20 일 EMA ($ 0.80)에서 튀어 나와서 더 낮은 수준의 구매 지분을 제안했습니다. 1 달러 이상을 보유하면 가격을 $ 1.25로 추진하려는 또 다른 시도로 이어질 수 있습니다.
High volatility often precedes range compression. Failure to hold above $1 would suggest selling on rallies, potentially confining the pair to a range between the 20-day EMA and $1.
높은 변동성은 종종 범위 압축보다 우선합니다. 1 달러 이상을 유지하지 못하면 집회에 판매를 제안 할 것이며, 잠재적으로 쌍을 20 일 EMA와 $ 1 사이의 범위로 제한 할 수 있습니다.
Dogecoin Price Analysis
Dogecoin 가격 분석
Dogecoin (DOGE) reversed from the 20-day EMA ($0.23) on March 3rd and broke below the support line.
Dogecoin (Doge)은 3 월 3 일에 20 일 EMA ($ 0.23)에서 반전되어 지원 라인 아래에서 파산했습니다.
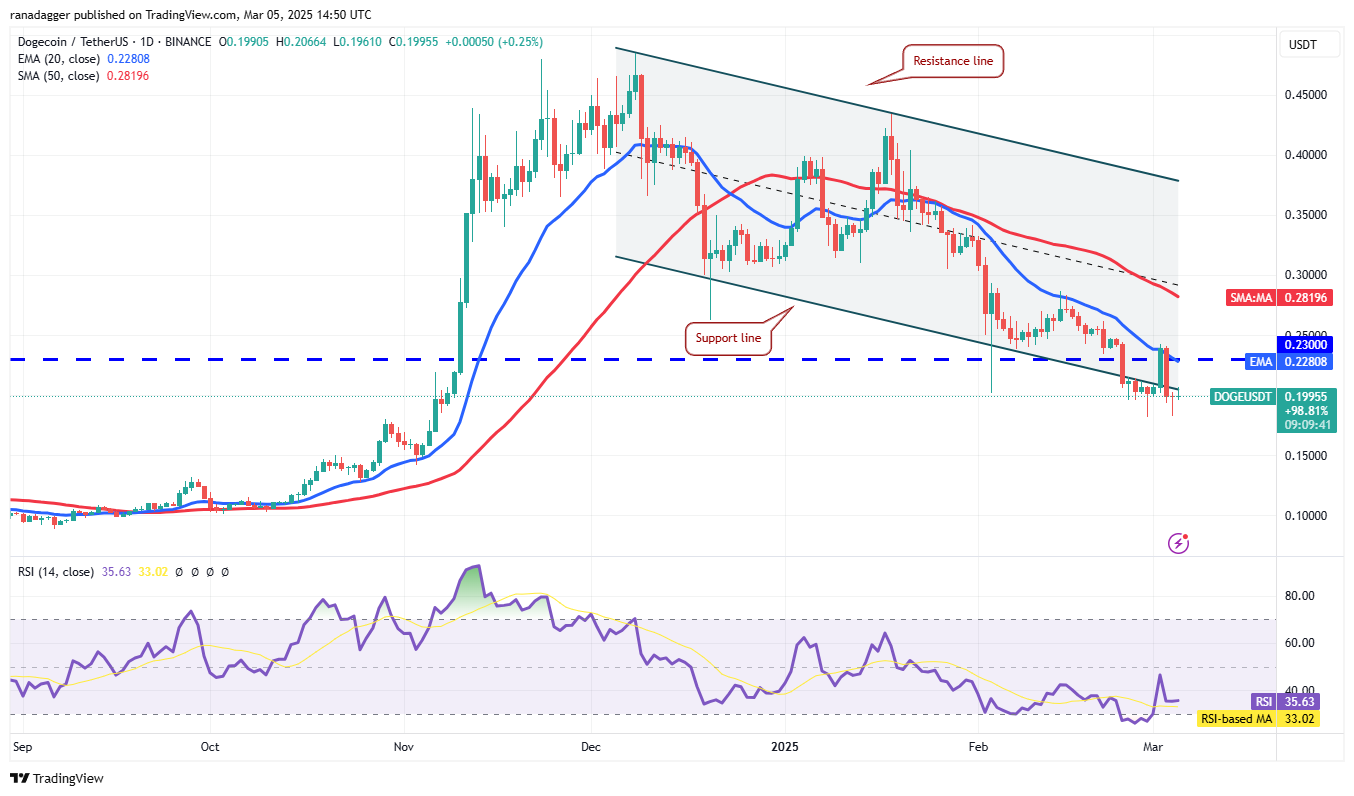
The bulls prevented a drop below the $0.18 support. A successful push and sustain above the 20-day EMA could indicate that the channel break was a bear trap, potentially leading to a rally to the 50-day SMA ($0.28).
Bulls는 $ 0.18의 지원 이하의 하락을 막았습니다. 20 일 이상의 EMA 이상의 성공적인 추진과 지속은 채널 브레이크가 곰 함정임을 나타낼 수 있으며, 잠재적으로 50 일 SMA ($ 0.28)로 랠리로 이어질 수 있습니다.
Conversely, a break and close below $0.18 could trigger further declines to $0.14 and eventually to the $0.10 support level.
반대로, $ 0.18 미만의 휴식과 마감은 추가 하락을 $ 0.14로, 결국 $ 0.10 지원 수준으로 촉발 될 수 있습니다.
Pi Price Analysis
PI 가격 분석
Pi (PI) experienced a significant rally from $0.10 on February 20th to $3 on February 26th, showcasing strong buying pressure.
PI (PI)는 2 월 20 일 $ 0.10에서 2 월 26 일에 3 달러에서 3 달러에서 상당한 랠리를 경험하여 강력한 구매 압력을 보여주었습니다.
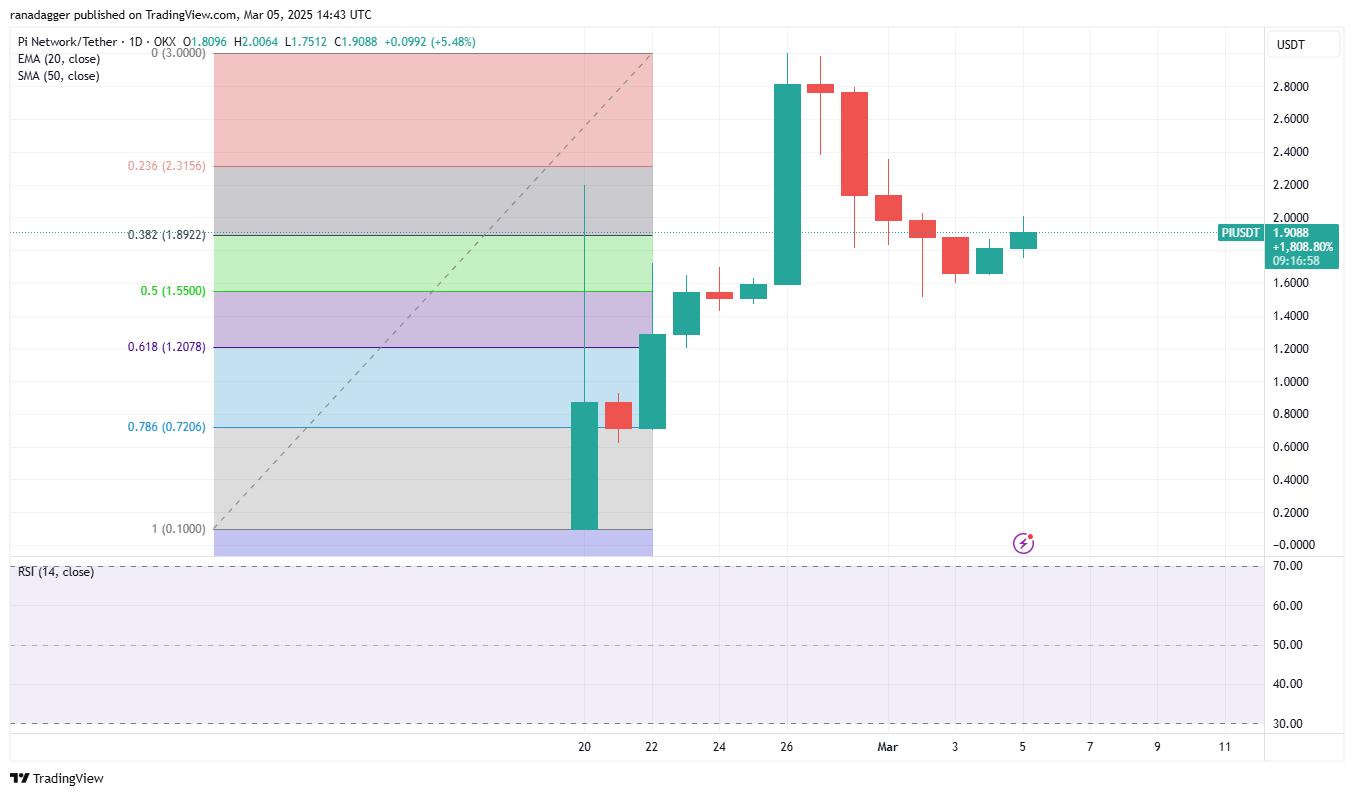
Profit-taking subsequently pulled the price down, with the PI/USDT pair finding support at the 50% Fibonacci retracement level of $1.55. A recovery attempt is anticipated towards $2.38 and then $2.80. A break and close above $3 would signal a resumption of the uptrend towards $4.45.
이익을 얻는 것은 PI/USDT 쌍이 50% Fibonacci retression 수준에서 $ 1.55에서 지원을 찾는 데 가격을 낮췄습니다. 회복 시도는 $ 2.38, 그 다음 $ 2.80에 예상됩니다. 3 달러 이상의 휴식과 마감은 상승 추세의 재개를 $ 4.45로 신호 할 것입니다.
However, bears may attempt to push the price below the $1.55 support, potentially leading to a drop to the 61.8% retracement level of $1.20.
그러나 곰은 1.55 달러의 지원 이하로 가격을 추진하려고 시도하여 잠재적으로 $ 1.20의 61.8% 후원 수준으로 감소 할 수 있습니다.
Hedera Price Analysis
Hedera 가격 분석
Hedera (HBAR) has traded between moving averages for the past three days, indicating indecision.
HEDERA (HBAR)는 지난 3 일 동안 이동 평균 사이에 거래를했으며 불확실성을 나타냅니다.
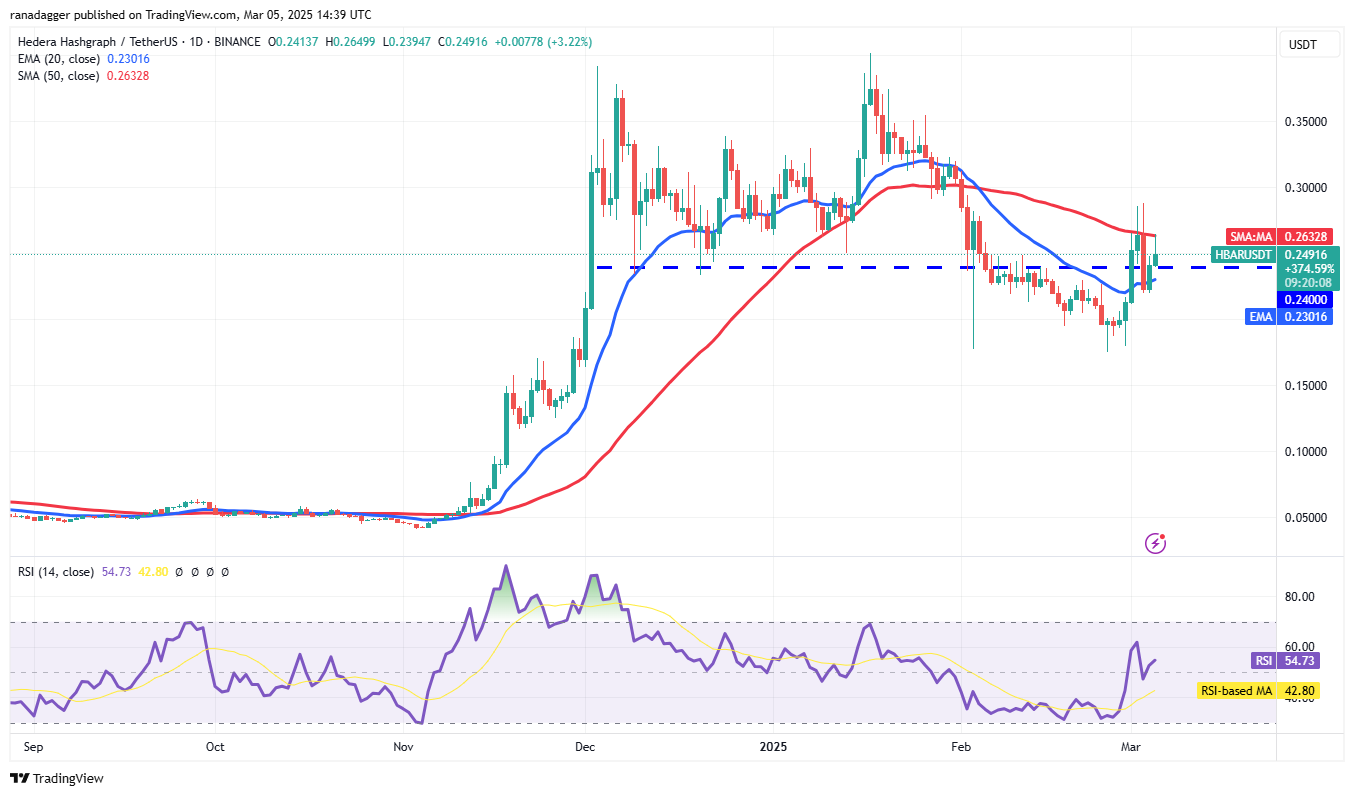
The 20-day EMA ($0.23) is showing signs of upward movement, and the RSI is slightly above the midpoint, suggesting a minor bullish advantage. A break and close above the 50-day SMA ($0.26) could initiate a rally to $0.32 and potentially $0.35.
20 일 EMA ($ 0.23)는 상향 운동의 징후를 보이고 있으며 RSI는 중간 점보다 약간 높으며 경미한 낙관적 이점을 나타냅니다. 50 일 SMA ($ 0.26) 이상의 휴식과 마감은 랠리를 $ 0.32로, 잠재적으로 $ 0.35로 시작할 수 있습니다.
Conversely, a break and close below $0.22 would suggest bearish control, potentially leading to a drop to $0.17, a key support level.
반대로, $ 0.22 미만의 휴식과 마감은 약세 통제를 제안 할 것이며, 잠재적으로 주요 지원 수준 인 $ 0.17로 떨어질 수 있습니다.
Chainlink Price Analysis
체인 링크 가격 분석
Chainlink (LINK) fell below the support line of its descending channel on March 4th, but buying at lower levels is evident in the long lower wick of the candlestick.
ChainLink (링크)는 3 월 4 일에 하강 채널의 지원 라인 아래로 떨어졌지만 촛대의 길고 더 낮은 심지에서 더 낮은 수준에서 구매하는 것이 분명합니다.
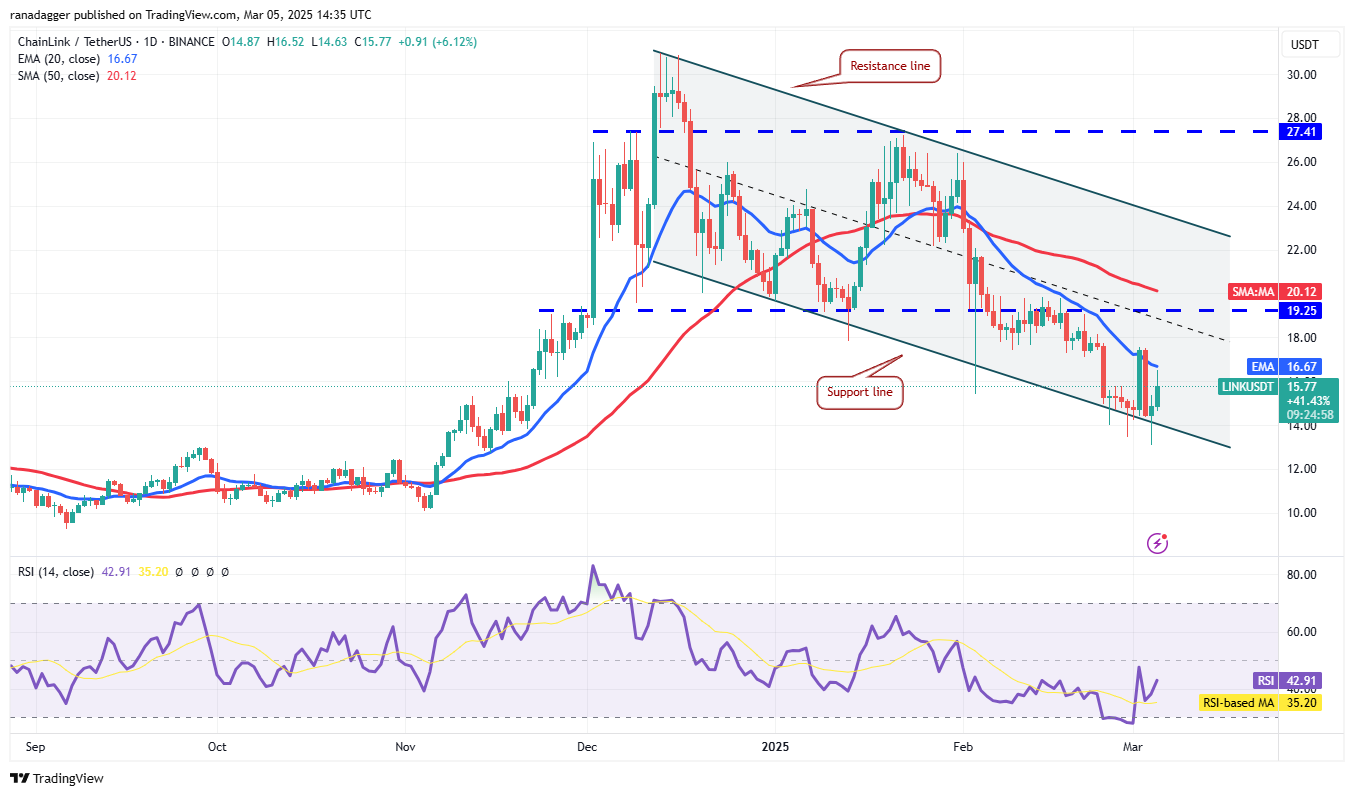
Bulls need to push and maintain the price above the 20-day EMA ($16.67) to reduce selling pressure. This could lead to a rise towards the 50-day SMA ($20.12), a likely strong resistance level.
황소는 판매 압력을 줄이기 위해 20 일 EMA ($ 16.67) 이상의 가격을 밀고 유지해야합니다. 이로 인해 50 일 SMA ($ 20.12)로 강한 저항 수준이 높아질 수 있습니다.
Conversely, a decline from the current level and a close below the support line would signal continued bearish control, potentially accelerating selling below $13.08 and pushing the pair towards $10.
반대로, 현재 수준에서의 감소와 지원 라인 아래의 가까운 감소는 지속적인 약세 제어를 알리며, 잠재적으로 $ 13.08 미만의 판매를 가속화하고 쌍을 $ 10로 밀어 넣을 수 있습니다.
Disclaimer: This article does not provide financial advice. All investment and trading decisions involve risk, and readers should conduct their own thorough research before making any investment choices.
면책 조항 :이 기사는 재정적 조언을 제공하지 않습니다. 모든 투자 및 거래 결정에는 위험이 포함되며 독자는 투자 선택을하기 전에 자신의 철저한 연구를 수행해야합니다.
 The Coin Republic
 BlockchainReporter
 TheCoinrise Media
 BlockchainReporter
 DogeHome
 CFN
CFN Cointelegraph
 CFN
CFN


