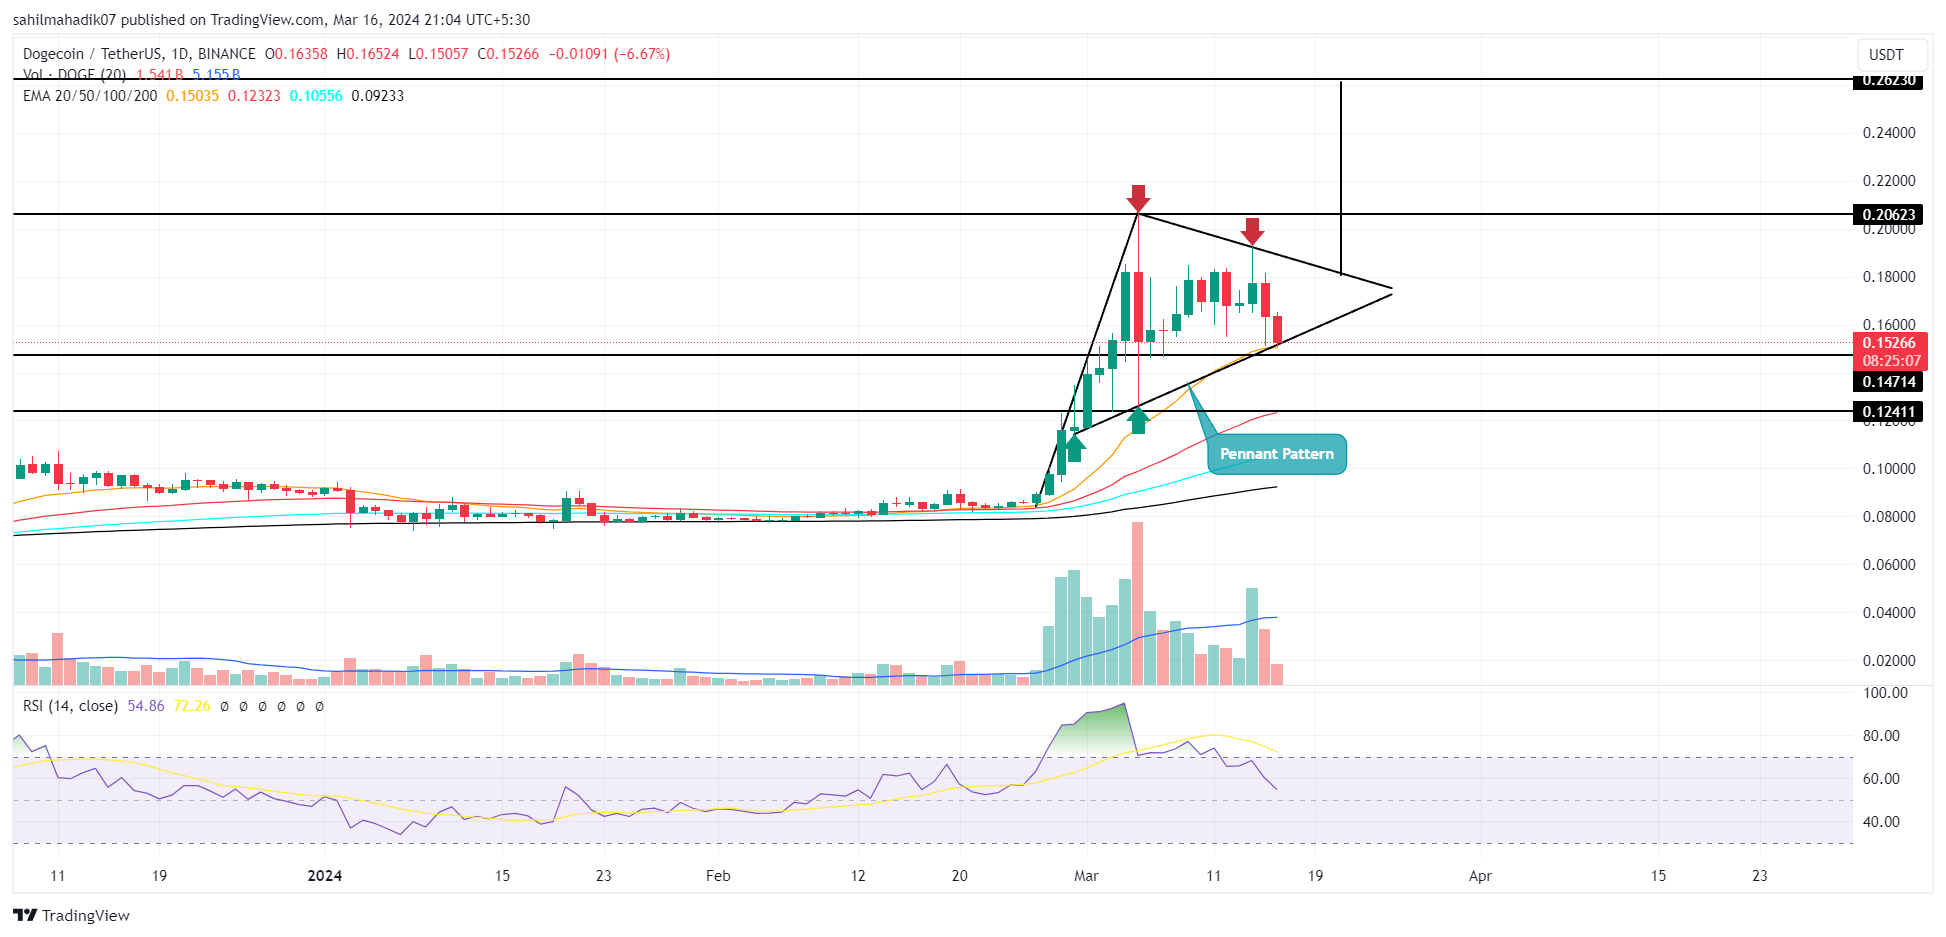
Dogecoin Price: Amid the weekend sell-off in the crypto market, the popular memecoin DOGE witnessed a 21% correction with its price falling from $0.192 to $0.15. However, the correction lies within the safety net of the Fibonacci retracement tool and develops a bullish continuation pattern to indicate the asset is poised for further growth.
狗狗币价格:在加密货币市场周末的抛售中,流行的 memecoin DOGE 出现了 21% 的回调,其价格从 0.192 美元跌至 0.15 美元。然而,修正位于斐波那契回撤工具的安全网之内,并形成看涨持续模式,表明该资产准备进一步增长。
Also Read: 4 Under $1 Crypto Gems To Buy With 1000X Potential In 2024
另请阅读:1 美元以下的 4 种加密宝石在 2024 年具有 1000 倍的潜力
Will $0.15 Support Hold Amid Market Correction?

Dogecoin (DOGE), the largest memecoin by market cap, has witnessed a surge in volatility recently evidenced by the long-wick rejection candle in the daily chart. However, the consolidation resonating within two converging trend lines indicates the formation of a bullish continuation pattern called Pennant.
市场调整期间 0.15 美元的支撑位会持续吗?狗狗币价格| TradingviewDogecoin (DOGE) 是市值最大的模因币,近期波动性激增,日线图表中的长灯芯拒绝蜡烛就证明了这一点。然而,两条聚合趋势线内的盘整共振表明形成了称为三角旗的看涨持续模式。
The nature of this pattern suggests the DOGE price exhausted from the recent rally which surged its price from $0.084 to $0.206 and needed a minor pullback to regain its strength.
这种模式的本质表明,DOGE 价格在最近的反弹中已经疲惫不堪,其价格从 0.084 美元飙升至 0.206 美元,需要小幅回调才能恢复强势。
With a 6.9% intraday loss, the Dogecoin price teases a breakdown below the pattern’s lower trendline. If the market-wide correction bolstered sellers to break this support, the supply pressure will accelerate and invalidate the bullish thesis.
狗狗币价格盘中下跌 6.9%,跌破该模式的较低趋势线。如果整个市场的调整促使卖家突破这一支撑,供应压力将加速并使看涨论点失效。
The post-breakdown fall may have plunged the memecoin value to $0.124 support.
崩溃后的下跌可能使 memecoin 的价值暴跌至 0.124 美元的支撑位。
Also Read: Meme Coins Outperforming Bitcoin This Week
另请阅读:Meme 币本周表现优于比特币
Dogecoin Price Hints Breakout Strategy for the Next Fortnight
If the patterns hold true, the coin price may rebound from the lower trendline to continue the current consolidation. For this Dogecoin price to return to the recovery trend, the Buyer must break the pattern’s upper trendline. The pattern developed on a 4-hour chart hints at another 1-2 weeks of consolidation before a decisive breakout.
狗狗币价格暗示下两周的突破策略如果这种模式成立,狗狗币价格可能会从较低的趋势线反弹,继续当前的盘整。为了让狗狗币价格回到复苏趋势,买方必须突破该模式的上部趋势线。 4 小时图表上形成的模式暗示,在决定性突破之前,还需要 1-2 周的盘整。
The potential breakout may surpass $0.2 and hit a theoretical target of $0.26.
潜在突破可能会超过 0.2 美元,并触及 0.26 美元的理论目标。
Technical Indicator
- Exponential Moving Average: A fasting moving 20-day EMA offers immediate support for buyers to prevent further correction.
- Relative Strength Index: The daily RSI slope downtick at 54% reflects a waning bullish momentum in the market.
技术指标指数移动平均线:快速移动的 20 日均线为买家提供即时支撑,以防止进一步回调。相对强弱指数:每日 RSI 斜率下降 54%,反映出市场看涨势头减弱。


 DogeHome
 Crypto News Land
 ETHNews
 CFN
CFN U_Today
 Thecoinrepublic.com
 Optimisus
 Optimisus


