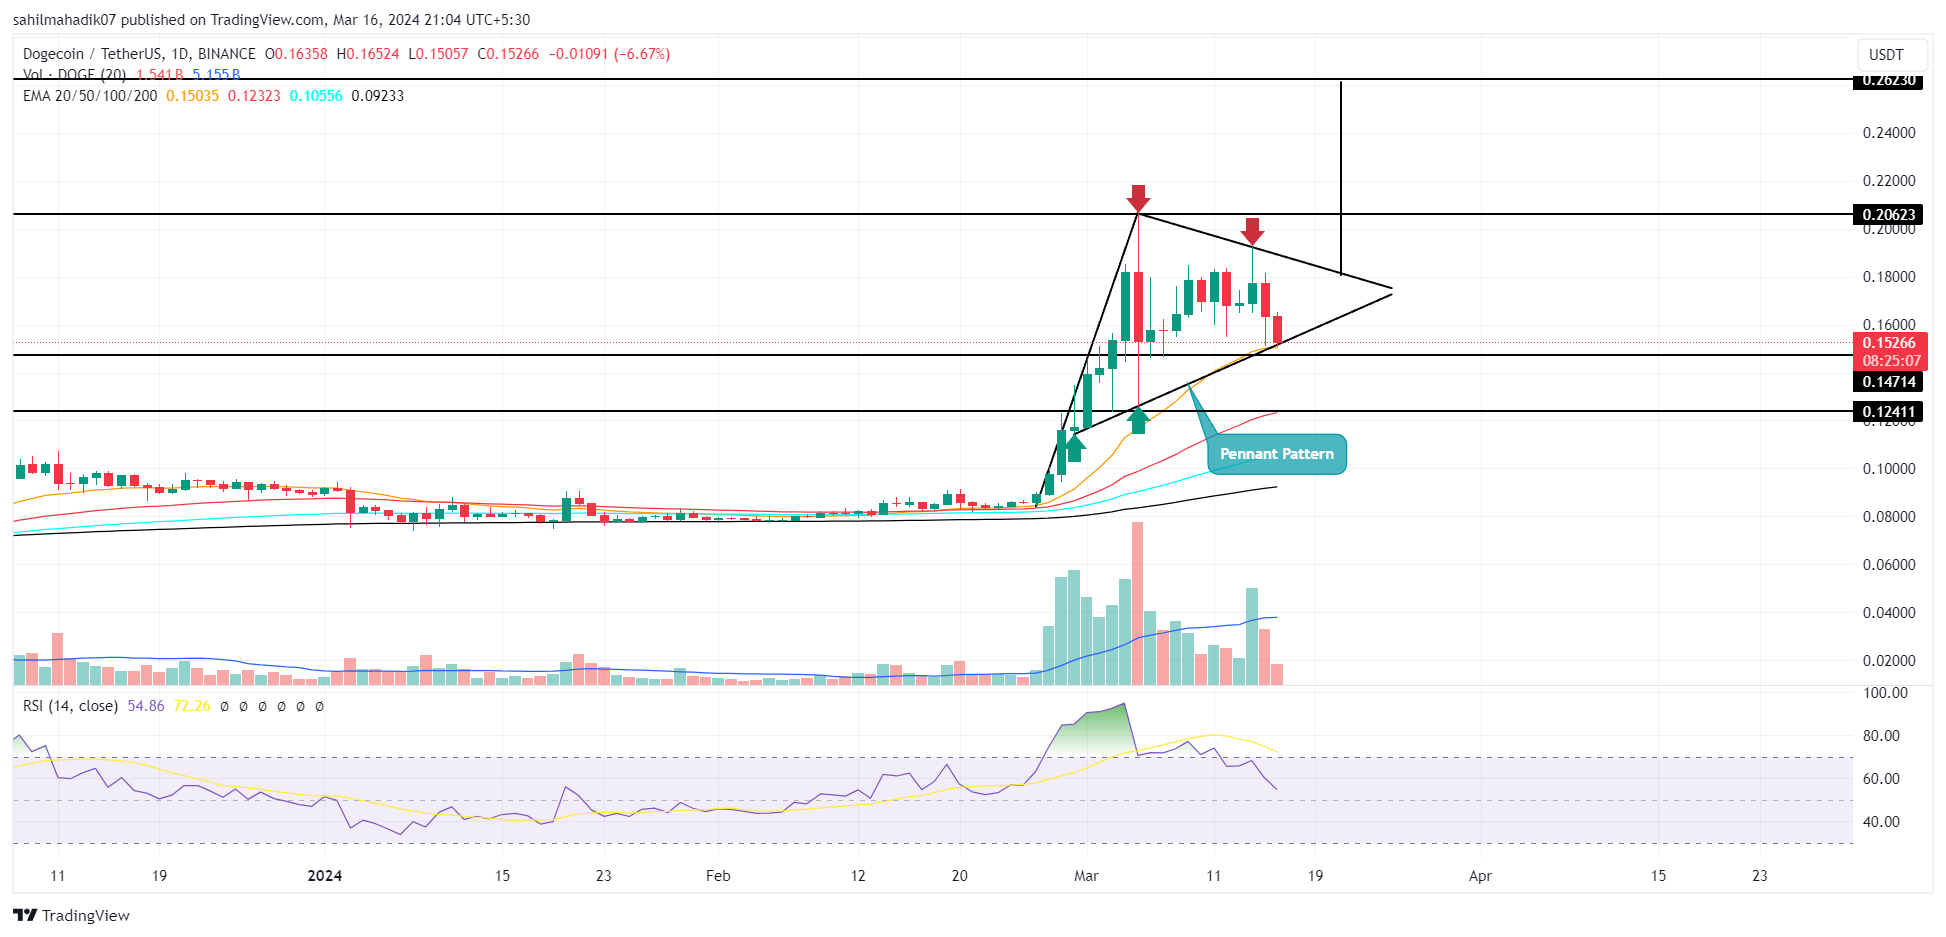
Dogecoin Price: Amid the weekend sell-off in the crypto market, the popular memecoin DOGE witnessed a 21% correction with its price falling from $0.192 to $0.15. However, the correction lies within the safety net of the Fibonacci retracement tool and develops a bullish continuation pattern to indicate the asset is poised for further growth.
Dogecoin 가격: 암호화폐 시장의 주말 매도세 속에서 인기 있는 memecoin DOGE는 가격이 $0.192에서 $0.15로 하락하면서 21% 조정을 목격했습니다. 그러나 수정은 피보나치 되돌림 도구의 안전망 내에 있으며 자산이 추가 성장을 위한 준비가 되어 있음을 나타내는 강세 지속 패턴을 개발합니다.
Also Read: 4 Under $1 Crypto Gems To Buy With 1000X Potential In 2024
또한 읽어 보세요: 2024년에 1000배의 잠재력으로 구매할 수 있는 1달러 미만의 암호화폐 보석 4개
Will $0.15 Support Hold Amid Market Correction?

Dogecoin (DOGE), the largest memecoin by market cap, has witnessed a surge in volatility recently evidenced by the long-wick rejection candle in the daily chart. However, the consolidation resonating within two converging trend lines indicates the formation of a bullish continuation pattern called Pennant.
시장 조정 중에 $0.15 지원이 유지됩니까?Dogecoin 가격| 시가총액 기준으로 가장 큰 밈코인인 TradingviewDogecoin(DOGE)은 최근 일일 차트의 롱윅 거부 캔들에서 입증된 변동성의 급증을 목격했습니다. 그러나 두 개의 수렴 추세선 내에서 횡보가 나타나는 것은 페넌트라 불리는 강세 지속 패턴이 형성되었음을 나타냅니다.
The nature of this pattern suggests the DOGE price exhausted from the recent rally which surged its price from $0.084 to $0.206 and needed a minor pullback to regain its strength.
이 패턴의 특성은 가격이 0.084달러에서 0.206달러로 급등한 최근 랠리로 인해 DOGE 가격이 소진되었으며 강세를 되찾기 위해 약간의 하락이 필요했음을 나타냅니다.
With a 6.9% intraday loss, the Dogecoin price teases a breakdown below the pattern’s lower trendline. If the market-wide correction bolstered sellers to break this support, the supply pressure will accelerate and invalidate the bullish thesis.
장중 6.9% 손실을 입은 Dogecoin 가격은 패턴의 낮은 추세선 아래로 하락세를 보이고 있습니다. 시장 전반의 조정으로 인해 판매자가 이러한 지지를 무너뜨리게 된다면 공급 압력이 가속화되어 강세론이 무효화될 것입니다.
The post-breakdown fall may have plunged the memecoin value to $0.124 support.
붕괴 후 하락으로 인해 memecoin 가치가 $0.124 지원으로 급락했을 수 있습니다.
Also Read: Meme Coins Outperforming Bitcoin This Week
또한 읽으십시오: 이번 주에 비트코인을 능가하는 Meme 코인
Dogecoin Price Hints Breakout Strategy for the Next Fortnight
If the patterns hold true, the coin price may rebound from the lower trendline to continue the current consolidation. For this Dogecoin price to return to the recovery trend, the Buyer must break the pattern’s upper trendline. The pattern developed on a 4-hour chart hints at another 1-2 weeks of consolidation before a decisive breakout.
Dogecoin 가격은 다음 주 동안의 돌파 전략을 암시합니다. 패턴이 사실이라면 코인 가격은 현재의 통합을 계속하기 위해 낮은 추세선에서 반등할 수 있습니다. 이 Dogecoin 가격이 회복 추세로 돌아가려면 구매자가 패턴의 상위 추세선을 깨야 합니다. 4시간 차트에서 전개된 패턴은 결정적인 돌파가 일어나기 전에 1~2주간의 통합이 더 이어질 것임을 암시합니다.
The potential breakout may surpass $0.2 and hit a theoretical target of $0.26.
잠재적인 돌파는 $0.2를 초과하고 $0.26의 이론적 목표에 도달할 수 있습니다.
Technical Indicator
- Exponential Moving Average: A fasting moving 20-day EMA offers immediate support for buyers to prevent further correction.
- Relative Strength Index: The daily RSI slope downtick at 54% reflects a waning bullish momentum in the market.
기술 지표지수 이동 평균: 빠르게 움직이는 20일 EMA는 구매자가 추가 조정을 방지할 수 있도록 즉각적인 지원을 제공합니다. 상대 강도 지수: 일일 RSI 기울기 하락폭이 54%인 것은 시장의 약세 모멘텀을 반영합니다.


 DogeHome
 CoinPedia News
 TheCoinrise Media
 BH NEWS
 COINTURK NEWS
 BlockchainReporter
 Crypto News Land
 Cryptopolitan_News


