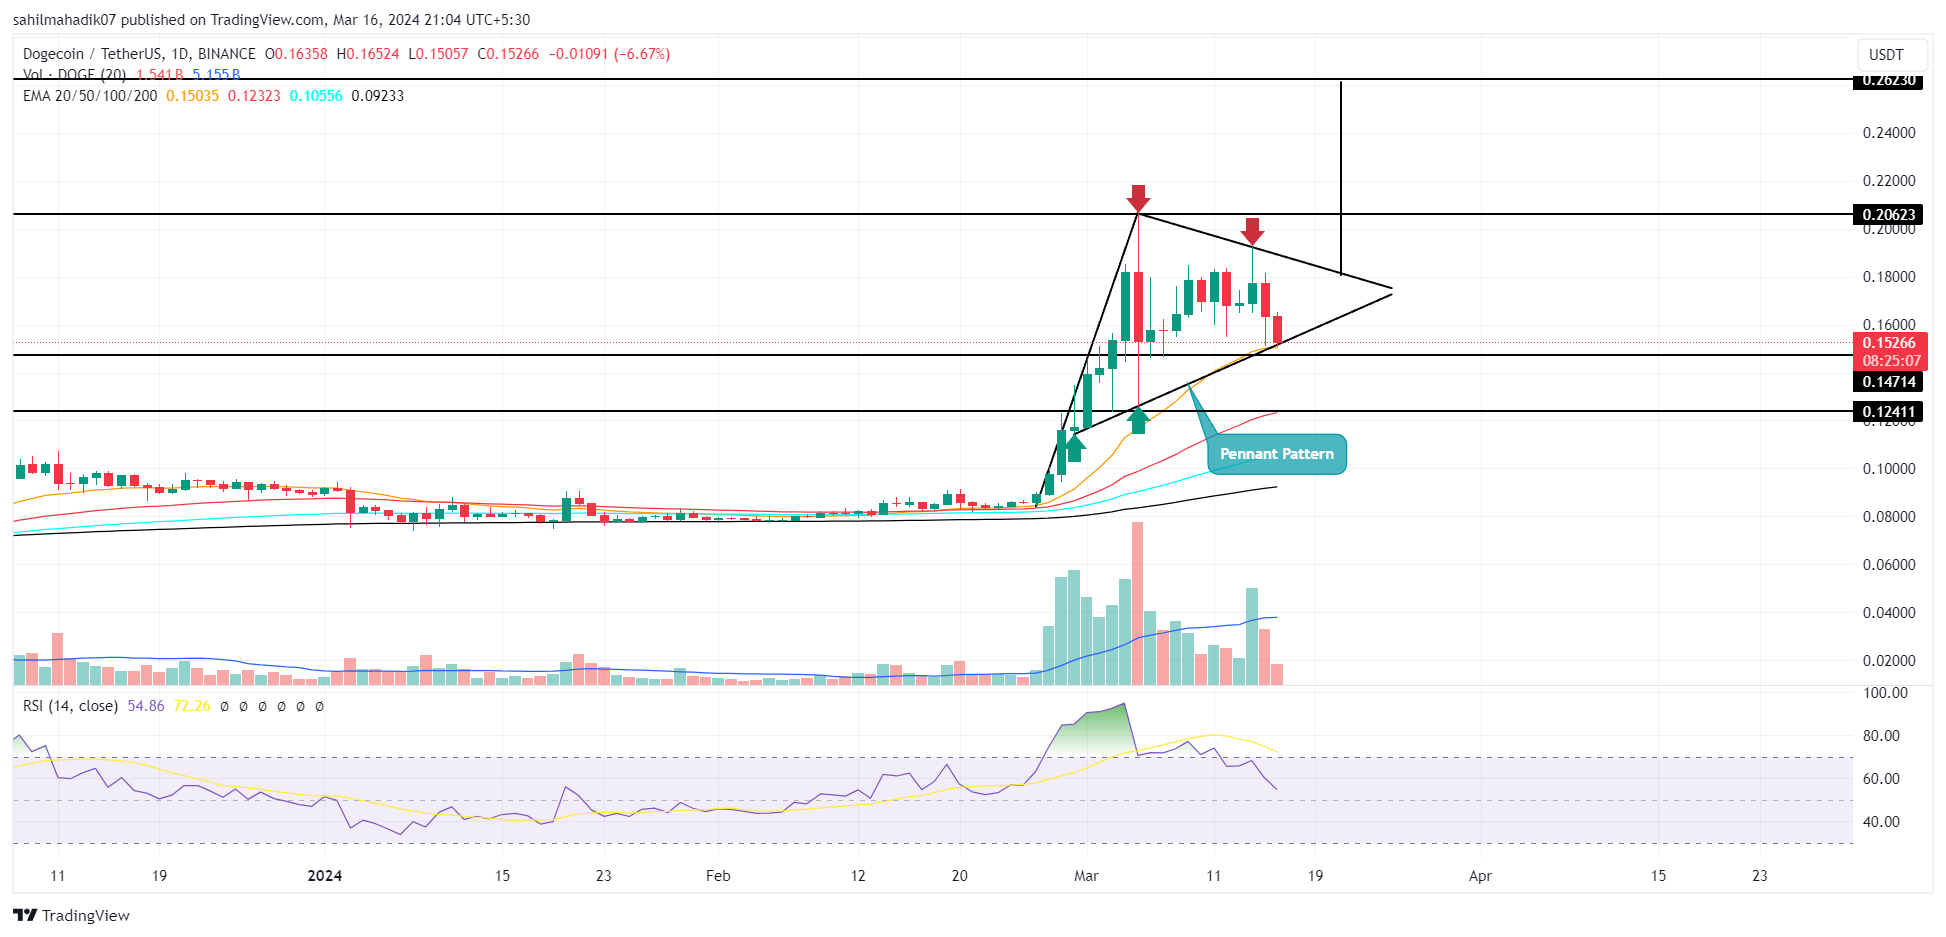
Dogecoin Price: Amid the weekend sell-off in the crypto market, the popular memecoin DOGE witnessed a 21% correction with its price falling from $0.192 to $0.15. However, the correction lies within the safety net of the Fibonacci retracement tool and develops a bullish continuation pattern to indicate the asset is poised for further growth.
ドージコイン価格:週末の暗号通貨市場の下落のさなか、人気のミームコインドージは21%の調整を目撃し、価格は0.192ドルから0.15ドルに下落しました。ただし、この調整はフィボナッチ・リトレースメント・ツールのセーフティネット内にあり、資産がさらなる成長の準備ができていることを示す強気の継続パターンを展開します。
Also Read: 4 Under $1 Crypto Gems To Buy With 1000X Potential In 2024
こちらもお読みください:2024年に1000倍の可能性を秘めた1ドル未満の仮想通貨ジェム4つを購入
Will $0.15 Support Hold Amid Market Correction?

Dogecoin (DOGE), the largest memecoin by market cap, has witnessed a surge in volatility recently evidenced by the long-wick rejection candle in the daily chart. However, the consolidation resonating within two converging trend lines indicates the formation of a bullish continuation pattern called Pennant.
市場調整中、0.15ドルのサポートは維持されるのか?ドージコイン価格|時価総額で最大のミームコインであるTradingviewDogecoin(DOGE)は、日足チャートの長い芯の拒絶ローソクによって証明されるように、最近ボラティリティの急上昇を目撃しました。ただし、2 つの収束トレンド ライン内で共鳴する保ち合いは、ペナントと呼ばれる強気の継続パターンの形成を示しています。
The nature of this pattern suggests the DOGE price exhausted from the recent rally which surged its price from $0.084 to $0.206 and needed a minor pullback to regain its strength.
このパターンの性質は、DOGE価格が0.084ドルから0.206ドルまで価格を急騰させた最近の上昇で疲弊しており、その強さを取り戻すには若干の反発が必要だったことを示唆しています。
With a 6.9% intraday loss, the Dogecoin price teases a breakdown below the pattern’s lower trendline. If the market-wide correction bolstered sellers to break this support, the supply pressure will accelerate and invalidate the bullish thesis.
6.9%の日中損失を伴うドージコイン価格は、パターンの下側トレンドラインを下回る内訳を示唆しています。市場全体の調整により売り手がこの支持線を突破するよう後押しされた場合、供給圧力が加速し、強気理論は無効になるだろう。
The post-breakdown fall may have plunged the memecoin value to $0.124 support.
暴落後の下落により、ミームコインの価値は0.124ドルのサポートまで急落した可能性がある。
Also Read: Meme Coins Outperforming Bitcoin This Week
こちらもお読みください: 今週、ミームコインがビットコインを上回りました
Dogecoin Price Hints Breakout Strategy for the Next Fortnight
If the patterns hold true, the coin price may rebound from the lower trendline to continue the current consolidation. For this Dogecoin price to return to the recovery trend, the Buyer must break the pattern’s upper trendline. The pattern developed on a 4-hour chart hints at another 1-2 weeks of consolidation before a decisive breakout.
ドージコイン価格が今後 2 週間のブレイクアウト戦略を示唆パターンが当てはまる場合、コイン価格は下位トレンドラインから反発して現在の値動きを継続する可能性があります。このドージコインの価格が回復傾向に戻るには、買い手はパターンの上部トレンドラインを突破する必要があります。 4時間足チャートで展開されたパターンは、決定的なブレイクアウトまでにさらに1〜2週間の値崩れを示唆しています。
The potential breakout may surpass $0.2 and hit a theoretical target of $0.26.
潜在的なブレイクアウトは0.2ドルを超え、理論上の目標である0.26ドルに達する可能性がある。
Technical Indicator
- Exponential Moving Average: A fasting moving 20-day EMA offers immediate support for buyers to prevent further correction.
- Relative Strength Index: The daily RSI slope downtick at 54% reflects a waning bullish momentum in the market.
テクニカル指標指数移動平均: 急速に移動する 20 日間 EMA は、さらなる調整を防ぐために買い手に即座のサポートを提供します。相対力指数: 54% での毎日の RSI の傾きの下降は、市場の強気の勢いの衰えを反映しています。


 DogeHome
 CoinPedia News
 TheCoinrise Media
 BH NEWS
 COINTURK NEWS
 BlockchainReporter
 Crypto News Land
 Cryptopolitan_News


