Cryptocurrency Market Analysis and Predictions
In recent weeks, the cryptocurrency market has experienced a decline in gains, primarily attributed to SEC-related processes. The delay in Ethereum ETF applications has exerted selling pressure on Ethereum and numerous altcoin projects. We analyze potential outcomes for Pepe and Arweave through detailed chart analysis and key levels.
Pepe Chart Analysis
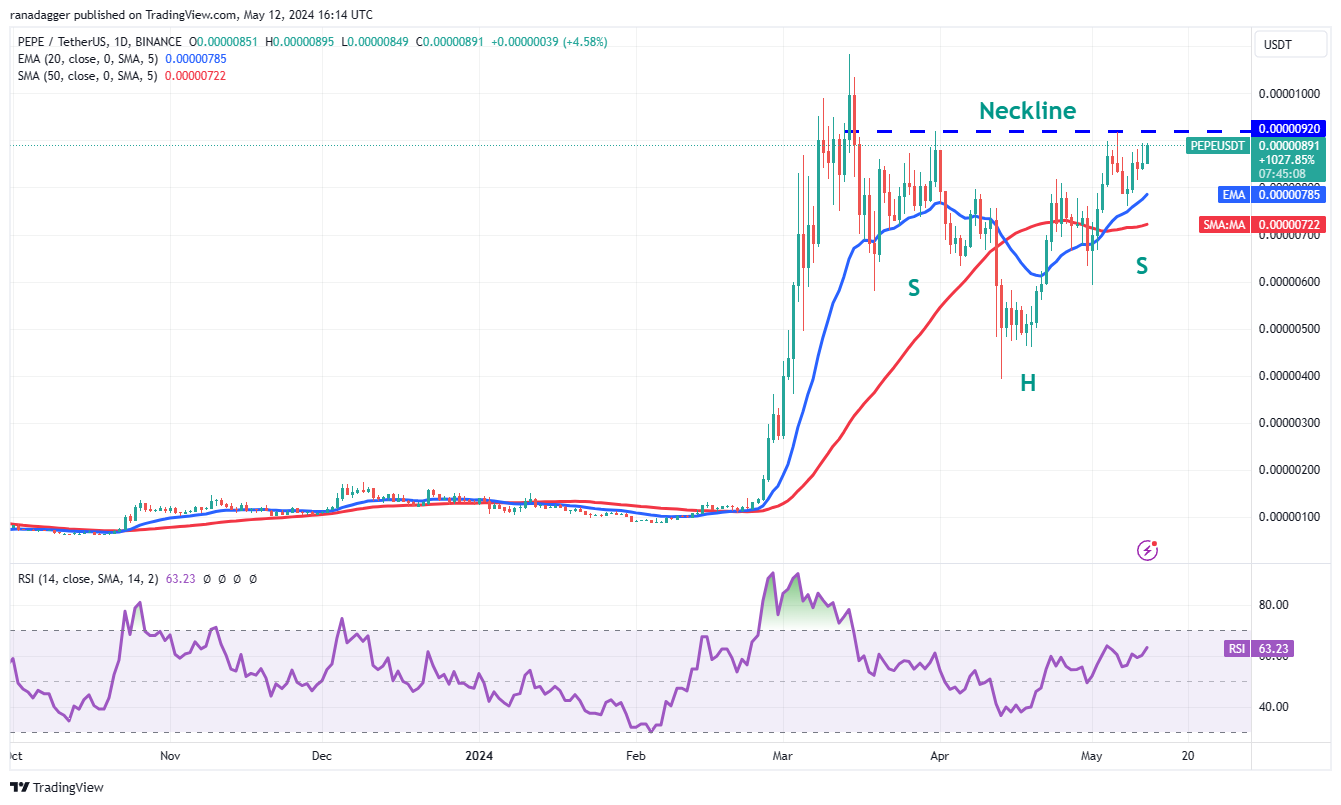
Pepe has exhibited a steady recovery in recent days, suggesting continued purchases at lower levels. Its price movement has formed an inverse head-and-shoulders pattern, which will be validated by a breakout above $0.0000092. If buyers sustain the price above the neckline, the PEPE/USDT pair may extend its uptrend. The bullish setup's formation target is $0.0000145.

Moving averages are anticipated to provide robust support during pullbacks. A recovery above the moving averages will signal positive sentiment and ongoing dip buying. However, a breach of the $0.0000060 support could shift the trend negatively in the short term.

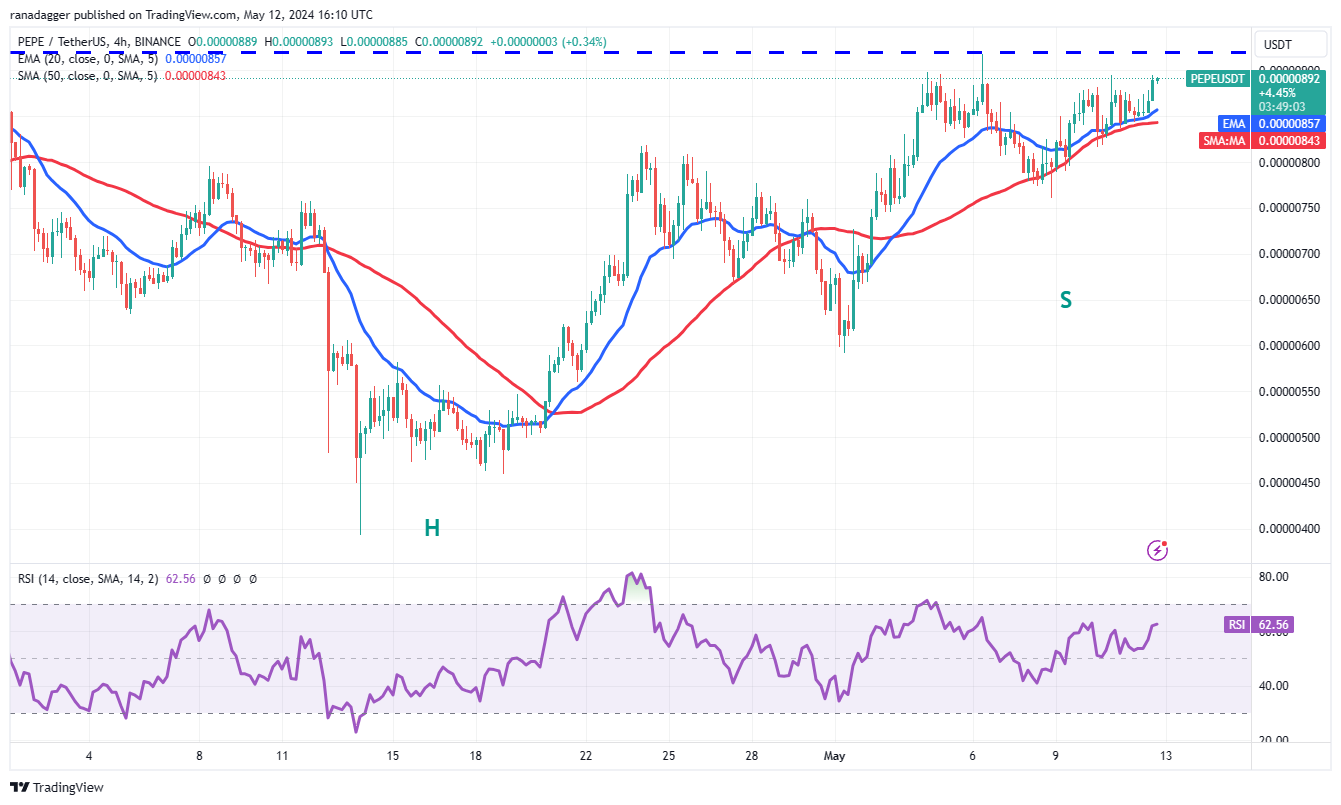
The 4-hour chart reveals support at moving averages, indicating that bulls are defending this level tenaciously. Buyers aim to overcome the $0.0000092 resistance. A price decline and breach below the moving averages would suggest a bearish resurgence. The price may then decline to the critical support at $0.0000076, where bulls are likely to initiate significant buying.
Arweave Chart Analysis
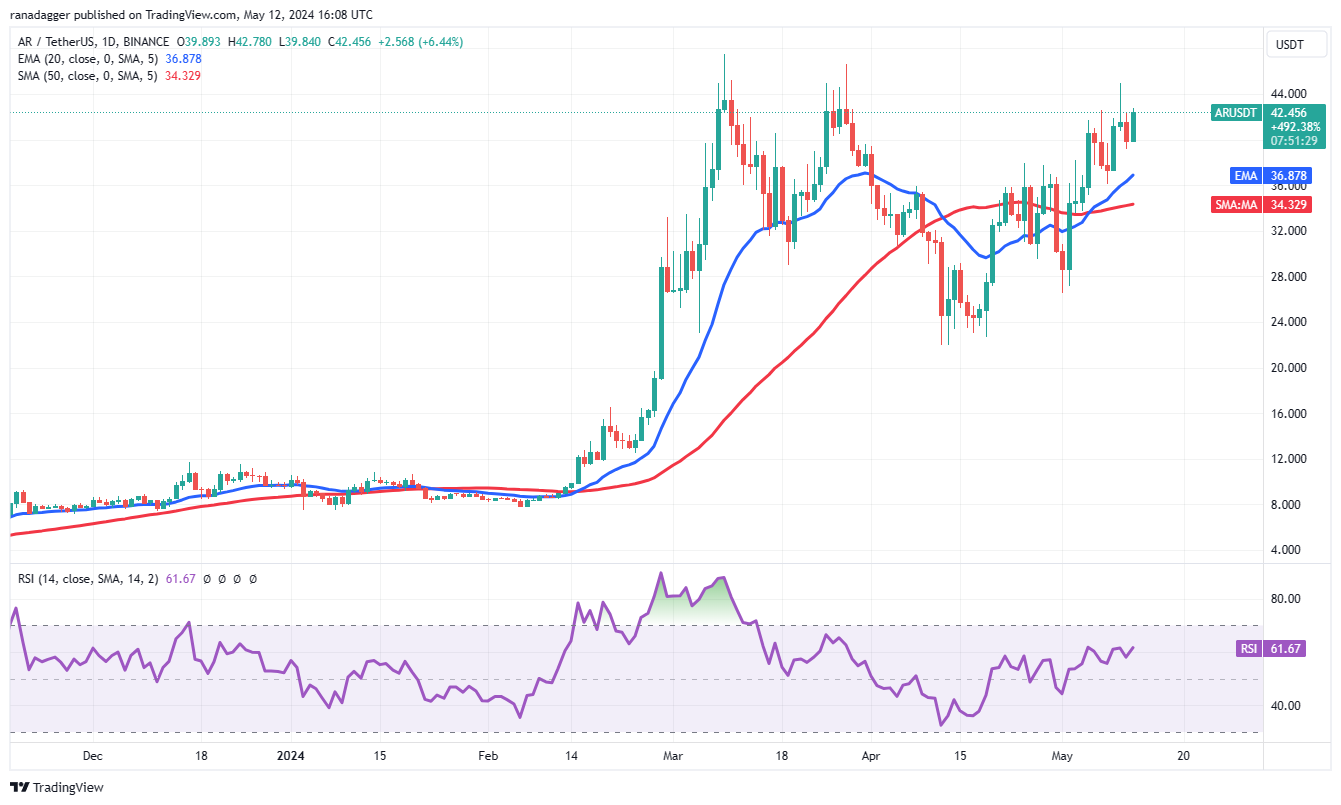
Arweave (AR) has been trending upward over the past few days, demonstrating strong bullish momentum. The rising 20-day EMA at $36 and RSI above 61 indicate bullish dominance. The AR/USDT pair could encounter a significant resistance level at $47.51. If bulls drive the price above this resistance, the pair may surge towards $52 and subsequently $68.

Should the pair retrace and break below the moving averages, this positive outlook could be invalidated in the near term, potentially leading to a decline towards $26.50.

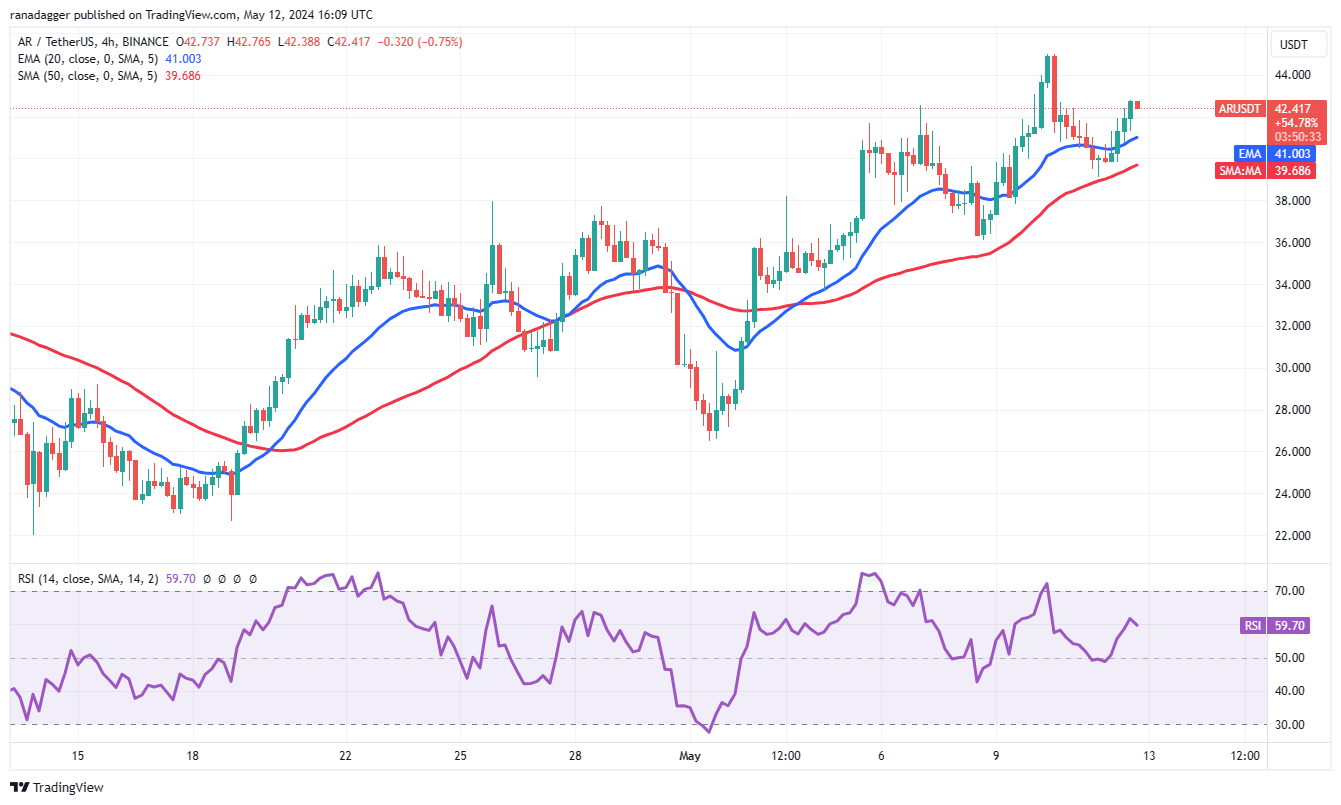
The 4-hour chart indicates support at the SMA 50 during pullbacks. Buyers will attempt to elevate the price to $45 and then $47.51. Sellers are anticipated to mount a strong defense in this area, as failure to do so could accelerate the upward momentum.
The SMA 50 is a crucial support to monitor in the event of a bearish reversal. If this level breaks, the pair could decline to $36 and then to $34. The price may recover from this region but is likely to face selling pressure at the EMA 20.


 Crypto Daily™
 TheCoinrise Media
 Crypto Daily™
 DogeHome
 ETHNews
 Crypto Daily™
 crypto.ro English
 Thecoinrepublic.com
 Crypto Daily™


