Cryptocurrency Market Analysis and Predictions
加密货币市场分析与预测
In recent weeks, the cryptocurrency market has experienced a decline in gains, primarily attributed to SEC-related processes. The delay in Ethereum ETF applications has exerted selling pressure on Ethereum and numerous altcoin projects. We analyze potential outcomes for Pepe and Arweave through detailed chart analysis and key levels.
最近几周,加密货币市场的涨幅有所下降,这主要归因于 SEC 相关流程。以太坊 ETF 申请的延迟给以太坊和众多山寨币项目带来了抛售压力。我们通过详细的图表分析和关键水平来分析 Pepe 和 Arweave 的潜在结果。
Pepe Chart Analysis
佩佩图表分析
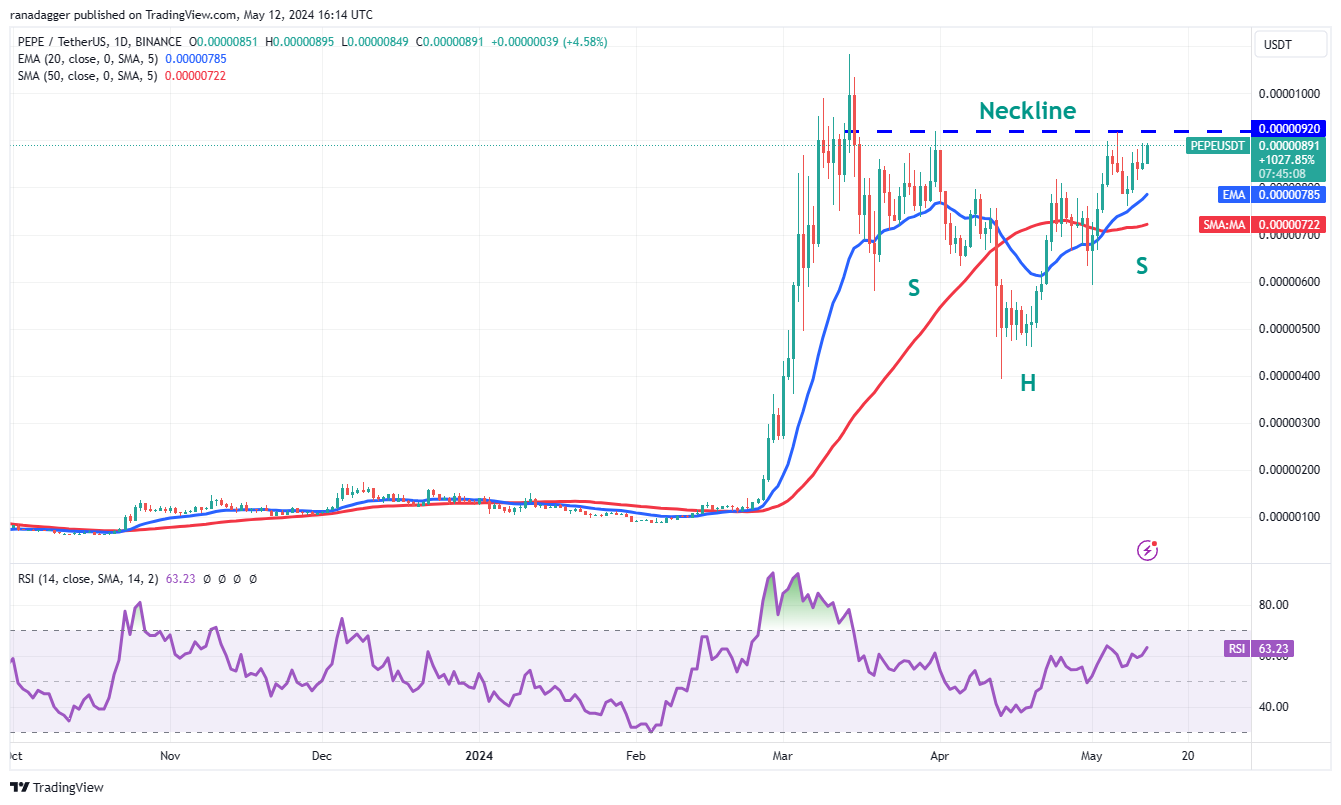
Pepe has exhibited a steady recovery in recent days, suggesting continued purchases at lower levels. Its price movement has formed an inverse head-and-shoulders pattern, which will be validated by a breakout above $0.0000092. If buyers sustain the price above the neckline, the PEPE/USDT pair may extend its uptrend. The bullish setup's formation target is $0.0000145.
佩佩最近几天表现出稳步复苏,表明继续以较低水平购买。其价格走势已形成反向头肩形态,突破 0.0000092 美元上方将验证这一形态。如果买家将价格维持在颈线上方,PEPE/USDT 货币对可能会延续其上涨趋势。看涨设置的形成目标是 0.0000145 美元。

Moving averages are anticipated to provide robust support during pullbacks. A recovery above the moving averages will signal positive sentiment and ongoing dip buying. However, a breach of the $0.0000060 support could shift the trend negatively in the short term.
预计移动平均线将在回调期间提供强劲支撑。复苏至移动平均线之上将预示着积极的情绪和持续的逢低买盘。然而,突破 0.0000060 美元的支撑位可能会在短期内对趋势产生负面影响。

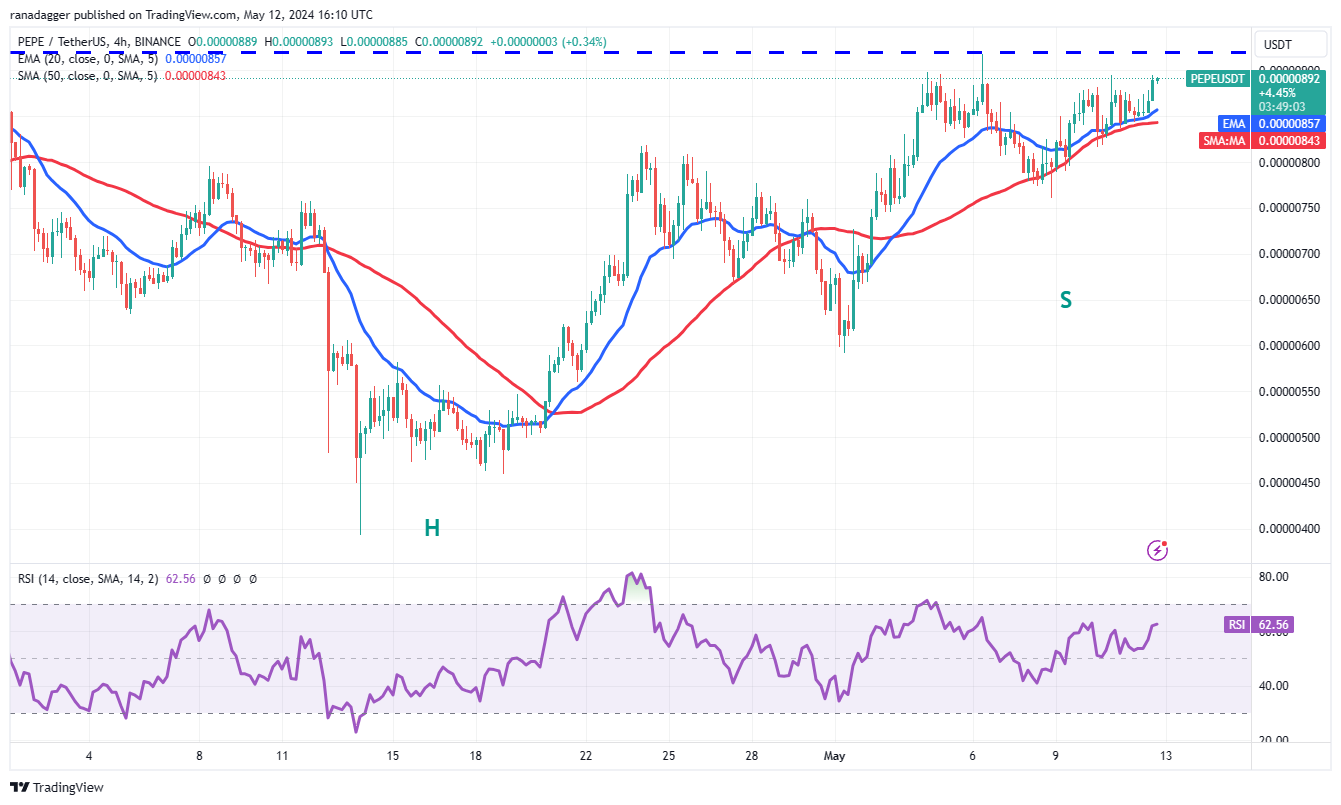
The 4-hour chart reveals support at moving averages, indicating that bulls are defending this level tenaciously. Buyers aim to overcome the $0.0000092 resistance. A price decline and breach below the moving averages would suggest a bearish resurgence. The price may then decline to the critical support at $0.0000076, where bulls are likely to initiate significant buying.
4小时图显示移动平均线有支撑,表明多头正在顽强地捍卫这一水平。买家的目标是克服 0.0000092 美元的阻力位。价格下跌并跌破移动平均线将表明看跌情绪卷土重来。然后价格可能会跌至 0.0000076 美元的关键支撑位,多头可能会在该支撑位发起大量买盘。
Arweave Chart Analysis
Arweave 图表分析
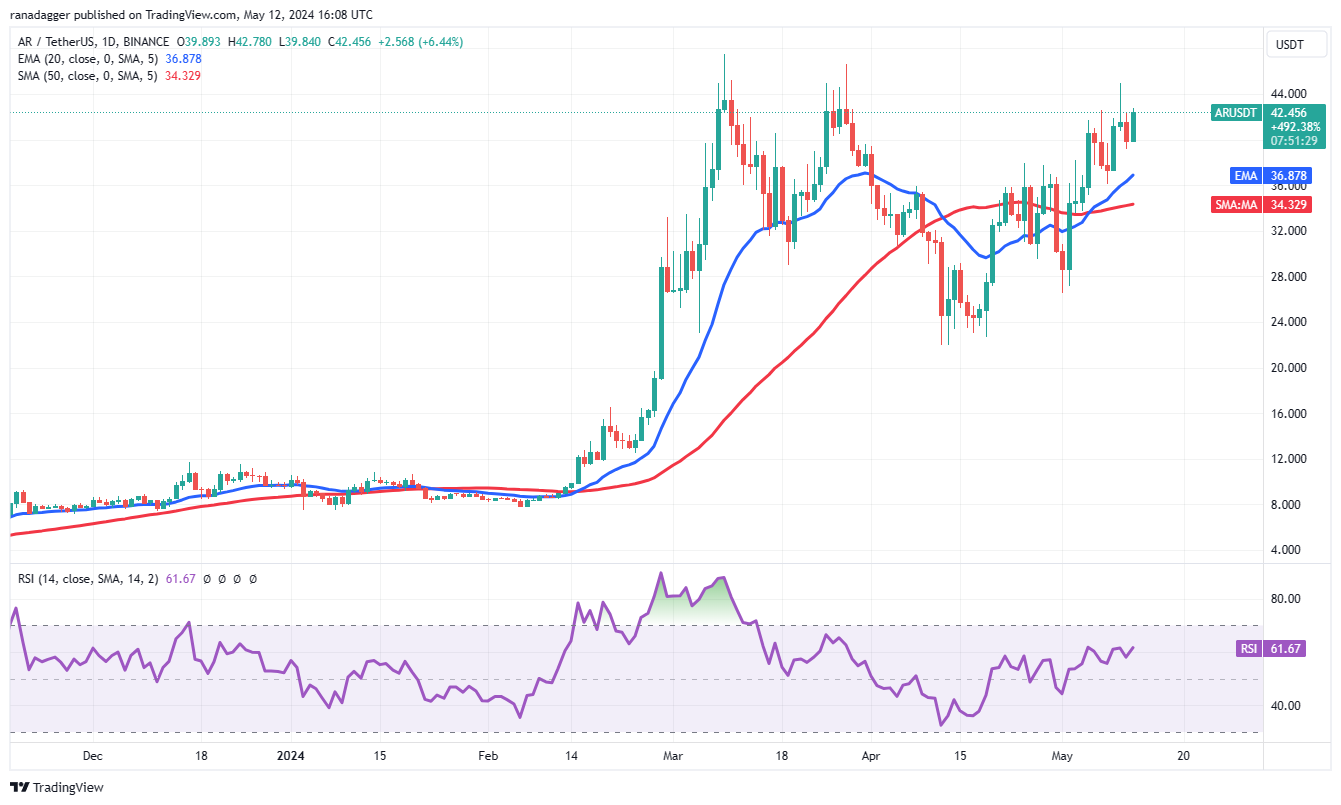
Arweave (AR) has been trending upward over the past few days, demonstrating strong bullish momentum. The rising 20-day EMA at $36 and RSI above 61 indicate bullish dominance. The AR/USDT pair could encounter a significant resistance level at $47.51. If bulls drive the price above this resistance, the pair may surge towards $52 and subsequently $68.
Arweave(AR)过去几天一直呈上升趋势,显示出强劲的看涨势头。 20 日均线上涨至 36 美元,RSI 高于 61 表明看涨主导。 AR/USDT 货币对可能会遇到 47.51 美元的重大阻力位。如果多头推动价格突破该阻力位,该货币对可能会飙升至 52 美元,随后升至 68 美元。

Should the pair retrace and break below the moving averages, this positive outlook could be invalidated in the near term, potentially leading to a decline towards $26.50.
如果该货币对回撤并跌破移动平均线,这种积极前景可能会在短期内失效,并可能导致跌向 26.50 美元。

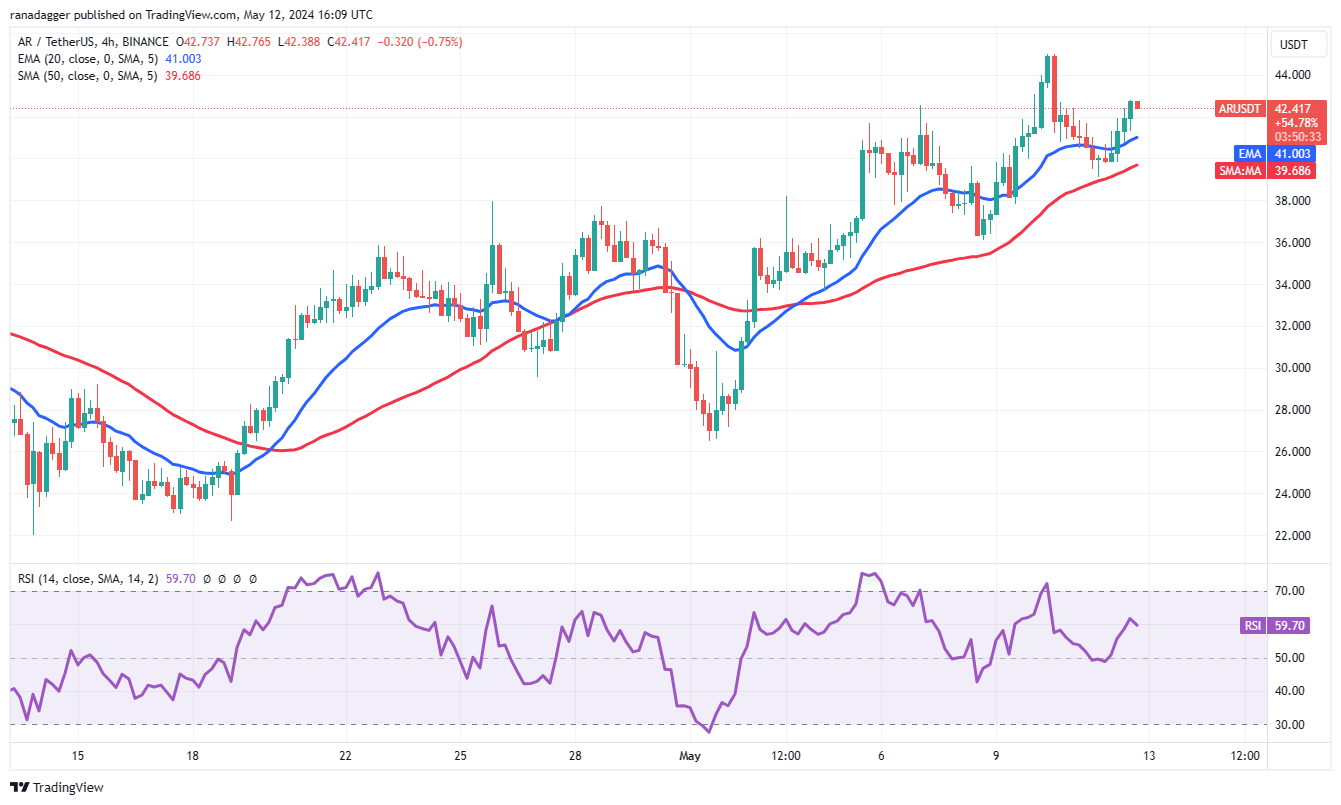
The 4-hour chart indicates support at the SMA 50 during pullbacks. Buyers will attempt to elevate the price to $45 and then $47.51. Sellers are anticipated to mount a strong defense in this area, as failure to do so could accelerate the upward momentum.
4 小时图显示回调期间 50 移动平均线有支撑。买家会尝试将价格提高到 45 美元,然后是 47.51 美元。预计卖家将在这一领域采取强有力的防御措施,因为如果不这样做可能会加速上涨势头。
The SMA 50 is a crucial support to monitor in the event of a bearish reversal. If this level breaks, the pair could decline to $36 and then to $34. The price may recover from this region but is likely to face selling pressure at the EMA 20.
50 移动平均线是出现看跌逆转时需要监控的重要支撑位。如果突破该水平,该货币对可能会跌至 36 美元,然后跌至 34 美元。价格可能会从该区域回升,但可能会在 20 EMA 处面临抛售压力。


 Cryptopolitan_News
 CryptoNewsLand
 DogeHome
 CryptoNewsLand
 crypto.ro English
 CoinoMedia
 TheCoinrise


