Cryptocurrency Market Analysis and Predictions
暗号通貨市場の分析と予測
In recent weeks, the cryptocurrency market has experienced a decline in gains, primarily attributed to SEC-related processes. The delay in Ethereum ETF applications has exerted selling pressure on Ethereum and numerous altcoin projects. We analyze potential outcomes for Pepe and Arweave through detailed chart analysis and key levels.
ここ数週間、暗号通貨市場は主に SEC 関連のプロセスに起因して利益の減少を経験しました。イーサリアムETF申請の遅れにより、イーサリアムや数多くのアルトコインプロジェクトに売り圧力がかかっている。詳細なチャート分析と主要レベルを通じて、ペペとアルウィーヴの潜在的な結果を分析します。
Pepe Chart Analysis
ペペチャート分析
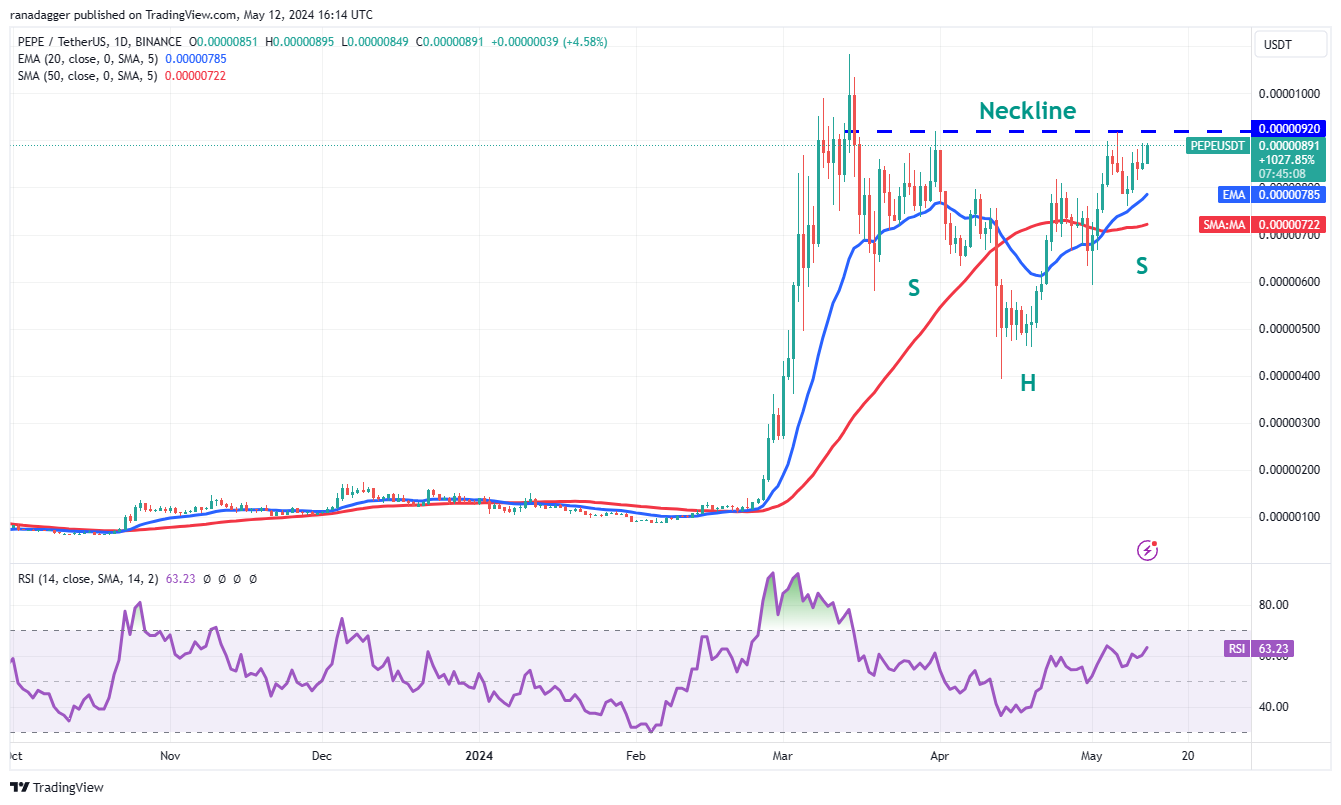
Pepe has exhibited a steady recovery in recent days, suggesting continued purchases at lower levels. Its price movement has formed an inverse head-and-shoulders pattern, which will be validated by a breakout above $0.0000092. If buyers sustain the price above the neckline, the PEPE/USDT pair may extend its uptrend. The bullish setup's formation target is $0.0000145.
ペペはここ数日着実な回復を示しており、より低い水準での購入が継続していることを示唆している。その価格変動は逆ヘッドアンドショルダーパターンを形成しており、0.0000092ドルを超えるブレイクアウトによって検証されるでしょう。買い手がネックラインを上回る価格を維持すれば、PEPE/USDTペアは上昇トレンドを延長する可能性がある。強気セットアップの形成目標は 0.0000145 ドルです。

Moving averages are anticipated to provide robust support during pullbacks. A recovery above the moving averages will signal positive sentiment and ongoing dip buying. However, a breach of the $0.0000060 support could shift the trend negatively in the short term.
移動平均は、反落時に強力なサポートを提供すると予想されます。移動平均を上回る回復は、ポジティブなセンチメントと継続的な押し目買いを示唆するでしょう。ただし、0.0000060ドルのサポートを突破すると、短期的には傾向がマイナスに変化する可能性があります。

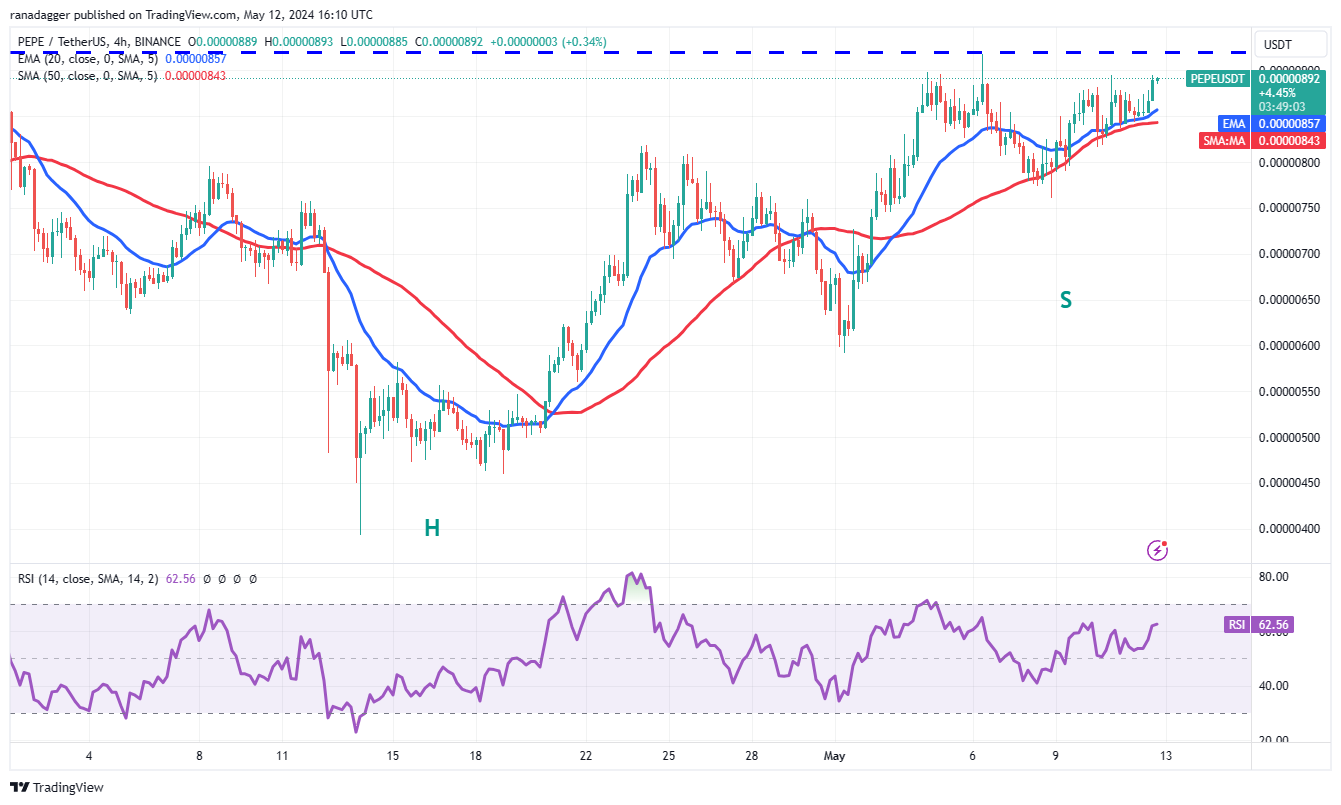
The 4-hour chart reveals support at moving averages, indicating that bulls are defending this level tenaciously. Buyers aim to overcome the $0.0000092 resistance. A price decline and breach below the moving averages would suggest a bearish resurgence. The price may then decline to the critical support at $0.0000076, where bulls are likely to initiate significant buying.
4時間足チャートは移動平均線でのサポートを明らかにしており、強気派がこのレベルを粘り強く守っていることを示しています。買い手は0.0000092ドルの抵抗を克服することを目指しています。価格が下落し、移動平均を下回った場合は、弱気の復活が示唆されるでしょう。その後、価格は0.0000076ドルの重要なサポートまで下落する可能性があり、強気派は大幅な買いを開始する可能性があります。
Arweave Chart Analysis
Arweave チャート分析
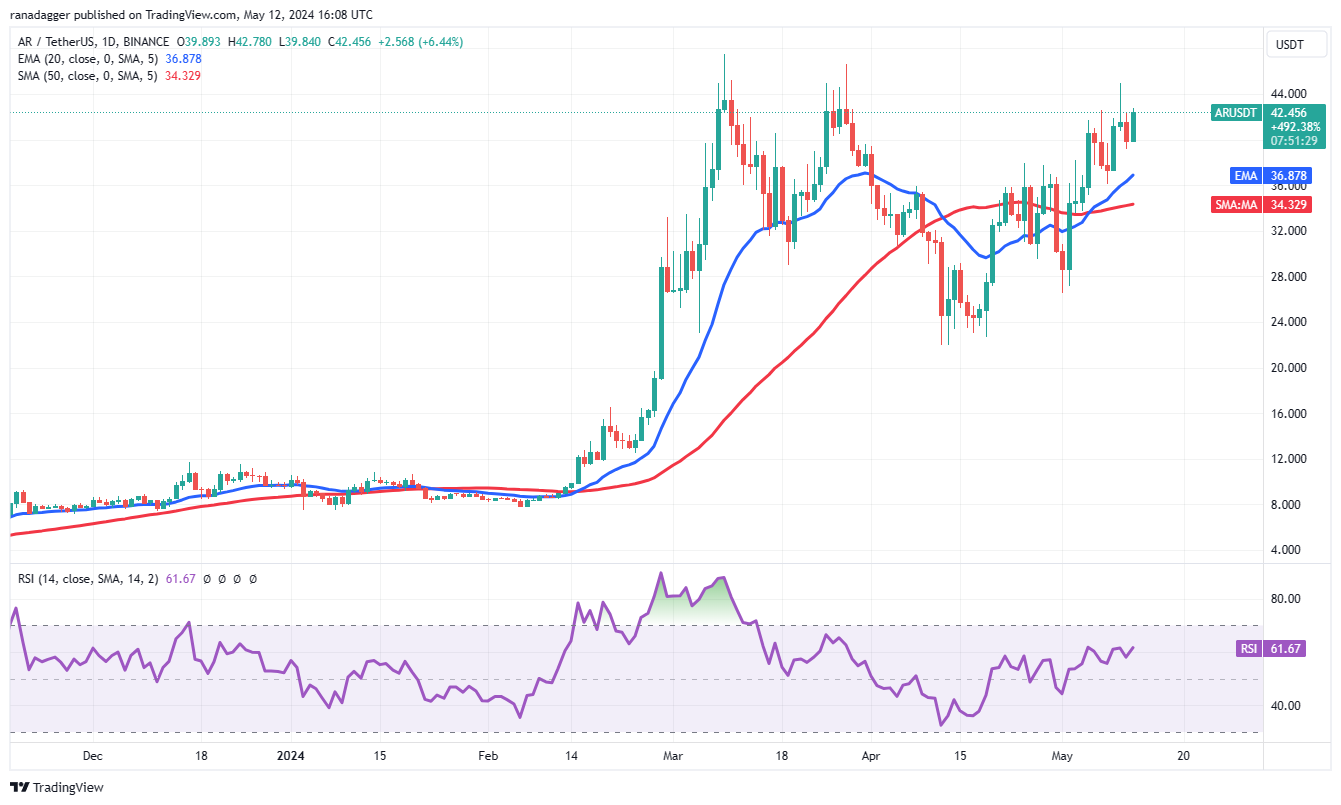
Arweave (AR) has been trending upward over the past few days, demonstrating strong bullish momentum. The rising 20-day EMA at $36 and RSI above 61 indicate bullish dominance. The AR/USDT pair could encounter a significant resistance level at $47.51. If bulls drive the price above this resistance, the pair may surge towards $52 and subsequently $68.
Arweave (AR) は過去数日間上昇傾向にあり、強い強気の勢いを示しています。 20 日間 EMA が 36 ドルで上昇しており、RSI が 61 を超えていることは、強気の優位性を示しています。 AR/USDTペアは47.51ドルで大きな抵抗線に遭遇する可能性がある。強気派がこの抵抗線を超えて価格を上昇させた場合、ペアは52ドル、その後68ドルに向けて急騰する可能性があります。

Should the pair retrace and break below the moving averages, this positive outlook could be invalidated in the near term, potentially leading to a decline towards $26.50.
ペアがリトレースして移動平均を下回った場合、この前向きな見通しは短期的に無効になり、26.50ドルに向けて下落する可能性があります。

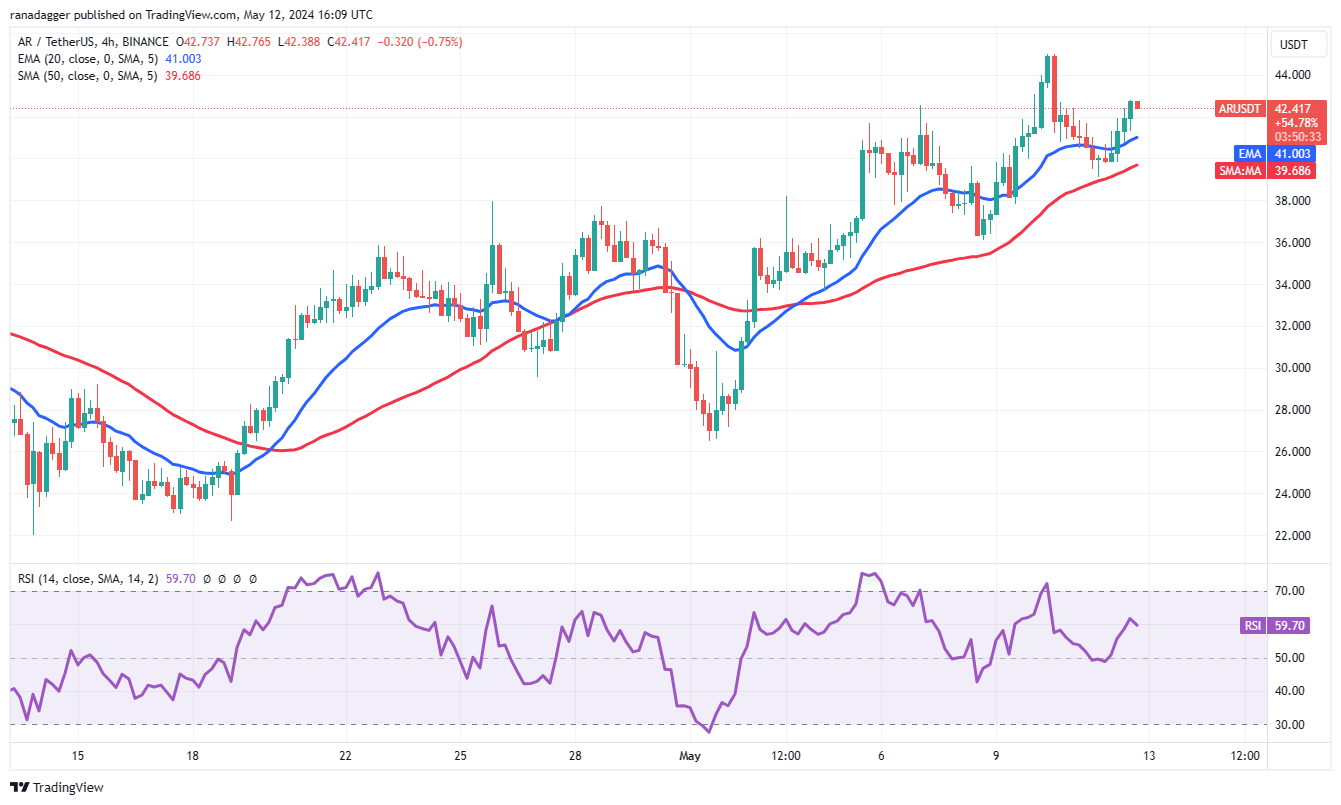
The 4-hour chart indicates support at the SMA 50 during pullbacks. Buyers will attempt to elevate the price to $45 and then $47.51. Sellers are anticipated to mount a strong defense in this area, as failure to do so could accelerate the upward momentum.
4時間足チャートは、反落中のSMA 50でのサポートを示しています。買い手は価格を45ドル、さらに47.51ドルに引き上げようとします。売り手はこの分野で強力な防御策を講じると予想されており、それができなければ上昇の勢いが加速する可能性がある。
The SMA 50 is a crucial support to monitor in the event of a bearish reversal. If this level breaks, the pair could decline to $36 and then to $34. The price may recover from this region but is likely to face selling pressure at the EMA 20.
SMA 50 は弱気反転の際に監視すべき重要なサポートです。このレベルを破れば、ペアは36ドルに下落し、その後34ドルに下落する可能性がある。価格はこの地域から回復する可能性がありますが、EMA 20では売り圧力に直面する可能性があります。


 Thecoinrepublic.com
 Cryptopolitan_News
 CryptoNewsLand
 DogeHome
 CryptoNewsLand
 crypto.ro English
 CoinoMedia


